. 2023 May 1;34(5):857-875.
doi: 10.1681/ASN.0000000000000066. Epub 2023 Jan 5.

Novel Genetic Variants Associated with Chronic Kidney Disease Progression

Affiliations

Novel Genetic Variants Associated with Chronic Kidney Disease Progression

Miyeun Han et al. J Am Soc Nephrol. .

Erratum in

  • Correction: Incorrect Prepublished Article DOIs.
    [No authors listed] [No authors listed] J Am Soc Nephrol. 2023 Apr 1;34(4):723. doi: 10.1681/ASN.0000000000000080. Epub 2023 Feb 1. J Am Soc Nephrol. 2023. PMID: 36735808 Free PMC article. No abstract available.

Abstract

Significance statement: eGFR slope has been used as a surrogate outcome for progression of CKD. However, genetic markers associated with eGFR slope among patients with CKD were unknown. We aimed to identify genetic susceptibility loci associated with eGFR slope. A two-phase genome-wide association study identified single nucleotide polymorphisms (SNPs) in TPPP and FAT1-LINC02374 , and 22 of them were used to derive polygenic risk scores that mark the decline of eGFR by disrupting binding of nearby transcription factors. This work is the first to identify the impact of TPPP and FAT1-LINC02374 on CKD progression, providing predictive markers for the decline of eGFR in patients with CKD.

Background: The incidence of CKD is associated with genetic factors. However, genetic markers associated with the progression of CKD have not been fully elucidated.

Methods: We conducted a genome-wide association study among 1738 patients with CKD, mainly from the KoreaN cohort study for Outcomes in patients With CKD. The outcome was eGFR slope. We performed a replication study for discovered single nucleotide polymorphisms (SNPs) with P <10 -6 in 2498 patients with CKD from the Chronic Renal Insufficiency Cohort study. Several expression quantitative trait loci (eQTL) studies, pathway enrichment analyses, exploration of epigenetic architecture, and predicting disruption of transcription factor (TF) binding sites explored potential biological implications of the loci. We developed and evaluated the effect of polygenic risk scores (PRS) on incident CKD outcomes.

Results: SNPs in two novel loci, TPPP and FAT1-LINC02374 , were replicated (rs59402340 in TPPP , Pdiscovery =7.11×10 -7 , PCRIC =8.13×10 -4 , Pmeta =7.23×10 -8 ; rs28629773 in FAT1-LINC02374 , Pdiscovery =6.08×10 -7 , PCRIC =4.33×10 -2 , Pmeta =1.87×10 -7 ). The eQTL studies revealed that the replicated SNPs regulated the expression level of nearby genes associated with kidney function. Furthermore, these SNPs were near gene enhancer regions and predicted to disrupt the binding of TFs. PRS based on the independently significant top 22 SNPs were significantly associated with CKD outcomes.

Conclusions: This study demonstrates that SNP markers in the TPPP and FAT1-LINC02374 loci could be predictive markers for the decline of eGFR in patients with CKD.


Figures

None
Graphical abstract
Figure 1
Figure 1
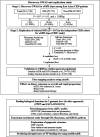
Overall study flow. ChIP-seq, chromatin immunoprecipitation sequencing.
Figure 2
Figure 2
Manhattan plots for discovery genome-wide association studies (GWASs) for eGFR slope among patients with CKD in total (N=1738). The x axis shows genomic position (chromosomes 1–22), and the y axis shows statistical significance as −log10(P value). The horizontal dotted gray lines indicate the thresholds of P value of 10−6. SNPs in genomic loci with P value<10−6 and replicated or candidate loci from the CRIC study were colored blue.
Figure 3
Figure 3
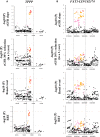
Associations between binary outcomes as CKD progression and the TPPP and FAT1-LINC02374 loci. (A) Regional associations of SNPs on TPPP on eGFR slope, 30% reduction of eGFR in a 3-year, renal event, and RRT (red dots, P<10−6; orange dots, P<10−4; pink dots, P<0.05 in eGFR slope GWAS among non-DM group). The x axis shows genomic position around TPPP loci, and the y axis shows statistical significance as −log10(P value) for each trait. (B) Regional associations of SNPs on FAT1-LINC02374 in eGFR slope, 30% reduction of eGFR in a 3-year, renal event, and RRT in overall period (red dots, P<10−6; orange dots, P<10−4; pink dots, P<0.05 in eGFR slope GWAS among total group). The x axis shows genomic position around FAT1-LINC02374 loci, and the y axis shows statistical significance as −log10(P value) for each trait.
Figure 4
Figure 4
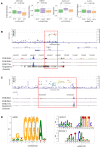
Finding for functional consequences for TPPP and FAT1-LINC02374 loci. (A) eQTL association plots for selected pairs of SNPs and genes from NEPTUNE cohort. The y axis show rank-normalized, adjusted expression for each gene by each pair of alleles on the x axis. Histone activities and regulatory elements around (B) TPPP locus and (C) FAT1-LINC02374 locus. Top, regional association plots for each locus. The plots show the−log10(P value) of each SNP on the y axis from GWAS on eGFR slopes in non-DM group for TPPP locus and total group for FAT1-LINC02374 locus with genomic positions on the x axis. Genes overlapping the locus are displayed below the plot. SNPs are colored by their LD value r2 estimated from 1000 genome phase 3 population with the top significant SNP marked as a purple diamond. (Middle) Histone activities for H3K4Me1, H3K4Me3, and H3K27AC of seven cell lines from ENCODE. (Bottom) Gene regulatory elements from GeneHancer. Darkness indicates confidence score for enhancers; red ones indicate promotors (deeper ones show higher confidence scores). (D) (Left) Position weight matrix for MZF1 motif. rs59402340 (TPPP) are predicted to disrupt binding affinity of MZF1 from HOCOMOCO database. (Right) Position weight matrix for SOX17 and POU1F1 motifs. rs4861741 (FAT1-LINC02374) are predicted to disrupt their binding from HOCOMOCO database. H3K4Me3, trimethylation of lysine 4 on histone H3 protein subunit; ENCODE, Encyclopedia of DNA Elements.
Figure 5
Figure 5
Effect of PRS derived from top 22 significant sodium nitroprussides (SNPs) from eGFR slope on CKD outcomes. (A) Multivariable adjusted HR of binary CKD outcomes by 1-SD increment of PRS and tail-based cutoffs. (B) Cumulative incidence curve for top 30% versus others with renal events and receiving RRT.

Comment in

References

    1. Xie Y, Bowe B, Mokdad AH, et al. Analysis of the Global Burden of Disease study highlights the global, regional, and national trends of chronic kidney disease epidemiology from 1990 to 2016. Kidney Int. 2018;94(3):567–581. doi:10.1016/j.kint.2018.04.011 - DOI - PubMed
    1. Xie Y, Bowe B, Xian H, Balasubramanian S, Al-Aly Z. Renal function trajectories in patients with prior improved eGFR slopes and risk of death. PLoS One. 2016;11(2):e0149283. doi:10.1371/journal.pone.0149283 - DOI - PMC - PubMed
    1. Orlandi PF, Xie D, Yang W, et al. ; the CRIC Study Investigators. Slope of kidney function and its association with longitudinal mortality and cardiovascular disease among individuals with CKD. J Am Soc Nephrol. 2020. 10;31(12):2912–2923. doi:10.1681/ASN.2020040476 - DOI - PMC - PubMed
    1. Oshima M, Jun M, Ohkuma T, et al. ; on behalf of the ADVANCE Collaborative Group. The relationship between eGFR slope and subsequent risk of vascular outcomes and all-cause mortality in type 2 diabetes: the ADVANCE-ON study. Diabetologia. 2019;62(11):1988–1997. doi:10.1007/s00125-019-4948-4 - DOI - PMC - PubMed
    1. Greene T, Ying J, Vonesh EF, et al. Performance of GFR slope as a surrogate end point for kidney disease progression in clinical trials: a statistical simulation. J Am Soc Nephrol. 2019;30(9):1756–1769. doi:10.1681/ASN.2019010009 - DOI - PMC - PubMed

Publication types

Substances