. 2023 Jan 31;14(1):387.
doi: 10.1038/s41467-023-35832-6.

Single-cell analysis reveals prognostic fibroblast subpopulations linked to molecular and immunological subtypes of lung cancer

Affiliations

Single-cell analysis reveals prognostic fibroblast subpopulations linked to molecular and immunological subtypes of lung cancer

Christopher J Hanley et al. Nat Commun. .

Abstract

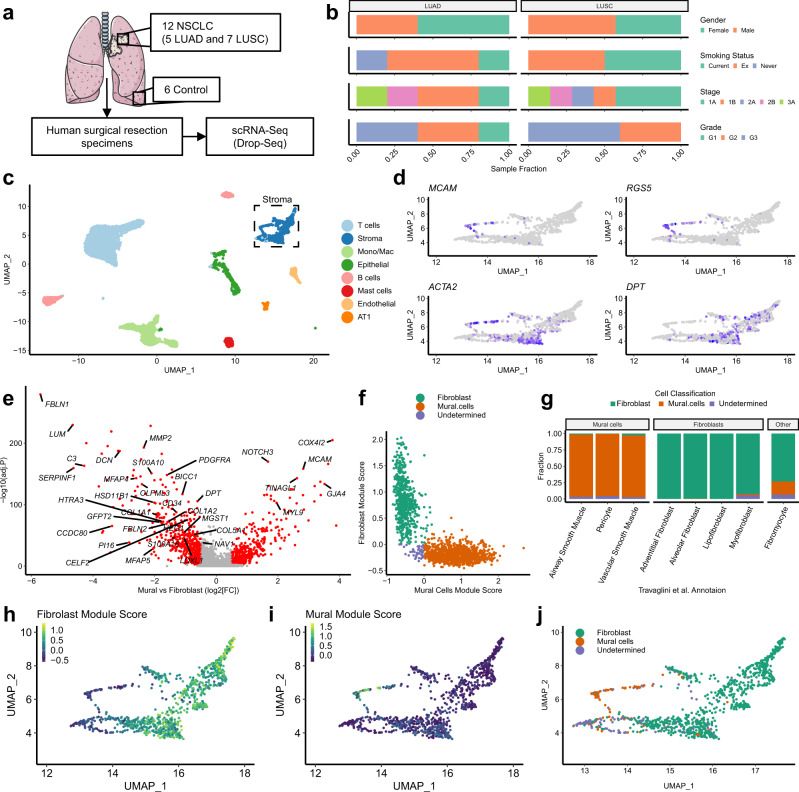
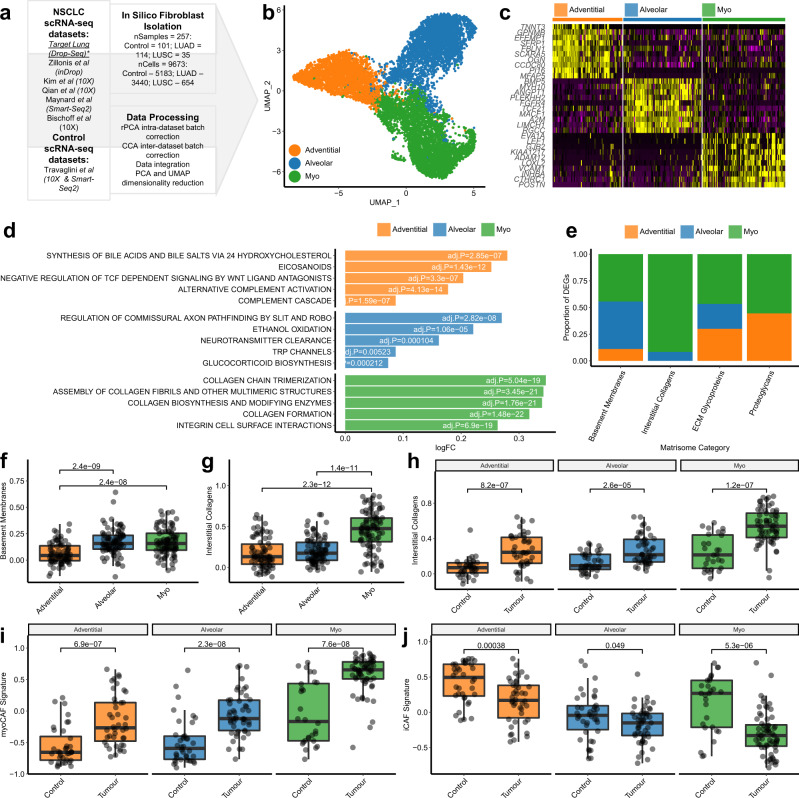
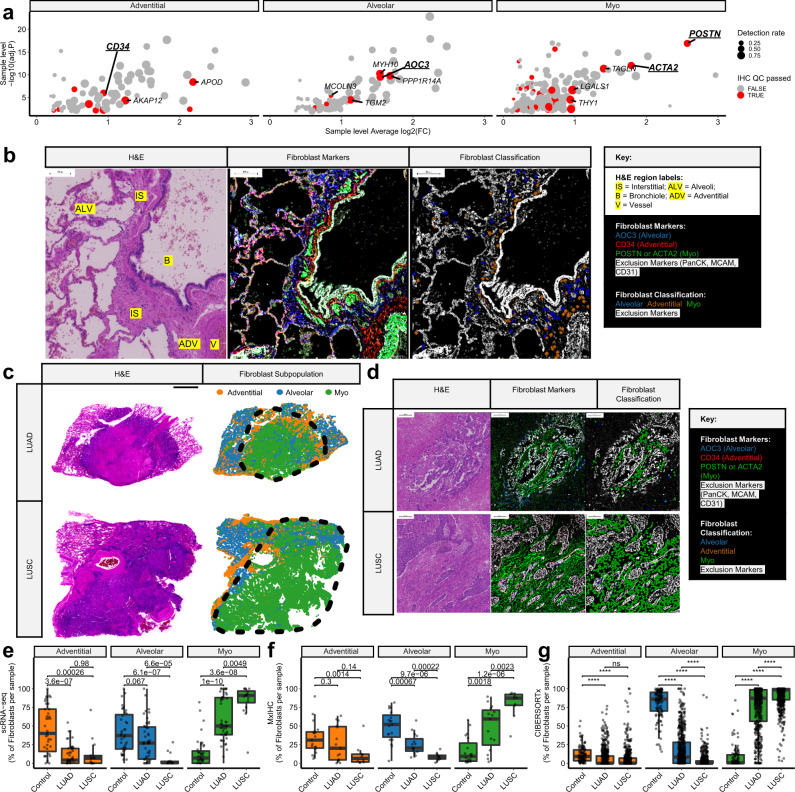
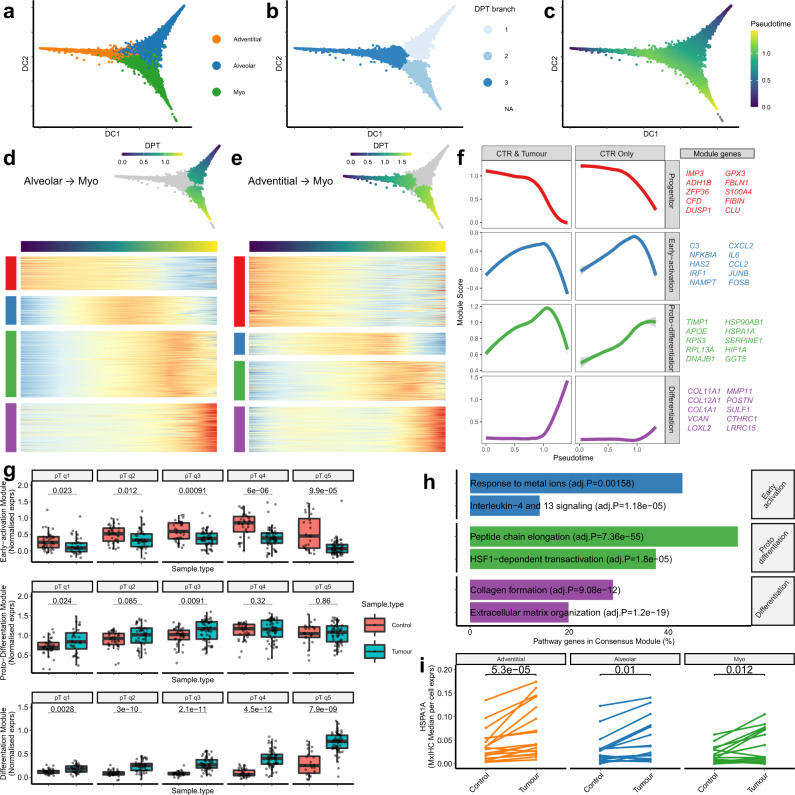
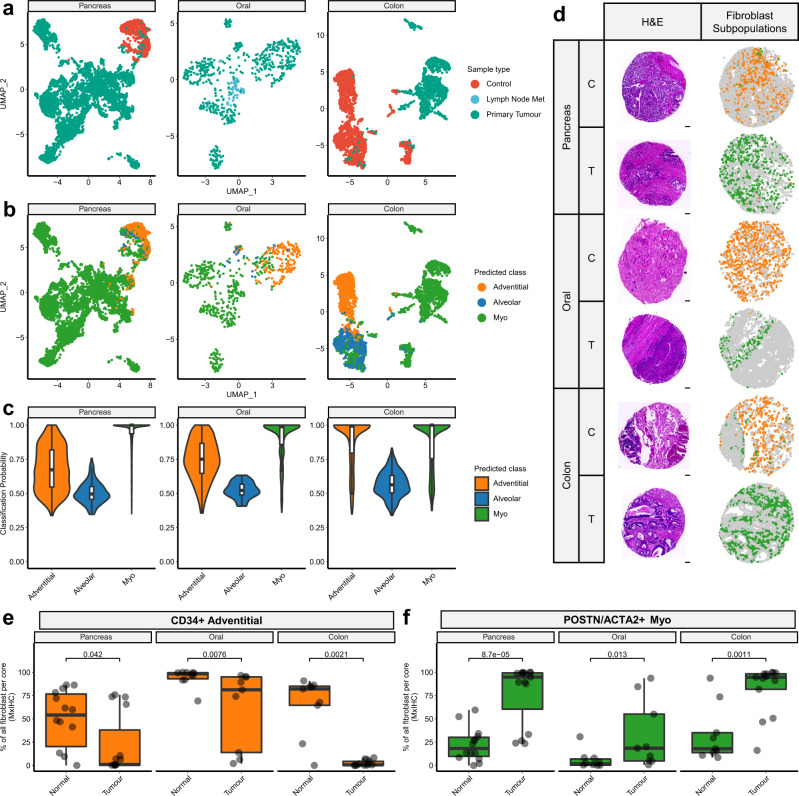
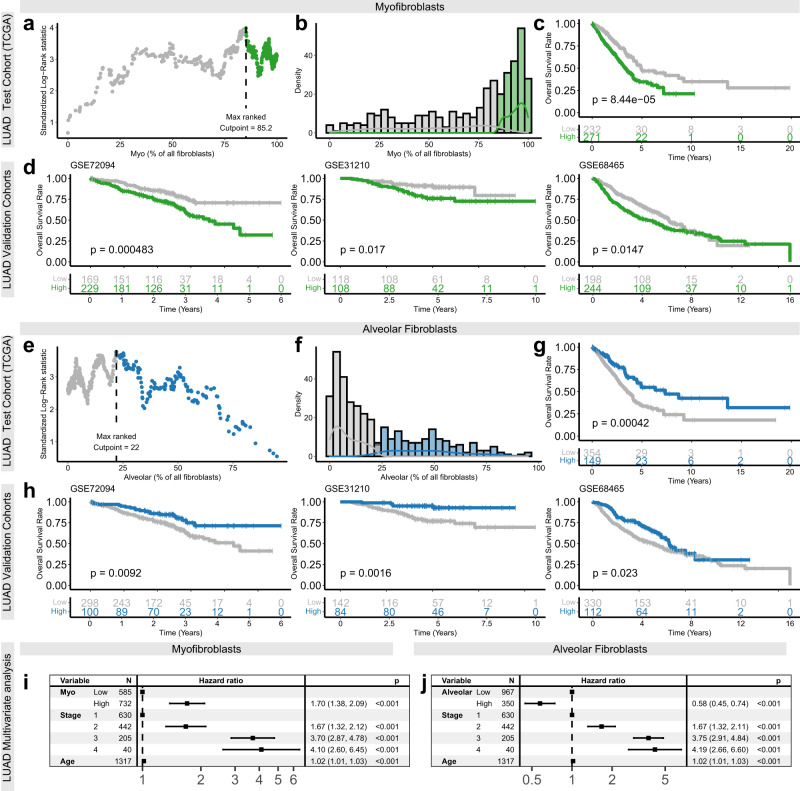
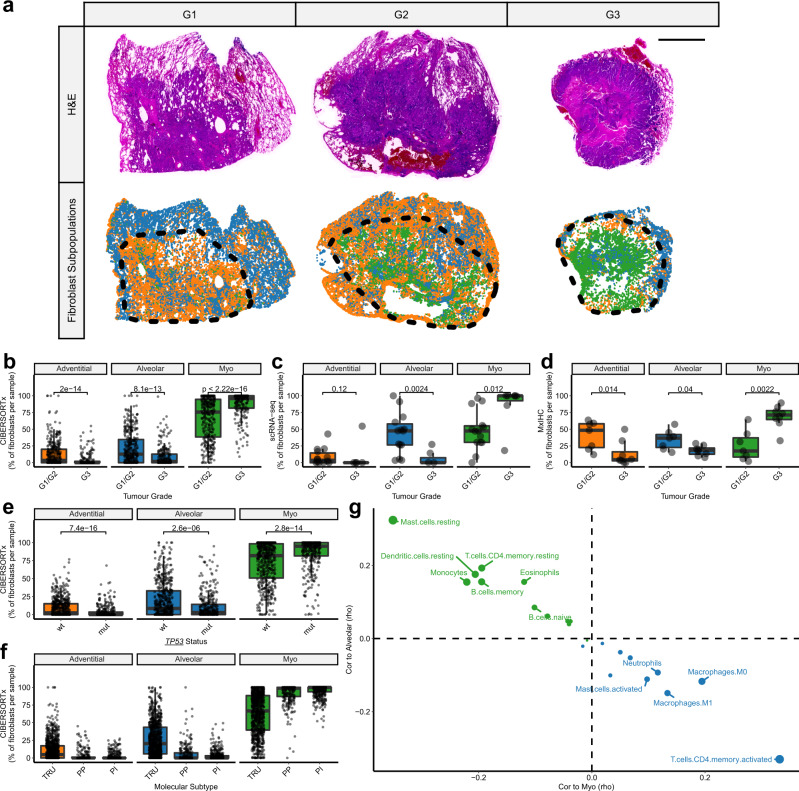
Fibroblasts are poorly characterised cells that variably impact tumour progression. Here, we use single cell RNA-sequencing, multiplexed immunohistochemistry and digital cytometry (CIBERSORTx) to identify and characterise three major fibroblast subpopulations in human non-small cell lung cancer: adventitial, alveolar and myofibroblasts. Alveolar and adventitial fibroblasts (enriched in control tissue samples) localise to discrete spatial niches in histologically normal lung tissue and indicate improved overall survival rates when present in lung adenocarcinomas (LUAD). Trajectory inference identifies three phases of control tissue fibroblast activation, leading to myofibroblast enrichment in tumour samples: initial upregulation of inflammatory cytokines, followed by stress-response signalling and ultimately increased expression of fibrillar collagens. Myofibroblasts correlate with poor overall survival rates in LUAD, associated with loss of epithelial differentiation, TP53 mutations, proximal molecular subtypes and myeloid cell recruitment. In squamous carcinomas myofibroblasts were not prognostic despite being transcriptomically equivalent. These findings have important implications for developing fibroblast-targeting strategies for cancer therapy.


Conflict of interest statement

The authors declare no competing interests.

Figures

Fig. 1
Fig. 1. Fibroblast identification through single-cell RNA-sequencing analysis of whole-tissue homogenates derived from human NSCLC tumour samples.
a Schematic illustrating sample processing and analysis methodology used to generate the target lung drop-seq (TLDS) dataset, comprised of human control (n = 6) and NSCLC (n = 12) samples. The Figure was partly generated using Servier Medical Art, provided by Servier, licensed under a Creative Commons Attribution 3.0 unported license. b Barplots showing key demographics of the TLDS dataset, further details provided in Supplementary Data 1. c. 2D visualisation (UMAP dimensionality reduction) of pooled data from all samples’ whole-tissue scRNA-seq data, highlighting different cell types. Further analysis is shown in Supplementary Fig. 1a–d. AT1 alveolar type 1 cells, Mono/Mac monocytes and macrophages. d Feature plots showing the expression of canonical markers for mural cells (MCAM and RGS5), mural cells and myofibroblasts (ACTA2) and fibroblasts (DPT), in the stromal cell cluster (subset from panel c). e Volcano plot showing genes differentially expressed (Bonferroni adj.P < 0.01 and absolute logFC >0.5, shown in red) between mural cells and fibroblasts from a recently published human lung cell atlas (HLCA). Genes included in the consensus gene signatures identified for mural cells or fibroblasts are labelled. f Scatter plot showing the classification of fibroblasts and mural cells based on consensus gene signatures (defined in e), applied to stromal cells from the HLCA dataset. g Barplots showing the results of the gene signature classification results compared to the original HLCA publication’s cell type annotation. h Feature plot showing the expression of consensus fibroblast marker gene signature in the TLDS dataset. i Feature plot showing the expression of consensus mural marker gene signature in the TLDS dataset. j UMAP plot showing the result of fibroblast and mural cell demarcation in the TLDS dataset using the consensus gene signature approach.
Fig. 2
Fig. 2. Investigating fibroblast heterogeneity in NSCLC through the integration of seven scRNA-seq datasets.
a Schematic overview of the data processing pipeline implemented to generate an integrated dataset for analysing fibroblast’s transcriptomic heterogeneity in NSCLC. b 2D visualisation (UMAP dimensionality reduction) of fibroblast transcriptomes, highlighting the three major subpopulations identified through unsupervised clustering. Further analysis is shown in Supplementary Fig. 1a–e. c Heatmap showing the sample-level expression (averaged over single cells) for the ten most significant markers of each subpopulation. Complete differential expression results are provided in Supplementary Data 2. d Bar plot showing the log2 fold change for the most significantly upregulated REACTOME pathways in each subpopulation, calculated through GSVA and Empirical Bayes Statistics for differential expression (exact Bonferroni adjusted p values are also shown). Complete results from this analysis are provided in Supplementary Data 3. e Bar plot showing the proportion of different matrisome components differentially expressed by each subpopulation. f Boxplot showing sample-level expression (averaged over single cells) of genes encoding basement membrane components for each subpopulation. Nominal p values for the Wilcoxon signed-ranks test are also shown(n = 78 [adventitial], 87 [alveolar] and 92 [myo]). g Boxplot showing sample-level expression (averaged over single cells) of genes encoding interstitial collagens for each subpopulation. Nominal p values for the Wilcoxon signed-ranks test are also shown (n = 78 [adventitial], 87 [alveolar] and 92 [myo] independent samples). h Boxplot showing sample-level expression (averaged over single cells) of genes encoding interstitial collagens for each subpopulation split by tissue type. Nominal p values for the Wilcoxon signed-ranks test are also shown (n = 36/42 [adventitial, control/tumour], 38/49 [alveolar], 28/64 [myo]). i Boxplot showing sample-level expression (averaged over single cells) of genes encoding myoCAF markers for each subpopulation split by tissue type. Nominal p values for the Wilcoxon signed-ranks test are also shown (n as per panel h). j Boxplot showing sample-level expression (averaged over single cells) of genes encoding iCAF markers for each subpopulation split by tissue type. Nominal p values for the Wilcoxon signed-ranks test are also (n as per panel h). All statistical tests carried out were two-sided and boxplots are displayed using the Tukey method (centre line, median; box limits, upper and lower quartiles; whiskers, last point within a 1.5x interquartile range). Source data for panels fj are provided in the Source Data file.
Fig. 3
Fig. 3. Multiplexed IHC (mxIHC) and digital cytometry show that fibroblast subpopulations occupy spatially discrete niches and varied NSCLC tissue subtype enrichment.
a Scatter plot showing differential expression statistics (Bonferroni adj.P and log2 fold change) for putative subpopulation markers, highlighting those compatible for use in mxIHC analysis. Full details are provided in Supplementary Data 2. b Representative micrographs from H&E staining and multiplexed IHC (mxIHC) performed on serial sections (n = 19 samples analysed). The micrographs (from left to right) represent H&E staining (notable regions are highlighted as described in the key), a pseudocoloured image depicting different markers identified by mxIHC (coloured as indicated in the key) and the results from histo-cytometry-based cell classification (with simulated cells coloured as indicated in the key). The region presented represents histologically normal lung tissue, including adventitial, alveolar, peri-bronchial and interstitial regions. Scale bars represent 100 µm. For further images showing region of interest selection and individual marker staining profiles please see Supplementary Data 6. c Representative examples from whole slide mxIHC analysis of NSCLC tissue sections (n = 15 [LUAD], 10 [LUSC] samples analysed). Panels showing serial section H&E staining and a point pattern plot showing the spatial distribution of different fibroblast populations (measured by histo-cytometry analysis of mxIHC). The scale bar represents 4 mm and the black dotted line demarcates the tumour region in each tissue section. For details of the full cohort analysed, please see Supplementary Data 7, 8. d As per b, presenting regions of the respective LUAD and LUSC cases shown in panel c. For further images showing region of interest selection and individual marker staining profiles please see Supplementary Data 9, 10 for the LUAD and LUSC case respectively. e Boxplot showing the relative abundance of each fibroblast subpopulation in different NSCLC subtypes, as measured in the integrated scRNA-seq dataset. Nominal p values for the Wilcoxon signed-ranks test are also shown (n = 39 [Control], 46 [LUAD], 16 [LUSC]). f As per d, measured by mxIHC, analysing pathologist annotated tumour regions for LUAD or LUSC and non-neoplastic regions within the tissue blocks as controls. Nominal p values for the Wilcoxon signed-ranks test are also shown (n = 19 [Control], 15 [LUAD], 10 [LUSC]). g As per c, as measured by CIBERSORTx-mediated digital cytometry. nsp > 0.05, ****p < 2.22e-16, Wilcoxon signed-ranks test (n = 110 [Control], 515 [LUAD], 501 [LUSC]),. All statistical tests carried out were two-sided and boxplots are displayed using the Tukey method (centre line, median; box limits, upper and lower quartiles; whiskers, last point within a 1.5x interquartile range). Source data for panels eg are provided in the Source Data file.
Fig. 4
Fig. 4. Trajectory inference identifies consensus gene modules associated with the transdifferentiation from alveolar or adventitial fibroblasts to myofibroblasts.
a 2D visualisation (diffusion map dimensionality reduction) of the integrated fibroblast scRNA-seq dataset, highlighting the three subpopulations. b As per a, highlighting cells assigned to each diffusion pseudotime (DPT) branch. c As per a, showing the relative position of each cell in DPT. d Heatmap showing genes differentially expressed as alveolar fibroblasts progress to myofibroblasts in DPT. Hierarchical clustering was used to group these genes into modules defined by the DPT expression profile. Complete differential expression results are provided in Supplementary Data 12. e As per d, genes differentially expressed as adventitial fibroblasts progress to myofibroblasts. Complete differential expression results are provided in Supplementary Data 12. f Loss curve plots showing the expression profiles for each consensus DPT module in datasets consisting of control and tumour samples or only control tissue samples. Consensus modules consist of genes assigned to the same cluster in both alveolar to myo and adventitial to myo trajectories, ten representative genes for each module are listed (full gene lists can be found in Supplementary Data 12 and individual dataset plots are shown in Supplementary Fig. 4b). g Boxplots showing the expression of consensus DPT modules in cells grouped by tissue type and pseudotime quintiles. Nominal p values for the Wilcoxon signed-ranks test are also shown (n Control/Tumour = 37/32 [q1], 36/45 [q2], 36/55 [q3], 34/58 [q4], 24/58 [q5]). h Barplots showing REACTOME pathway enrichment results for each consensus DPT module (Benjamini–Hochberg adjusted P values are also shown). Full results provided in Supplementary Data 13. i Line plots showing the average HSPA1A expression levels between paired tumour and adjacent normal tissues for each fibroblast subpopulation, measured by mxIHC. Wilcoxon signed-ranks test (n = 18). All statistical tests carried out were two-sided and boxplots are displayed using the Tukey method (centre line, median; box limits, upper and lower quartiles; whiskers, last point within a 1.5x interquartile range). Source data for panels g, i are provided in the Source Data file.
Fig. 5
Fig. 5. Machine learning-based classification of scRNA-seq data and mxIHC shows adventitial and myofibroblasts are conserved across pancreatic, colorectal and oral cancers, whereas alveolar fibroblasts are lung-specific.
a 2D visualisation (UMAP dimensionality reduction) of fibroblasts isolated from different cancer types and analysed by scRNA-seq, highlighting the sample type. b As per a, highlighting the fibroblast subpopulation associated with each cell as predicted by a machine learning classifier. c Violin plots showing the probability of the machine learning classifier model’s predictions grouped by subpopulation (n = 6875 [Pancreas], 611 [Oral] and 3297 [Colon] fibroblast transcriptomes). d Representative images from mxIHC analysis of tissue microarrays (TMAs), constructed from pancreatic, oral and colon cancer tissue blocks (n cores analysed Control/Tumour = 14/15 [Pancreas], 10/9 [Oral], 9/13 [Colon]). Showing H&E staining and the spatial distribution of fibroblast subpopulations (measured by histo-cytometry analysis of mxIHC data). The scale bar represents 100 µm. Further images of individual staining profiles are provided in Supplementary Fig. 5a. e Boxplot showing the relative abundance of adventitial fibroblasts in tumour or control tissues, measured by mxIHC analysis of TMA cores. Nominal p values for the Wilcoxon signed-ranks test are also shown (n Control/Tumour = 14/15 [Pancreas], 10/9 [Oral], 9/13 [Colon]). f As per e, for myofibroblast abundance. All statistical tests carried out were two-sided and boxplots are displayed using the Tukey method (centre line, median; box limits, upper and lower quartiles; whiskers, last point within a 1.5x interquartile range). Source data for panels e, f are provided in the Source Data file.
Fig. 6
Fig. 6. CIBERSORTx-mediated digital cytometry shows that myofibroblasts and alveolar fibroblasts correlate with overall survival rates in LUAD.
a Scatter plot showing the variation in standardised log-rank survival statistics (correlation with overall survival rates) using different cut-points for dichotomising TCGA-LUAD samples by myofibroblast abundance. b Density plot showing the distribution of myofibroblast abundance measurements across TCGA-LUAD samples. c Kaplan–Meier plot showing TCGA-LUAD cohort patient survival rates, stratified by myofibroblast abundance using the optimal cut-point for dichotomisation (identified in a). Statistical significance was assessed using a log-rank test (n = 503). d Kaplan–Meier plots showing the cutpoint defined on TCGA-LUAD cohort (identified in panel a) applied to three additional LUAD validation cohorts. Statistical significance was assessed using Log-rank tests (n = 398 [GSE72094], 226 [GSE31210], 422 [GSE68465]). e Scatter plot showing the variation in standardised log-rank survival statistic (correlation with overall survival rates) using different cut-points for dichotomising TCGA-LUAD samples by alveolar fibroblast abundance. f Density plot showing the distribution of alveolar fibroblast abundance measurements across TCGA-LUAD samples. g Kaplan–Meier plot showing TCGA-LUAD cohort patient survival rates, stratified by alveolar fibroblast abundance using the optimal cut-point for dichotomisation (identified in e). Statistical significance was assessed using a Log-rank test (n = 503). h Kaplan–Meier plots showing the cutpoint defined on TCGA-LUAD cohort (identified in panel a) applied to three additional LUAD validation cohorts. Statistical significance was assessed using Log-rank tests (n = 398 [GSE72094], 226 [GSE31210], 422 [GSE68465]). i Forest plot showing covariate independent hazard ratios (±95% confidence intervals) and adjusted p values from multivariate Cox regression analysis of four-year overall survival rates across all LUAD patient cohorts analysed above, using myofibroblast abundance, disease stage and patient age as independent variables (exact p values provided in Source Data file). Results for individual datasets are shown in Supplementary Fig. 6c. j Forest plot showing covariate independent hazard ratios (±95% confidence intervals) and adjusted p values from multivariate Cox regression analysis of 4-year overall survival rates across all LUAD patient cohorts analysed above, using alveolar abundance, disease stage and patient age as independent variables (exact p values provided in Source Data file). Results for individual datasets are shown in Supplementary Fig. 6d.
Fig. 7
Fig. 7. MxIHC and digital cytometry shows fibroblast subpopulations are associated with morphological, molecular and immunological features of LUAD tumours.
a Representative images from whole slide mxIHC analysis of LUAD tumours with varying grades (G1 = well differentiated [n = 1], G2 = moderately differentiated [n = 6] and G3 = poorly differentiated [n = 8]), showing H&E staining and point pattern plots representing the spatial distribution of different fibroblast subpopulations (measured by histo-cytometry analysis of mxIHC data). The scale bar represents 4 mm and the black dotted line demarcates the tumour region in each tissue section. b Boxplots showing the relative abundance of fibroblast subpopulations in well/moderately differentiated LUAD tumours compared to poorly differentiated, measured by CIBERSORTx digital cytometry. Wilcoxon signed-ranks test (n = 375 [G1/G2], 248 [G3]; from two independent datasets;, data from each individual dataset is shown in Supplementary Fig. 7a). c As per b, measured by scRNA-seq. Wilcoxon signed-ranks test (n = 14 [G1/G2], 7 [G3]). d As per b, measured by mxIHC. Wilcoxon signed-ranks test (n = 7 [G1/G2], 8 [G3]). e Boxplots showing the relative abundance of fibroblast subpopulations in LUAD tumours grouped by TP53 mutation status, measured by CIBERSORTx digital cytometry. Wilcoxon signed-ranks test (n = 578 [wt], 374 [mut]; from two independent datasets,, data from each individual dataset is shown in Supplementary Fig. 7d). f Boxplots showing the relative abundance of fibroblast subpopulations in LUAD tumours grouped by molecular subtype (TRU terminal respiratory unit, PP proximal-proliferative and PI proximal-inflammatory). Each datapoint represents an individual patient, measured by CIBERSORTx digital cytometry (n = 1626, from four independent datasets;,– data from each individual dataset is shown in Supplementary Fig. 7c). g Scatter plot showing Spearman’s correlation between alveolar or myofibroblast abundance and immune cell subpopulation (LM22) abundance, measured by CIBERSORTx digital cytometry (n = 1626; from four independent datasets;,– data from each individual dataset is shown in Supplementary Fig. 7e). All statistical tests carried out were two-sided and boxplots are displayed using the Tukey method (centre line, median; box limits, upper and lower quartiles; whiskers, last point within a 1.5x interquartile range). Source data for panels bf are provided in the Source Data file.

Similar articles

Cited by

References

    1. Hanley, C. J. et al. Targeting the myofibroblastic cancer-associated fibroblast phenotype through inhibition of NOX4. J. Natl Cancer Inst. 110, 109–120 (2018). - PMC - PubMed
    1. Hofheinz RD, et al. Stromal antigen targeting by a humanised monoclonal antibody: an early phase II trial of sibrotuzumab in patients with metastatic colorectal cancer. Onkologie. 2003;26:44–48. - PubMed
    1. Ganguly, D. et al. Cancer-associated fibroblasts: versatile players in the tumor microenvironment. Cancers12, 2652 (2020). - PMC - PubMed
    1. Ozdemir BC, et al. Depletion of carcinoma-associated fibroblasts and fibrosis induces immunosuppression and accelerates pancreas cancer with reduced survival. Cancer Cell. 2015;28:831–833. doi: 10.1016/j.ccell.2015.11.002. - DOI - PubMed
    1. Bhattacharjee, S. et al. Tumor restriction by type I collagen opposes tumor-promoting effects of cancer-associated fibroblasts. J. Clin. Invest.131, e146987 (2021). - PMC - PubMed