. 2023 Feb;55(2):364-376.
doi: 10.1038/s12276-023-00936-y. Epub 2023 Feb 1.

BET inhibitors synergize with sunitinib in melanoma through GDF15 suppression

Affiliations

BET inhibitors synergize with sunitinib in melanoma through GDF15 suppression

Furong Zeng et al. Exp Mol Med. 2023 Feb.

Abstract

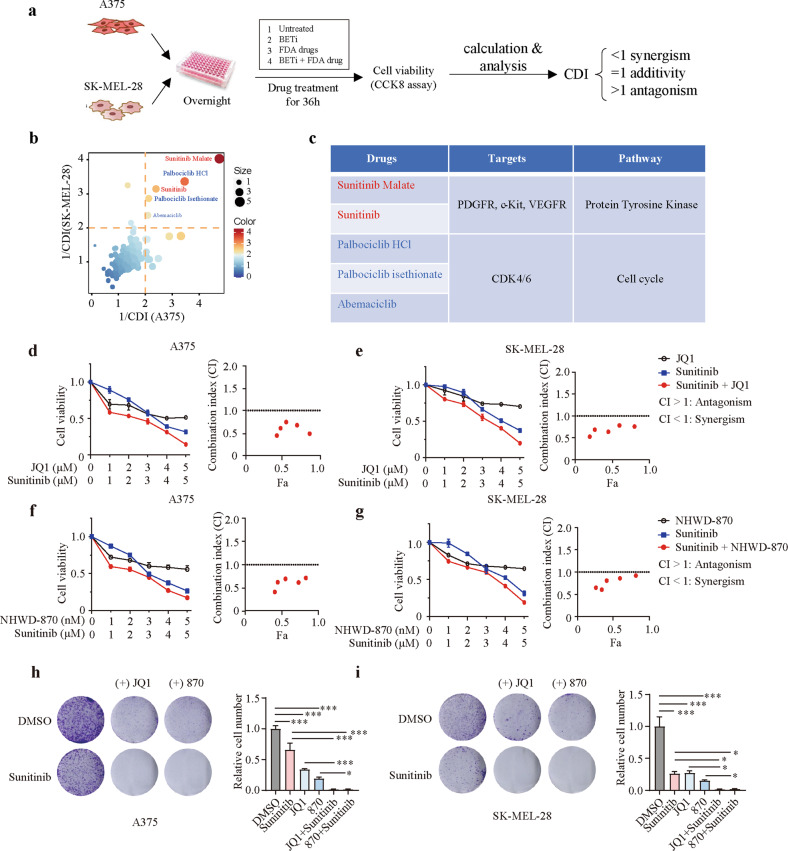
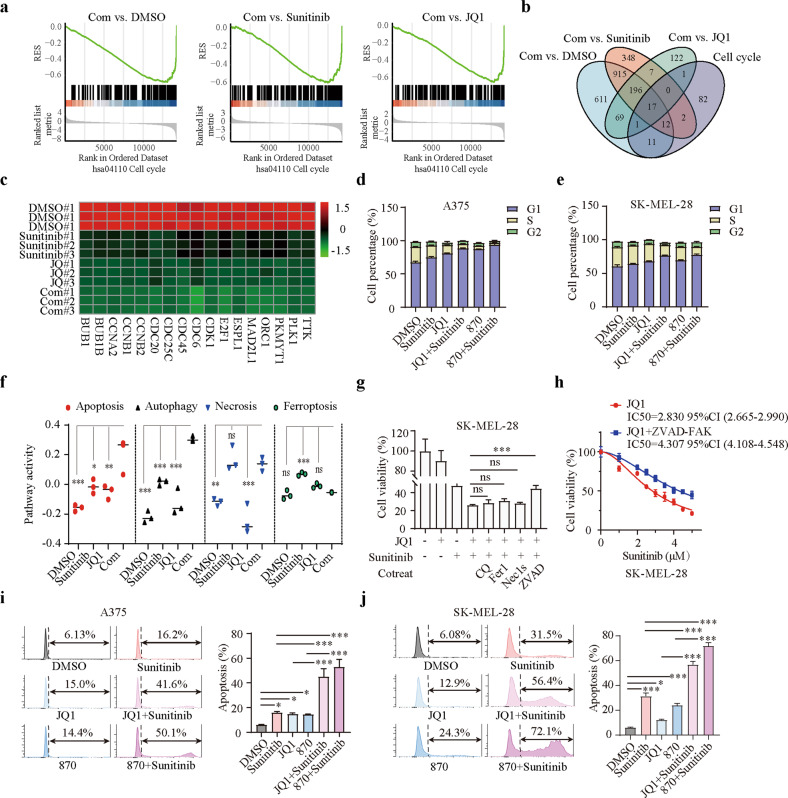
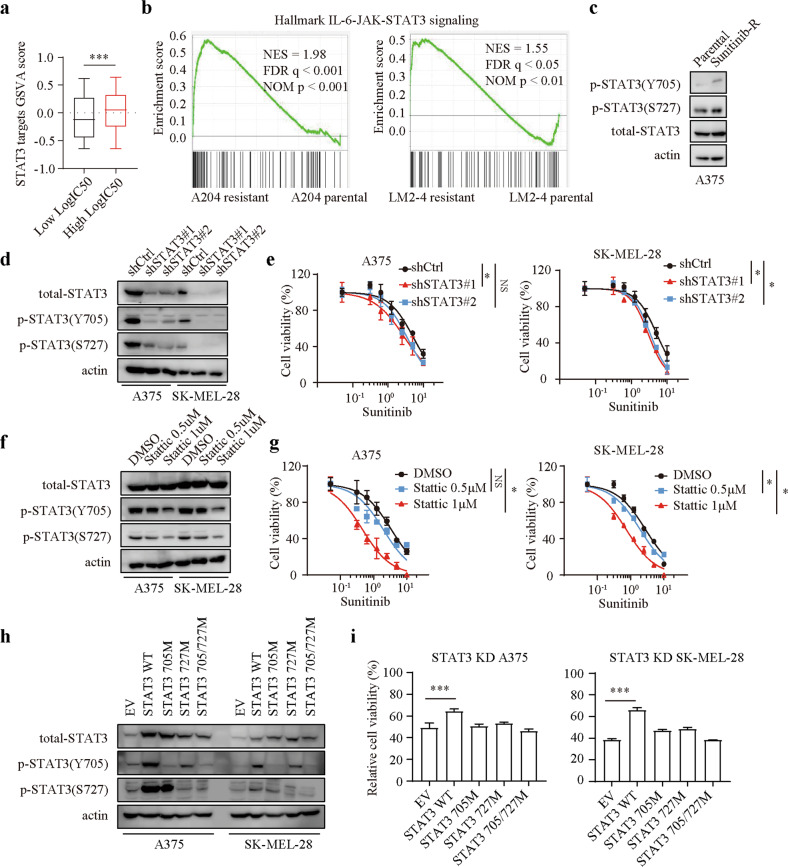
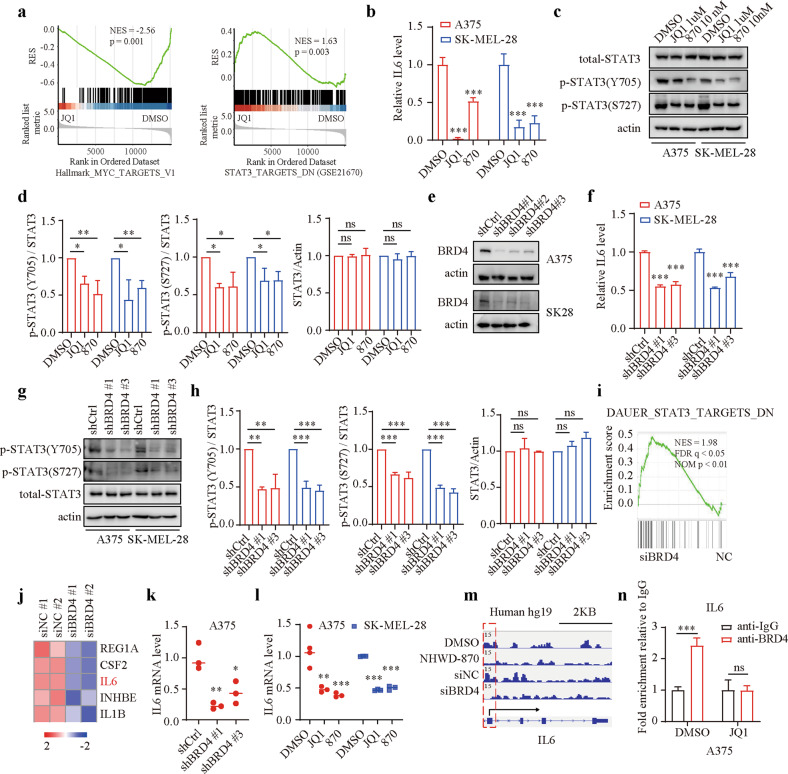
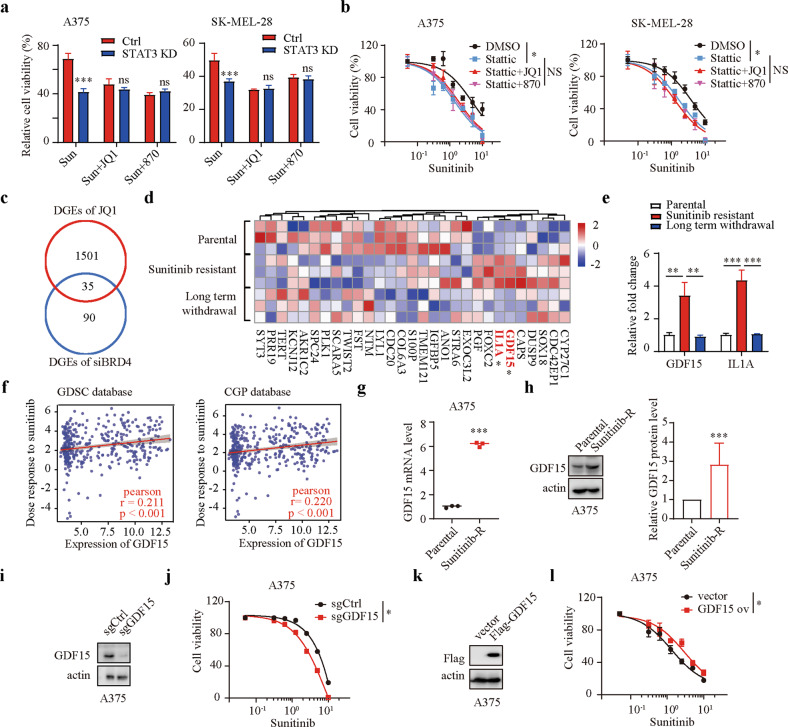
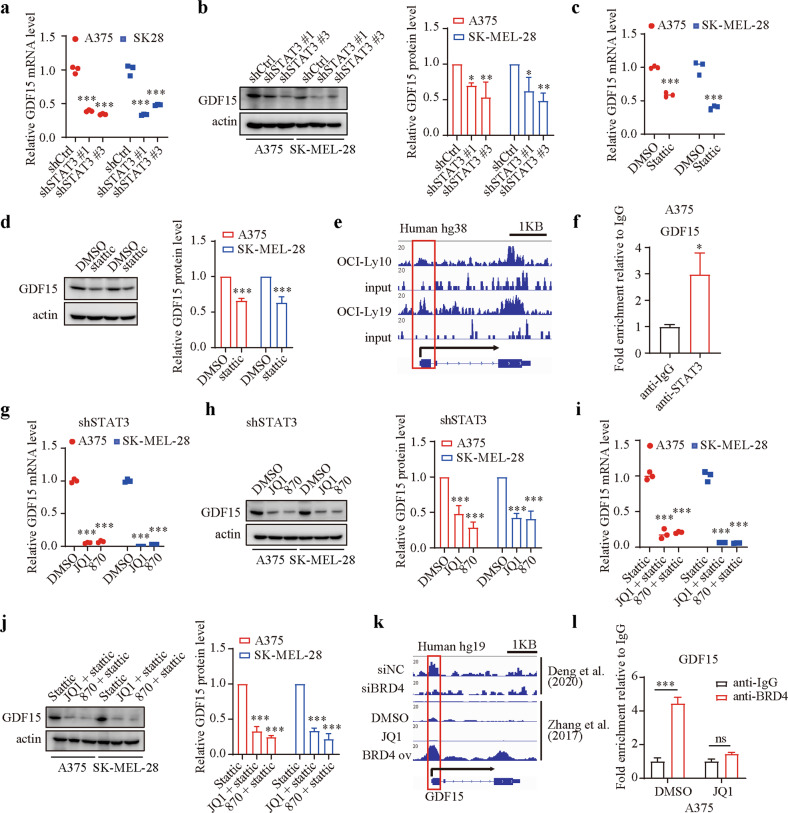
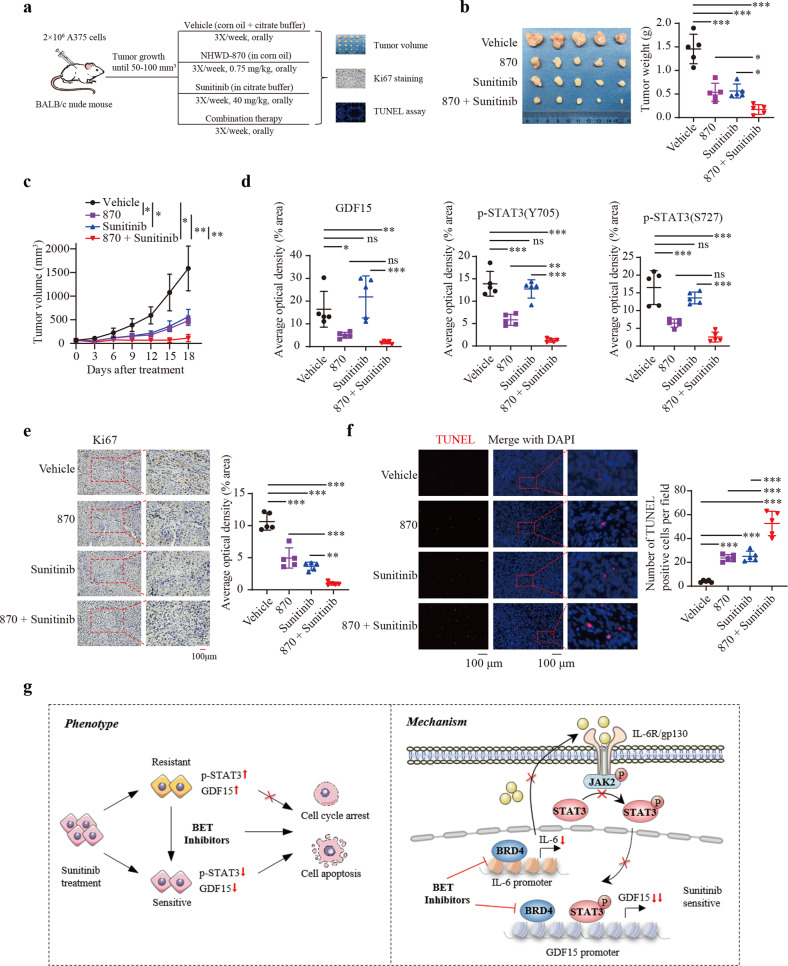
Targeting bromodomain and extra-terminal domain (BET) proteins has shown a promising therapeutic effect on melanoma. The development of strategies to better kill melanoma cells with BET inhibitor treatment may provide new clinical applications. Here, we used a drug synergy screening approach to combine JQ1 with 240 antitumor drugs from the Food and Drug Administration (FDA)-approved drug library and found that sunitinib synergizes with BET inhibitors in melanoma cells. We further demonstrated that BET inhibitors synergize with sunitinib in melanoma by inducing apoptosis and cell cycle arrest. Mechanistically, BET inhibitors sensitize melanoma cells to sunitinib by inhibiting GDF15 expression. Strikingly, GDF15 is transcriptionally regulated directly by BRD4 or indirectly by the BRD4/IL6/STAT3 axis. Xenograft assays revealed that the combination of BET inhibitors with sunitinib causes melanoma suppression in vivo. Altogether, these findings suggest that BET inhibitor-mediated GDF15 inhibition plays a critical role in enhancing sunitinib sensitivity in melanoma, indicating that BET inhibitors synergize with sunitinib in melanoma.


Conflict of interest statement

The authors declare no competing interests.

Figures

Fig. 1
Fig. 1. Identification of synergy between sunitinib and BET inhibitors in melanoma cells.
a Schematic of the screening process for identifying clinically applicable drugs from the FDA-approved drug library that synergize with BET inhibitors in melanoma. b Summary scatter plot of CDI values in A375 and SK-MEL-28 cells. c Targets and targeted pathways of the drugs identified through the screen. dg Dose-response curves of melanoma cells treated with sunitinib or JQ1/NHWD-870 either alone or in combination for 36 h (JQ1 and sunitinib at a fixed ratio of 1:1, NHWD-870 and sunitinib at a fixed ratio of 1:1000). Synergy was assessed by the Chou-Talalay combination index (CI) for sunitinib and BET inhibitors across the indicated cell lines. The x-axis on the CI plots shows the percentage of cells affected. h, i Colony formation assay of A375 and SK-MEL-28 cells after the indicated treatment. P values were calculated using one-way ANOVA in (h) and (i). *P < 0.05; ***P < 0.001.
Fig. 2
Fig. 2. Apoptosis and cell cycle arrest mediate the synergy induced by the combination treatment.
a Gene set enrichment analysis (GSEA) showing that cell cycle progression was significantly inhibited in the combination group compared with the DMSO, sunitinib, and JQ1 groups. b Venn diagram of the overlapping genes in the indicated groups. c Heatmap of the 17 genes identified by the Venn diagram that were associated with the cell cycle and inhibited by the combination treatment. d, e Cell cycle distribution of A375 (d) and SK-MEL-28 (e) cells after treatment with sunitinib (1 μM) or JQ1 (1 μM)/NHWD-870 (10 nM) either alone or in combination for 36 h. f Gene set variation analysis (GSVA) of apoptosis-, autophagy-, necrosis-, and ferroptosis-related pathways in the indicated groups. g SK-MEL-28 cells were treated with JQ1 (1 μM), sunitinib (1 μM), or a combination of both drugs with or without cell death inhibitors (CQ, 10 μM; Fer-1, 2 μM; necrostatin-1s, 10 μM; ZVAD-FMK, 5 μM) for 24 h, and cell viability was assessed. h Dose response of sunitinib-induced death of SK-MEL-28 cells treated with JQ1 in the absence or presence of ZVAD-FAK. i, j Apoptosis of A375 (i) and SK-MEL-28 (j) cells after treatment with sunitinib (1 μM) or JQ1 (1 μM)/NHWD-870 (10 nM) either alone or in combination for 36 h. P values were calculated using one-way ANOVA in (f, g, i and j). *P < 0.05; **P < 0.01; ***P < 0.001; ns nonsignificant.
Fig. 3
Fig. 3. STAT3 regulates sunitinib sensitivity in melanoma cells through its phosphorylation.
a GSVA scores of STAT3 targets in cells with a high IC50 of sunitinib or a low IC50 of sunitinib from the Cancer Therapeutics Response Portal dataset. b GSEA of the hallmark IL6/JAK/STAT3 signaling pathway in the indicated parental and sunitinib-resistant cells. c Western blot analysis of the indicated proteins in parental and sunitinib-resistant A375 cells. d Western blot analysis of the indicated proteins in shCtrl and shSTAT3 melanoma cells. e Dose response of sunitinib-induced death in shCtrl and shSTAT3 melanoma cells over a 24 h period. f Western blot analysis of the indicated proteins in A375 and SK-MEL-28 cells after treatment with DMSO, 0.5 μM stattic, or 1 μM stattic for 24 h. g Dose response of sunitinib-induced death in A375 and SK-MEL-28 cells in the presence of DMSO, 0.5 μM stattic, or 1 μM stattic for 24 h. h Western blot analysis of the indicated proteins in shSTAT3 A375 and SK-MEL-28 cells after the expression of the empty vector, wild-type STAT3 plasmid, or STAT3 phosphorylation mutant plasmids. i Viability of the indicated cells after treatment with sunitinib for 24 h. Two-tailed unpaired Student’s t test was performed in (a). Nonlinear regression was applied in (e and g). P values were calculated using one-way ANOVA in (i). ***P < 0.001.
Fig. 4
Fig. 4. BET inhibitors repress STAT3 signaling via the BRD4/IL6 axis.
a GSEA of MYC targets and targets with STAT3-induced downregulation in the JQ1 and DMSO groups. b IL6 concentrations in supernatants were measured by ELISA after treatment with DMSO, 1 μM JQ1, or 10 nM NHWD-870 for 24 h. c, d Western blotting and qualitative analysis of the indicated proteins in A375 and SK-MEL-28 cells after treatment with DMSO, 1 μM JQ1, or 10 nM NHWD-870 for 24 h. e Knockdown efficiency of BRD4 quantified by western blotting. f IL6 concentrations in supernatants were measured by ELISA after BRD4 silencing. g, h Western blotting and qualitative analysis of the indicated proteins in A375 and SK-MEL-28 cells after BRD4 silencing. i GSEA of targets with STAT3-induced downregulation identified by RNA-seq of siNC vs. siBRD4 A375 cells. j Heatmap of the top five differentially expressed genes in the gene set. k Assessment of the IL6 mRNA level by RT-PCR in A375 cells after BRD4 silencing. l Assessment of IL6 mRNA levels by RT-PCR in A375 and SK-MEL-28 cells after treatment with DMSO, 1 μM JQ1, or 10 nM NHWD-870 for 24 h. m BRD4 binding peaks in the IL6 promoter in DMSO-treated, NHWD-870-treated, siNC-treated, and siBRD4-treated A375 cells. n ChIP-qPCR analysis of the IL6 promoter in A375 cells with an anti-BRD4 antibody or IgG after treatment with DMSO or 1 μM JQ1. P values were calculated using one-way ANOVA in (b, d, f, h, k and l). Two-way ANOVA was performed in (n). *P < 0.05; **P < 0.01; ***P < 0.001; ns nonsignificant.
Fig. 5
Fig. 5. BET inhibitors regulate sunitinib sensitivity by inhibiting STAT3 activity and GDF15 expression.
a The viability of shCtrl and shSTAT3 melanoma cells was evaluated after treatment with sunitinib (1 μM) alone or in combination with JQ1 (1 μM)/NHWD-870 (10 nM). b Dose response of sunitinib-induced death in A375 and SK-MEL-28 cells in the presence of DMSO, 1 μM stattic, or 1 μM stattic + JQ1 (1 μM)/NHWD-870 (10 nM). c Venn diagram of the overlapping genes in the indicated groups. d Heatmap of the overlapping genes in parental cells, sunitinib-resistant cells, and cells with long-term withdrawal of sunitinib from the GSE122821 dataset. If the mRNA level of a gene was markedly increased in sunitinib-resistant cells and comparable to that in parental cells after long-term withdrawal of sunitinib, the gene is marked with an asterisk and shown in red. e Fold changes in GDF15 and IL1A expression in parental cells, sunitinib-resistant cells, and cells with long-term withdrawal of sunitinib from the GSE122821 dataset. f Association between the expression of GDF15 and the logIC50 of sunitinib in Genomics of Drug Sensitivity in Cancer and Cancer Genome Project datasets. g GDF15 mRNA levels in parental and sunitinib-resistant A375 cells. h Western blotting and qualitative analysis of GDF15 expression in parental and sunitinib-resistant A375 cells. i GDF15 protein levels were quantified by western blotting in control (sgCtrl) and GDF15-deficient (sgGDF15) cells. j Dose response of sunitinib-induced death in sgCtrl and sgGDF15 A375 cells over a 24 h period. k GDF15 protein levels were quantified by western blotting in control (Flag vector) and GDF15 overexpression (Flag-GDF15) cells. l Dose response of sunitinib-induced death in vector and GDF15-overexpressing A375 cells over a 24 h period. Two-way ANOVA was performed in (a). Nonlinear regression was applied in (b, j and l). One-way ANOVA was performed in (e). Two-tailed unpaired Student’s t test was performed in (g and h). *P < 0.05; **P < 0.01; ***P < 0.001.
Fig. 6
Fig. 6. BRD4 regulates GDF15 expression by directly targeting its promoter or indirectly targeting the IL6/STAT3 axis.
a GDF15 mRNA levels in A375 and SK-MEL-28 cells after STAT3 silencing. b Western blotting and qualitative analysis of GDF15 expression in control and STAT3-silenced cells. c GDF15 mRNA levels in A375 and SK-MEL-28 cells after stattic treatment. d Western blotting and qualitative analysis of GDF15 expression in DMSO- and stattic-treated cells. e STAT3 binding peak in the GDF15 promoter in OCI-Ly10 and OCI-Ly19 cells (GSE50723). f Validation of STAT3 binding to the promoter of GDF15 in A375 cells by ChIP-qPCR. g GDF15 mRNA levels in STAT3-silenced cells after treatment with DMSO, 1 μM JQ1, or 10 nM NHWD-870 for 24 h. h Western blotting and qualitative analysis of GDF15 expression in STAT3-silenced cells after treatment with DMSO, 1 μM JQ1, or 10 nM NHWD-870 for 24 h. i GDF15 mRNA levels in stattic-treated cells after treatment with DMSO, 1 μM JQ1, or 10 nM NHWD-870 for 24 h. j Western blotting and qualitative analysis of GDF15 expression in stattic-treated cells after treatment with DMSO, 1 μM JQ1, or 10 nM NHWD-870 for 24 h. k BRD4 binding peak in the GDF15 promoter in siNC-treated and siBRD4-treated A375 cells (upper); BRD4 binding peak in the GDF15 promoter in DMSO-treated, JQ1-treated and BRD4-overexpressing cells (lower). l ChIP-qPCR analysis of the GDF15 promoter in A375 cells with an anti-BRD4 antibody or IgG after treatment with DMSO or 1 μM JQ1. One-way ANOVA was performed in (a, b, g, h, i and j). Two-tailed unpaired Student’s t test was performed in (c and d). T test with Welch’s correction was performed in (f). Two-way ANOVA was performed in (l). *P < 0.05; **P < 0.01; ***P < 0.001; ns nonsignificant.
Fig. 7
Fig. 7. Combination treatment with BET inhibitors and sunitinib causes melanoma suppression in vivo.
a Schedule for administration of sunitinib (40 mg/kg) and NHWD-870 (0.75 mg/kg) in tumor-bearing mice. b, c Tumor weight (b) and tumor volume (c) in the vehicle, NHWD-870, sunitinib, and combination groups. d Quantification of IHC staining of GDF15, p-STAT3 (Y705), and p-STAT3 (S727) in the sectioned tumors. e Ki67 staining of the sectioned tumors was performed to identify tumor cell proliferation in the vehicle, sunitinib, NHWD-870 and combination groups. f A TUNEL assay was performed to quantify apoptotic cells in xenograft tumors in the vehicle, sunitinib, NHWD-870 and combination groups. g A proposed working model. BET inhibitors synergize with sunitinib in melanoma cells by further inducing apoptosis and cell cycle arrest. Mechanistically, BET inhibitors sensitize melanoma cells to sunitinib by inhibiting the IL6/STAT3 signaling pathway and GDF15 expression. GDF15 is transcriptionally directly regulated by BRD4 or indirectly regulated by the BRD4/IL6/STAT3 axis. One-way ANOVA was performed in (b, d, e and f). Brown-Forsythe and Welch ANOVA was performed in (c). *P < 0.05; **P < 0.01; ***P < 0.001; ns nonsignificant.

References

    1. Schadendorf D, et al. Melanoma. Lancet. 2018;392:971–984. doi: 10.1016/S0140-6736(18)31559-9. - DOI - PubMed
    1. Deng G, et al. EEF2K silencing inhibits tumour progression through repressing SPP1 and synergises with BET inhibitors in melanoma. Clin. Transl. Med. 2022;12:e722. doi: 10.1002/ctm2.722. - DOI - PMC - PubMed
    1. Luebker SA, Koepsell SA. Diverse mechanisms of BRAF inhibitor resistance in melanoma identified in clinical and preclinical studies. Front. Oncol. 2019;9:268. doi: 10.3389/fonc.2019.00268. - DOI - PMC - PubMed
    1. Song C, et al. Recurrent tumor cell-intrinsic and -extrinsic alterations during MAPKi-induced melanoma regression and early adaptation. Cancer Discov. 2017;7:1248–1265. doi: 10.1158/2159-8290.CD-17-0401. - DOI - PMC - PubMed
    1. Curti BD, Faries MB. Recent advances in the treatment of melanoma. N. Engl. J. Med. 2021;384:2229–2240. doi: 10.1056/NEJMra2034861. - DOI - PubMed

Publication types

MeSH terms