. 2023 Feb;55(2):347-363.
doi: 10.1038/s12276-023-00935-z. Epub 2023 Feb 1.

TRPV1 regulates ApoE4-disrupted intracellular lipid homeostasis and decreases synaptic phagocytosis by microglia

Affiliations

TRPV1 regulates ApoE4-disrupted intracellular lipid homeostasis and decreases synaptic phagocytosis by microglia

Chenfei Wang et al. Exp Mol Med. 2023 Feb.

Abstract

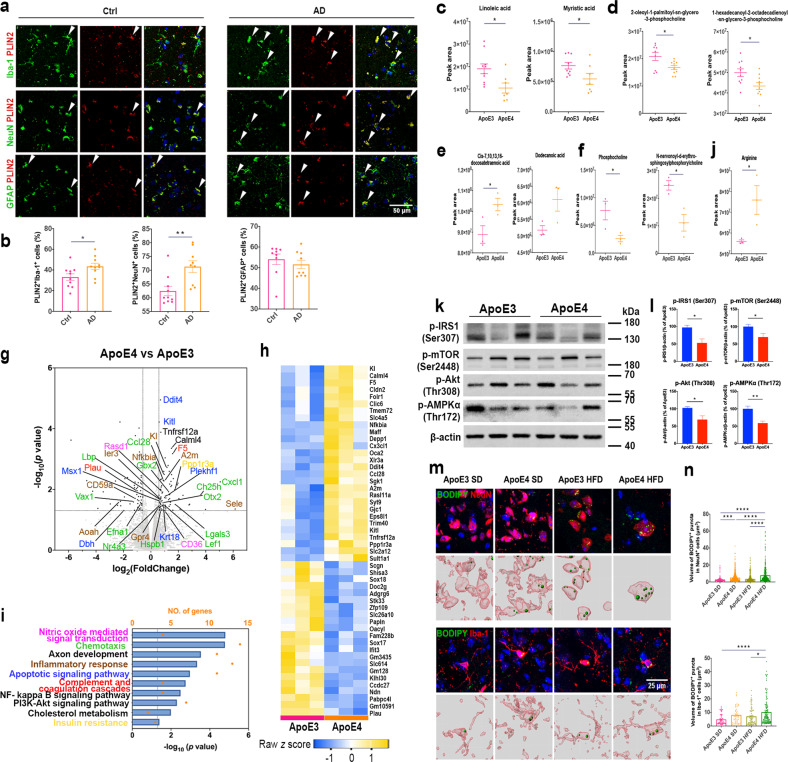
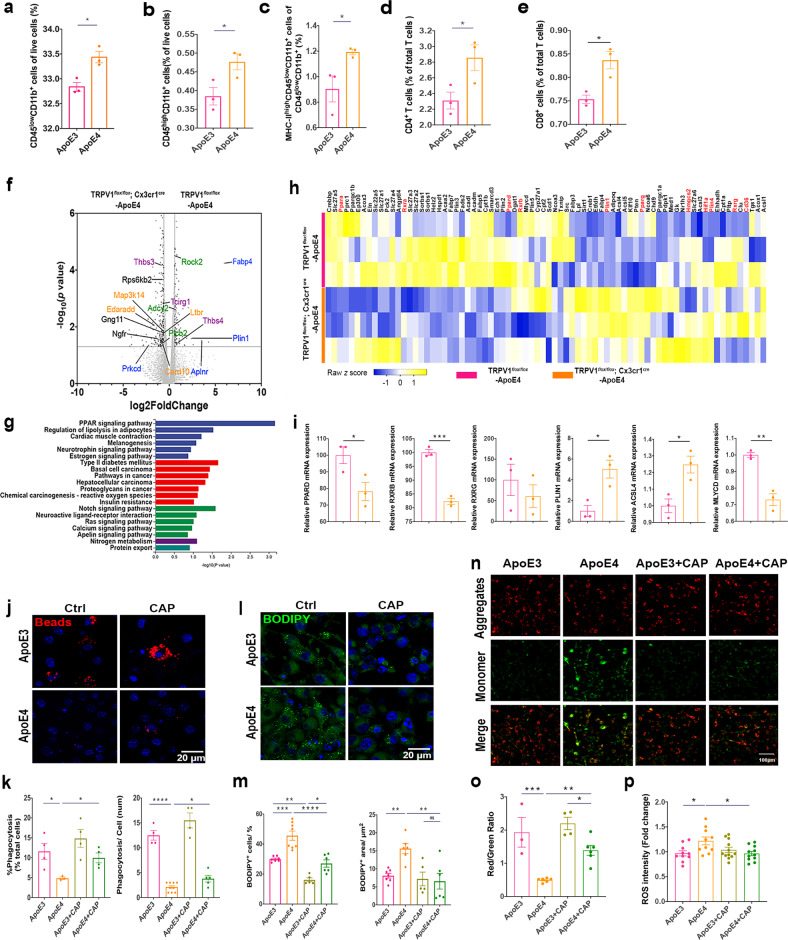
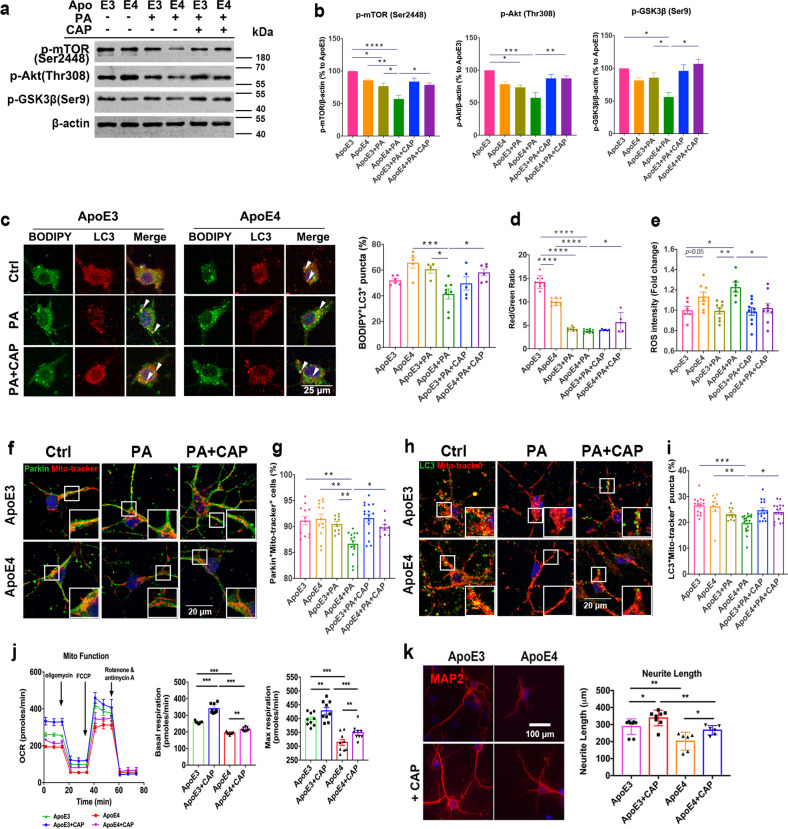
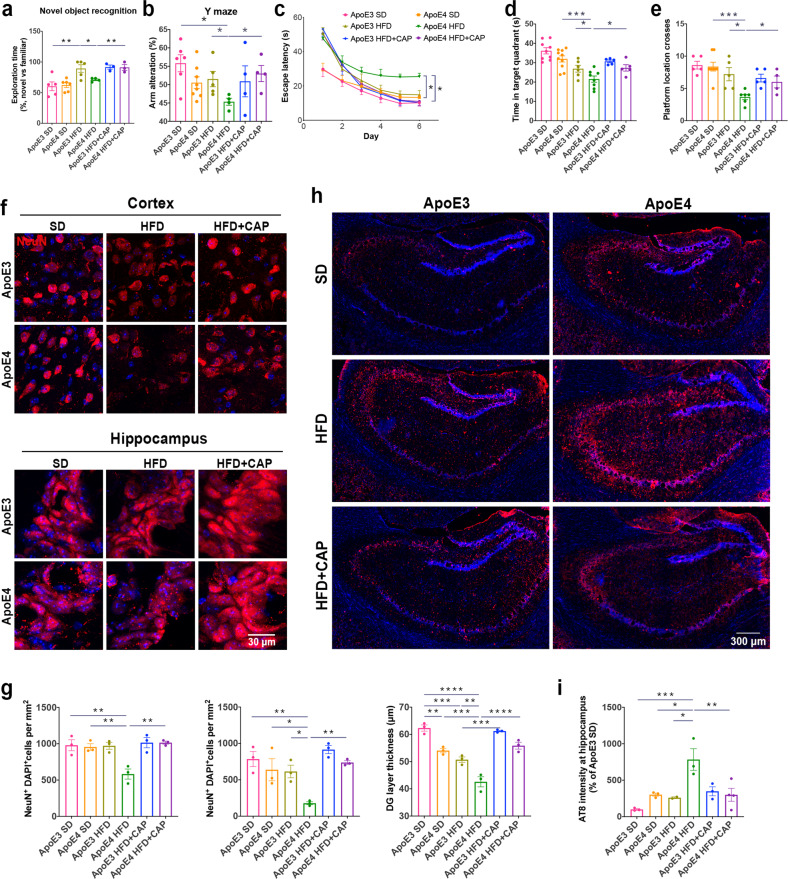
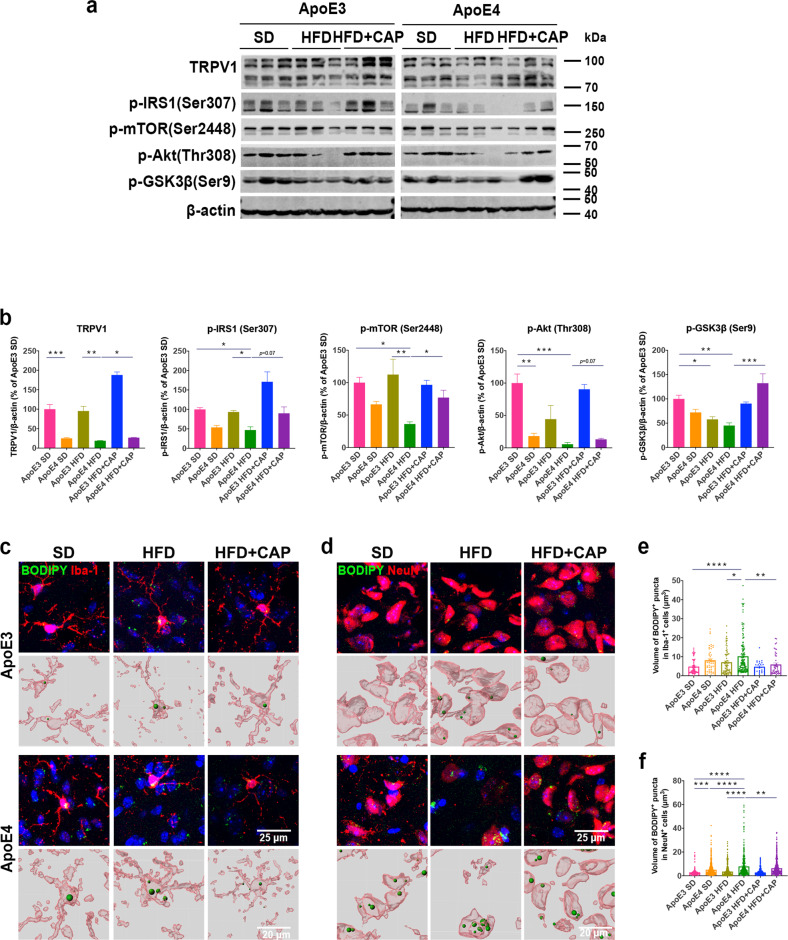
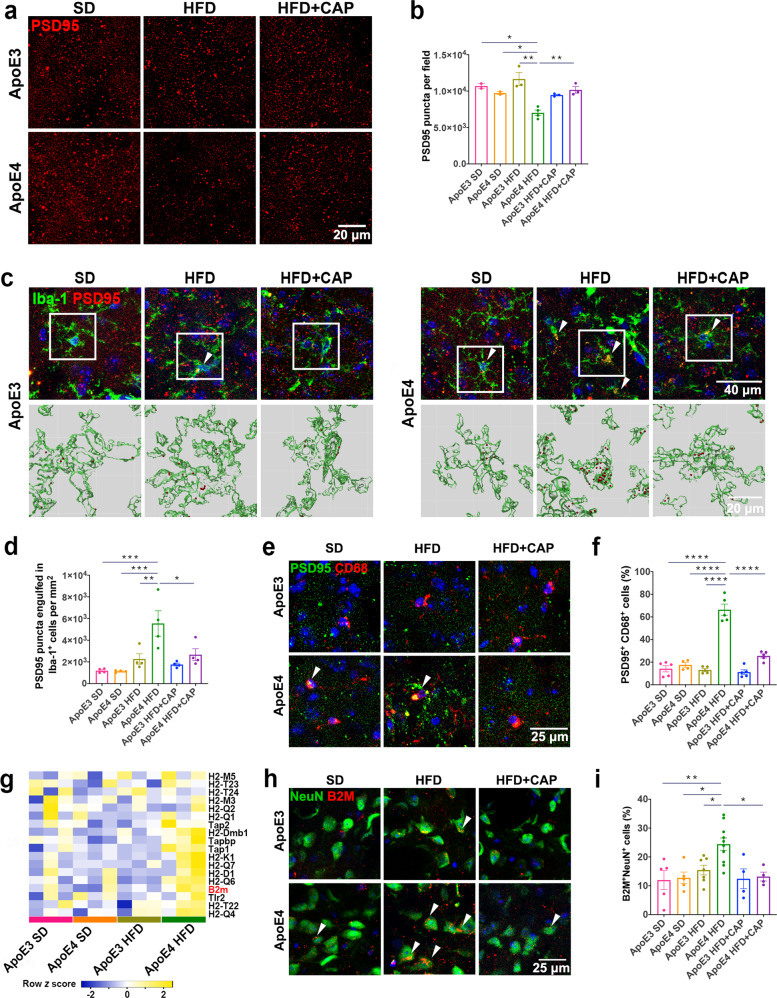
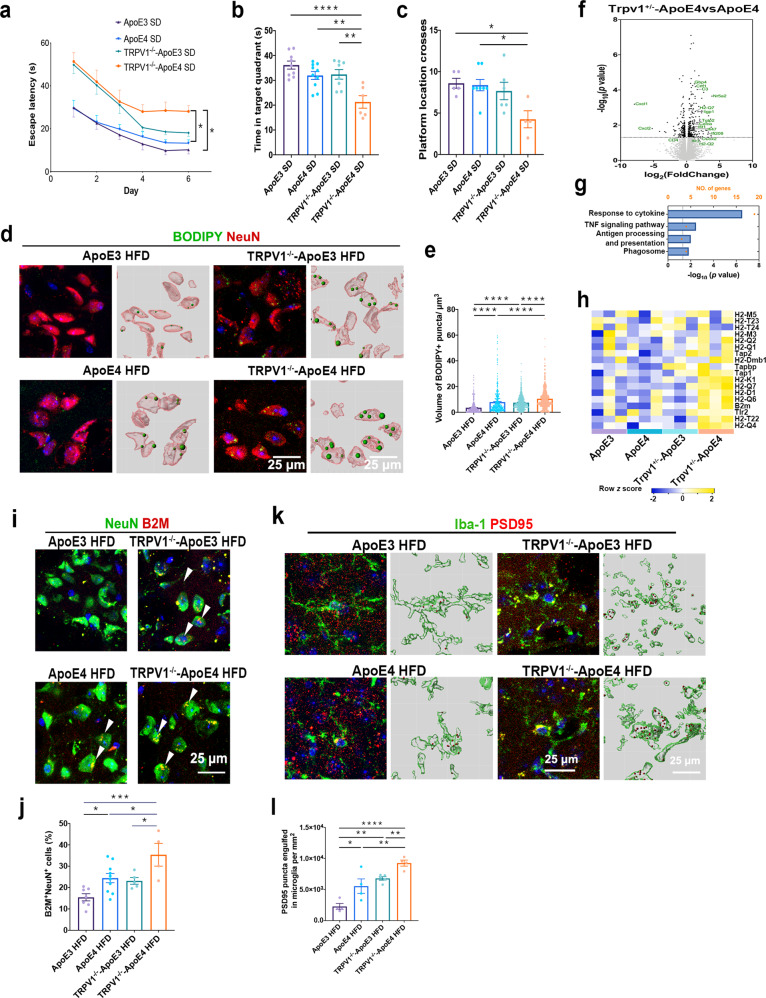
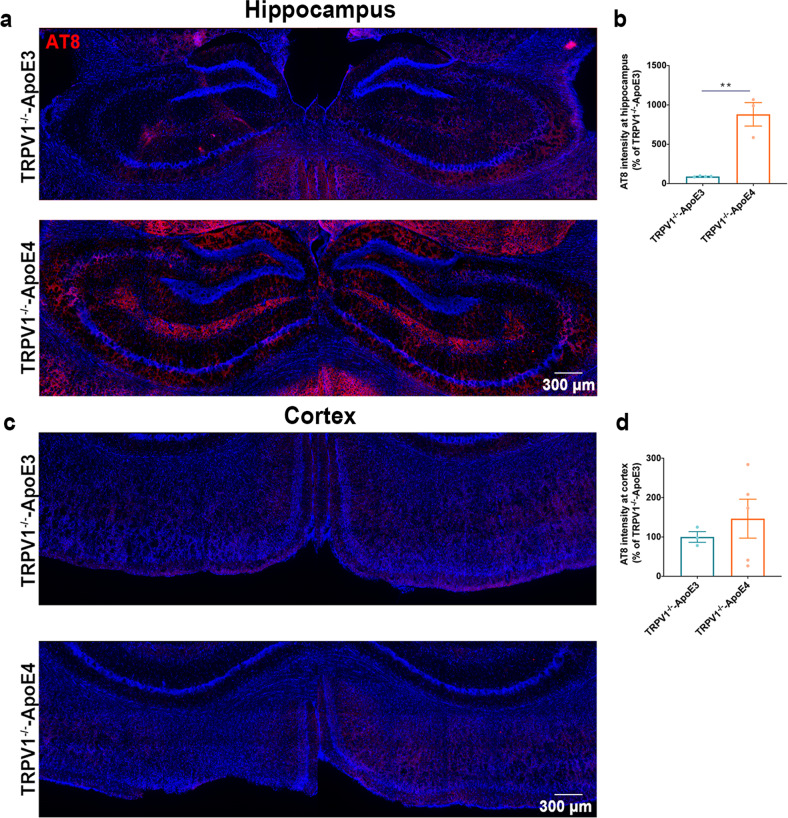
Although the ε4 allele of the apolipoprotein E (ApoE4) gene has been established as a genetic risk factor for many neurodegenerative diseases, including Alzheimer's disease, the mechanism of action remains poorly understood. Transient receptor potential vanilloid 1 (TRPV1) was reported to regulate autophagy to protect against foam cell formation in atherosclerosis. Here, we show that ApoE4 leads to lipid metabolism dysregulation in microglia, resulting in enhanced MHC-II-dependent antigen presentation and T-cell activation. Lipid accumulation and inflammatory reactions were accelerated in microglia isolated from TRPV1flox/flox; Cx3cr1cre-ApoE4 mice. We showed that metabolic boosting by treatment with the TRPV1 agonist capsaicin rescued lipid metabolic impairments in ApoE4 neurons and defects in autophagy caused by disruption of the AKT-mTOR pathway. TRPV1 activation with capsaicin reversed ApoE4-induced microglial immune dysfunction and neuronal autophagy impairment. Capsaicin rescued memory impairment, tau pathology, and neuronal autophagy in ApoE4 mice. Activation of TRPV1 decreased microglial phagocytosis of synapses in ApoE4 mice. TRPV1 gene deficiency exacerbated recognition memory impairment and tau pathology in ApoE4 mice. Our study suggests that TRPV1 regulation of lipid metabolism could be a therapeutic approach to alleviate the consequences of the ApoE4 allele.


Conflict of interest statement

The authors declare no competing interests.

Figures

Fig. 1
Fig. 1. APOE4 allele led to lipid metabolism dysfunction in neurons and microglia.
a Representative immunofluorescent images of PLIN2+ lipid droplets, Iba-1+ microglia, NeuN+ neurons, and GFAP+ astrocytes in the cerebral cortex of normal and ApoE4 AD individuals. b Mander’s colocalization coefficient quantification of PLIN2 and Iba-1, NeuN, or GFAP. c, d Significantly changed metabolites in the peripheral plasma of ApoE3 and ApoE4 mice. e, f Significantly changed metabolites in ApoE3 and ApoE4 mouse brains. g Volcano plot showing differentially expressed genes in ApoE3 and ApoE4 mouse brains. The dotted lines indicate the p < 0.05 and |fold change| > 1.5 cutoffs (two-sided Student’s t test, Benjamini‒Hochberg FDR). Genes enriched in pathways are colored in the same color in (i). h Heatmap showing the top 50 differentially expressed genes between ApoE3 and ApoE4 mice. i Enrichment pathway analysis of genes differentially expressed between ApoE3 and ApoE4 mouse brains. j Arginine levels in ApoE3 and ApoE4 mice were analyzed by MS. k, l Immunoblotting and quantification showing p-IRS1 (Ser307), p-mTOR (Ser2448), p-Akt (Thr308), and p-AMPK in ApoE3 and ApoE4 mouse brains. m Immunofluorescent images in the upper panel show brain cortical sections of ApoE3 and ApoE4 mice fed a SD or HFD costained for BODIPY+NeuN+ or BODIPY+Iba-1+ cells. The lower panel shows 3D reconstructions of BODIPY+NeuN+ or BODIPY+Iba-1+ cells. n Quantification of BODIPY+NeuN+ and BODIPY+Iba-1+ cell numbers in the cerebral cortex. n = 3 mice per group. Experiments on primary neurons were performed three times in technical triplicates. Statistical tests: two-sided Student’s t test (bf, j, l). One-way ANOVA followed by Tukey’s post hoc test (n). Data represent the mean ± s.e.m. *p < 0.05, **p < 0.01, ***p < 0.001, ****p < 0.0001. Scale bars, 50 μm (a); 100 μm (p).
Fig. 2
Fig. 2. TRPV1 activation reversed ApoE4-induced microglial lipid droplet accumulation and immune dysfunction.
a Gating strategy for flow cytometric analysis of ApoE3 and ApoE4 mouse brains. bf Quantification of flow cytometry in ApoE3 and ApoE4 mouse brains displaying the proportion of resident microglia (CD45lowCD11b+), monocytes (CD45highCD11b+), CD4+ T cells, CD8+ T cells, and MHC-II high-expressing resident microglia. g Volcano plot showing differentially expressed genes between TRPV1flox/flox; Cx3cr1cre-ApoE4 and TRPV1flox/flox-ApoE4 mouse brains. The dotted lines indicate the p < 0.05 and |fold change| > 1.5 cutoff (two-sided Student’s t test, Benjamini‒Hochberg FDR). Genes enriched in pathways related to lipid accumulation are colored blue, those enriched in pathways related to the immune response are colored purple, those enriched in pathways related to inflammatory reactions are colored orange, and those enriched in pathways related to chemotaxis are colored green. h KEGG enrichment pathway analysis of genes differentially expressed between TRPV1flox/flox; Cx3cr1cre-ApoE4 and TRPV1flox/flox-ApoE4 mouse brains. Blue indicates the organismal systems category, red indicates the human diseases category, green indicates the environmental information processing category, purple indicates the metabolism category, and cyan indicates the genetic information processing category. i Heatmap showing the expression levels of PPAR target genes between TRPV1flox/flox; Cx3cr1cre-ApoE4 and TRPV1flox/flox-ApoE4 mouse brains. j Histograms depict quantitative analysis of differentially expressed target genes of PPARs between TRPV1flox/flox; Cx3cr1cre-ApoE4, and TRPV1flox/flox-ApoE4 mouse brains. kp BV2 cells treated with human recombinant ApoE3 or ApoE4 (150 nM) with or without 10 μM capsaicin pretreatment. k, l Representative confocal images and quantification of the phagocytosis assay. m, n Representative confocal images and quantification of BODIPY staining in BV2 cells. o, p Quantification of cellular MMP (o) and cellular ROS (p) production in BV2 cells stained by JC-1 and DCFH-DA. n = 3 mice per group. Experiments on BV2 cells were performed three times in technical triplicates. Statistical tests: two-sided Student’s t test (bf, j) and one-way ANOVA followed by Tukey’s post hoc test (h, i, l, o, n, p). Data represent the mean ± s.e.m. *p < 0.05, **p < 0.01, ***p < 0.001, ****p < 0.0001. Scale bars, 20 μm (k, m), 100 μm (o).
Fig. 3
Fig. 3. TRPV1 activation reversed ApoE4-induced neuronal autophagy impairment and lipid droplet accumulation in vitro.
a, b Western blot and quantification of phospho-mTOR (Ser2448), phospho-Akt (Thr308), and phospho-GSK3β in SH-sy5y cells treated with 150 nM recombinant ApoE and 100 μM PA for 24 h. c Representative immunofluorescent images and quantification of BODIPY+LC3+ puncta in primary neurons. d Quantification of cellular MMP in primary neurons stained with JC-1. e Quantification of cellular ROS production in primary neurons stained with DCFH-DA. fi Representative immunofluorescent images and quantification of Parkin and MitoTracker Red (f, g) or LC3 and MitoTracker Red (h, i). j Mitochondrial stress test of 150 nM ApoE3- and ApoE4-treated neurons for 24 h with pretreatment with 10 μM capsaicin; basal respiration and maximal respiration are shown. k Confocal images of MAP2+ (neurite) cells treated with 150 nM ApoE3 and ApoE4 for 24 h. Quantification of the mean neurite length of MAP2+ cells from confocal images. Experiments on primary neurons were performed three times in technical triplicates. Statistical tests: one-way ANOVA followed by Tukey’s post hoc test (be, g, i, j, k). Data represent the mean ± s.e.m. *p < 0.05, **p < 0.01, ***p < 0.001, ****p < 0.0001. Scale bars, 25 μm (c), 20 μm (f, h), 100 μm (k).
Fig. 4
Fig. 4. TRPV1 activation rescued memory impairment and neuronal loss in ApoE4 HFD-fed mice.
a, b Novel object recognition and Y maze behavioral assessments for ApoE3 and ApoE4 HFD-fed mice with capsaicin treatment. ce MWM behavioral assessment of ApoE3 and ApoE4 mice. c Line chart shows MWM escape latency (time to find the hidden platform) for six consecutive days. Histograms show the time spent in the target quadrant (d) and the number of platform location crossings (e) in the MWM probe trial. n = 5, 7, 5, 5, 4, 4 mice per group during behavioral assessments (ae). f, g Representative immunofluorescent images and quantification of NeuN+ cells in the cerebral cortex and hippocampus of ApoE3 and ApoE4 HFD-fed mice treated with capsaicin. h, i Phosphorylated tau (AT-8)-covered area in the hippocampus of ApoE3, ApoE3 HFD-fed, ApoE4, and ApoE4 HFD-fed mice treated with capsaicin. n = 3 mice per group (f, h). Statistical tests: one-way ANOVA followed by Tukey’s post hoc test (a, b, d, e, g, i) and two-way ANOVA followed by Tukey’s post hoc test (c). Data represent the mean ± s.e.m. *p < 0.05, **p < 0.01, ***p < 0.001, ****p < 0.0001. Scale bars, 30 μm (f); 300 μm (h).
Fig. 5
Fig. 5. TRPV1 activation reversed lipid droplet accumulation in ApoE4 HFD mice.
a, b Western blot and quantification of TRPV1, p-IRS1 (Ser307), p-mTOR (Ser2448), p-Akt (Thr308), and p-GSK3β (Ser9) levels. c, d Immunofluorescent images in the upper panel show cortical sections of ApoE3 and ApoE4 mice costained for BODIPY+Iba-1+ (c) or BODIPY+NeuN+ (d) cells. The lower panel shows 3D reconstructions of BODIPY+Iba-1+ or BODIPY+NeuN+ cells. e, f Quantification of BODIPY+Iba-1+ or BODIPY+NeuN+ cell percentages in the cerebral cortex. n = 3 mice per group (a, c, d). Statistical tests: one-way ANOVA followed by Tukey’s post hoc test (b, e, f). Data represent the mean ± s.e.m. (b, e, f). *p < 0.05, **p < 0.01, ***p < 0.001, ****p < 0.0001. ns, not significant. Scale bars, 25 μm (upper panel), 20 μm (lower panel).
Fig. 6
Fig. 6. TRPV1 activation attenuated microgliosis and microglial lipid accumulation in ApoE4 HFD mice.
a Heatmap showing gene expression profiles correlated with microglial proinflammatory reactions (Cluster 1) and normal functions (Cluster 2). b Differentially expressed Cluster 1 genes between HFD-fed ApoE3 and ApoE4 mice from the heatmap (a). c Immunofluorescent images of Iba-1+ cells of ApoE3 and ApoE4 mice in the cerebral cortex (upper panel) and amplified single Iba-1+ cells (lower panel). d Morphological analyses of Iba-1+ cells from the immunofluorescence micrographs (c). Blue bars indicate ApoE3 mice, and red bars indicate ApoE4 mice. e Representative immunofluorescent images of FITC-labeled Aβ1-42 and Iba-1+ cells of ApoE3 and ApoE4 mice. f Quantification of Aβ1–42 uptake in Iba-1+ cells. g, h Representative immunofluorescent images and quantification of MAP2 in primary cortical neurons. i, j Representative immunofluorescent images and quantification of BODIPY+ puncta in primary neurons. n = 3 mice per group. Statistical tests: two-sided Student’s t test (b), two-way ANOVA followed by Sidak’s multiple comparison test (d), one-way ANOVA followed by Tukey’s post hoc test (f, h, j). Data represent the mean ± s.e.m. *p < 0.05, **p < 0.01, ***p < 0.001, ****p < 0.0001. Scale bars, 50 μm (c upper panel), 20 μm (c lower panel), 25 μm (e).
Fig. 7
Fig. 7. TRPV1 activation attenuated microglial phagocytosis of synapses in ApoE4 HFD mice.
a, b Representative immunofluorescent images and quantification of PSD95 puncta in the cortex of ApoE3 and ApoE4 mice. c, d Representative immunofluorescence micrographs and quantification of PSD95 engulfed in Iba-1+ microglia (upper panel) and 3D reconstruction (lower panel) showing the volume of Iba-1 (green) and engulfed PSD95 puncta (red) in the cortex of ApoE3 and ApoE4 mice. e, f Representative immunofluorescent images and quantification of PSD95 (green) and CD68 (red) in the cortex of ApoE3 and ApoE4 mice. g Heatmap showing gene expression profiles enriched in the MHC-1 pathway of HFD-fed ApoE3 and ApoE4 mice. h, i Representative immunofluorescent images and quantification of NeuN+ and B2M+ cells in the cortex of ApoE3 and ApoE4 mice. n = 3 mice per group. Statistical tests: one-way ANOVA followed by Tukey’s post hoc test (b, d, f, i). Data represent the mean ± s.e.m. *p < 0.05, **p < 0.01, ***p < 0.001, ****p < 0.0001. Scale bars, 20 μm (a, c upper panel), 10 μm (c lower panel), 25 μm (f, h).
Fig. 8
Fig. 8. TRPV1 genetic deficiency exacerbated recognition impairment and neuronal lipid droplet accumulation in ApoE4 mice.
ac MWM for TRPV1−/−-ApoE3 and TRPV1−/−-ApoE4 mice. Line chart shows MWM escape latency (time to find the hidden platform) for six consecutive days (a). Histograms show time spent in the target quadrant and times crossing the platform location in the MWM probe trial (b, c). d Immunofluorescent images in the left panel show cortical sections of ApoE3 and ApoE4 mice stained for BODIPY and NeuN. The right panel shows 3D reconstructions of BODIPY+NeuN+ neuronal soma. e Volume of BODIPY+ puncta in NeuN+ cells in the cerebral cortex. f Volcano plot showing differentially expressed genes between ApoE4 and TRPV1−/−-ApoE4 mouse brains. Dotted lines indicate the p < 0.05 cutoff (n = 3 mice per group; two-sided Student’s t test, Benjamini‒Hochberg FDR). g Enrichment pathway analysis of genes differentially expressed in ApoE4 and TRPV1−/−-ApoE4 mouse brains. h Heatmap showing gene expression profiles enriched in the MHC-I pathway in TRPV1−/−-ApoE3 and TRPV1−/−-ApoE4 mice. i, j Representative immunofluorescent images and quantification of NeuN+ and B2M+ cells in the cortex of ApoE3 and ApoE4 mice. k Representative immunofluorescence micrographs of ApoE3 and ApoE4 mouse cerebral cortex stained for Iba-1 and PSD95 (left panel) and 3D reconstruction (right panel) showing the volume of Iba-1 (green) and engulfed PSD95 puncta (red). l Quantification of PSD95 puncta numbers and Iba-1 engulfed from immunofluorescent images. n = 3 mice per group. Statistical tests: one-way ANOVA followed by Tukey’s post hoc test (b, c, e, g, j, l) and two-way ANOVA followed by Tukey’s post hoc test (a). Data represent the mean ± s.e.m. *p < 0.05, **p < 0.01, ****p < 0.0001. Scale bars, 25 μm.
Fig. 9
Fig. 9. TRPV1 genetic deficiency exacerbated ApoE4-induced tau pathology.
ad Phosphorylated tau-covered area in the cortex and hippocampus of TRPV1−/−-ApoE3 and TRPV1−/−-ApoE4 mice. (n = 3, biological replicates). Statistical tests: two-sided Student’s t test (b, d). Data represent the mean ± s.e.m. **p < 0.01. Scale bars, 300 μm.

Similar articles

Cited by

References

    1. Zalocusky KA, et al. Neuronal ApoE upregulates MHC-I expression to drive selective neurodegeneration in Alzheimer’s disease. Nat. Neurosci. 2021;24:786–798. doi: 10.1038/s41593-021-00851-3. - DOI - PMC - PubMed
    1. Shi Y, et al. ApoE4 markedly exacerbates tau-mediated neurodegeneration in a mouse model of tauopathy. Nature. 2017;549:523–527. doi: 10.1038/nature24016. - DOI - PMC - PubMed
    1. Bagyinszky E, Youn YC, An SS, Kim S. The genetics of Alzheimer’s disease. Clin. Interv. Aging. 2014;9:535–551. doi: 10.2147/CIA.S51571. - DOI - PMC - PubMed
    1. Belloy ME, Napolioni V, Greicius MD. A quarter century of APOE and Alzheimer’s disease: progress to date and the path forward. Neuron. 2019;101:820–838. doi: 10.1016/j.neuron.2019.01.056. - DOI - PMC - PubMed
    1. Mahley RW, Weisgraber KH, Huang Y. Apolipoprotein E4: a causative factor and therapeutic target in neuropathology, including Alzheimer’s disease. Proc. Natl Acad. Sci. USA. 2006;103:5644–5651. doi: 10.1073/pnas.0600549103. - DOI - PMC - PubMed

Publication types