. 2023 Jan 31;13(1):1802.
doi: 10.1038/s41598-023-28816-5.

Integrated multiomics analysis to infer COVID-19 biological insights

Affiliations

Integrated multiomics analysis to infer COVID-19 biological insights

Mahmoud Sameh et al. Sci Rep. .

Abstract

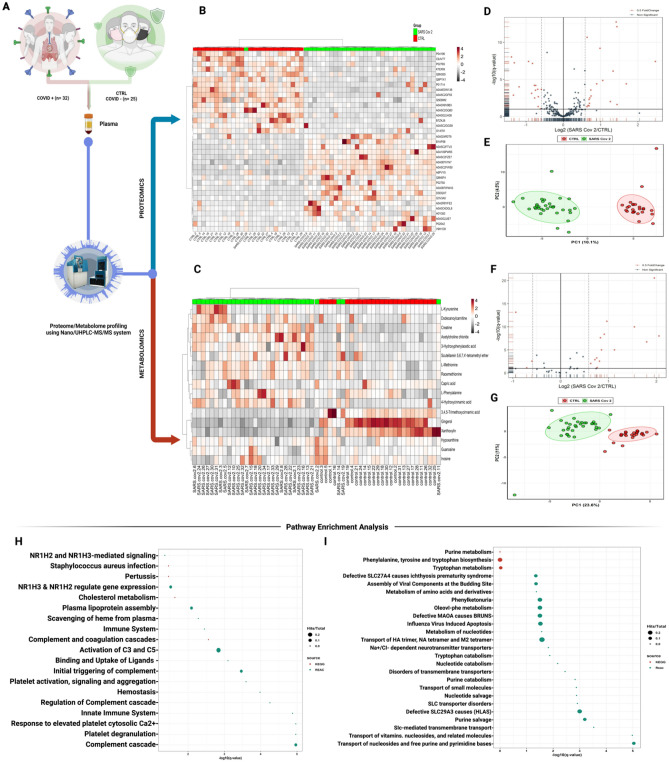
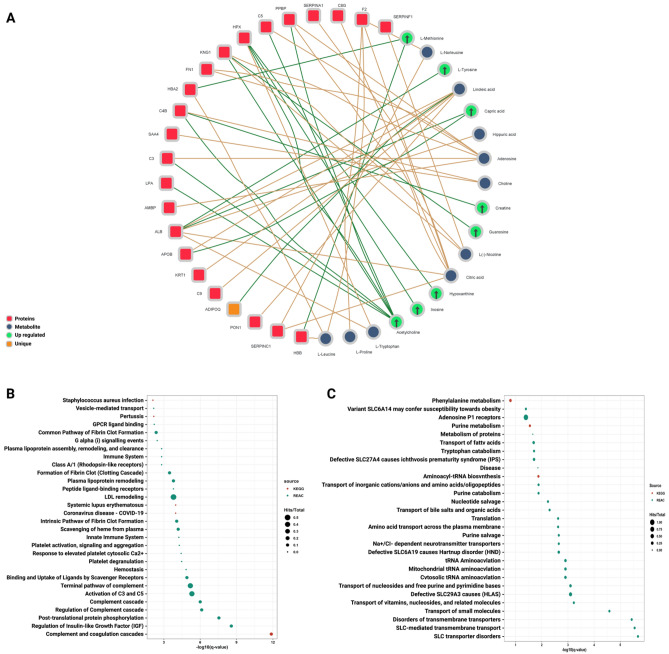
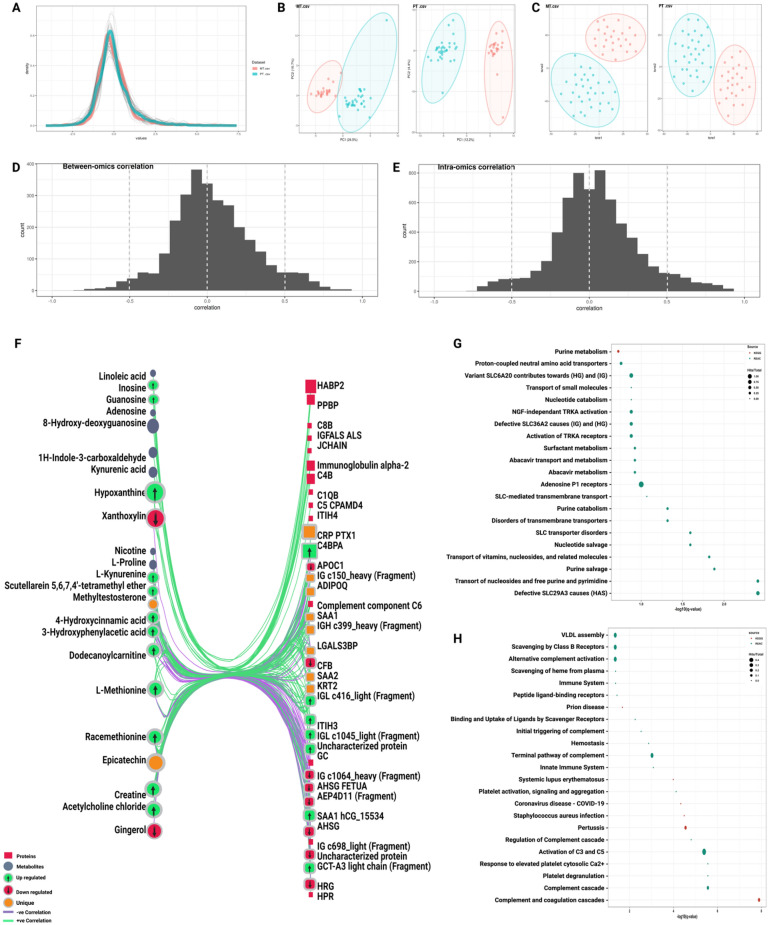
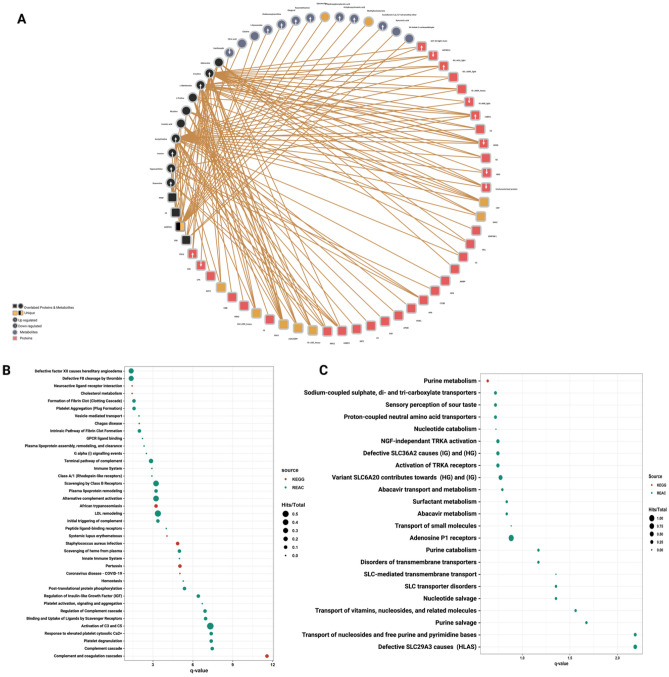
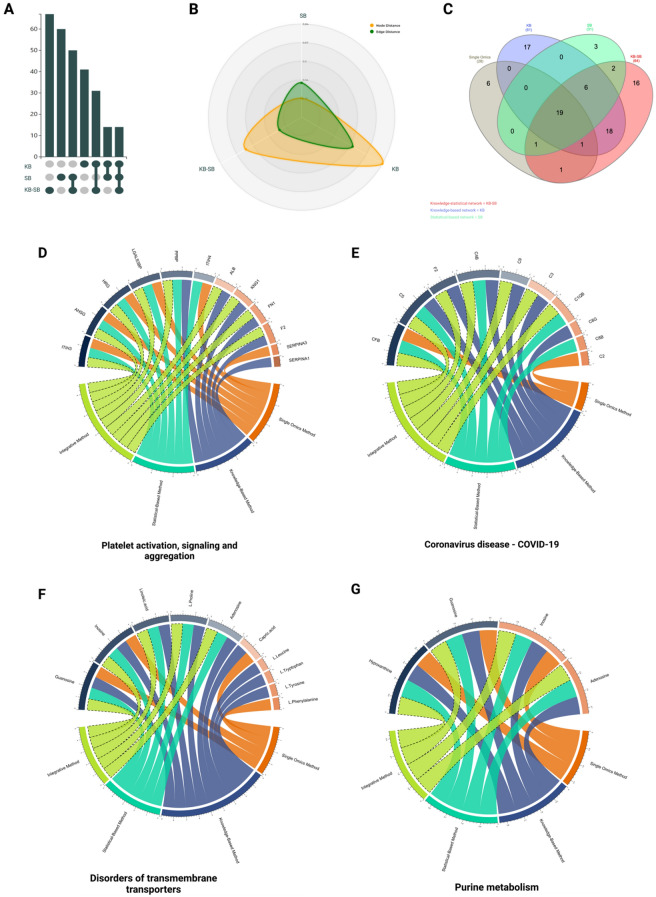
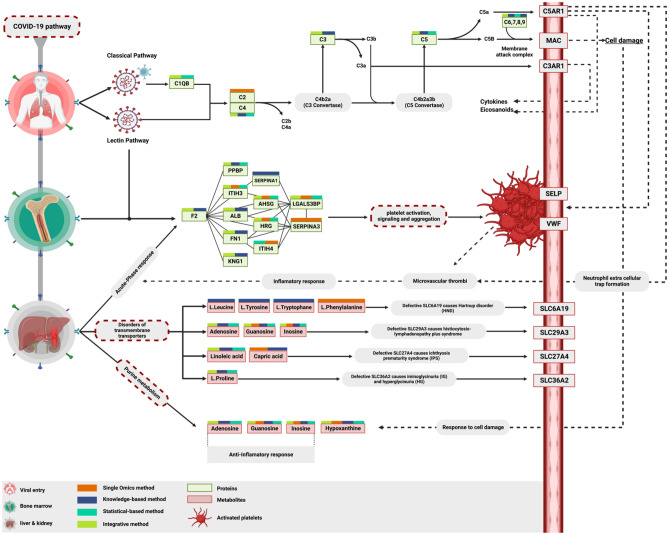
Three years after the pandemic, we still have an imprecise comprehension of the pathogen landscape and we are left with an urgent need for early detection methods and effective therapy for severe COVID-19 patients. The implications of infection go beyond pulmonary damage since the virus hijacks the host's cellular machinery and consumes its resources. Here, we profiled the plasma proteome and metabolome of a cohort of 57 control and severe COVID-19 cases using high-resolution mass spectrometry. We analyzed their proteome and metabolome profiles with multiple depths and methodologies as conventional single omics analysis and other multi-omics integrative methods to obtain the most comprehensive method that portrays an in-depth molecular landscape of the disease. Our findings revealed that integrating the knowledge-based and statistical-based techniques (knowledge-statistical network) outperformed other methods not only on the pathway detection level but even on the number of features detected within pathways. The versatile usage of this approach could provide us with a better understanding of the molecular mechanisms behind any biological system and provide multi-dimensional therapeutic solutions by simultaneously targeting more than one pathogenic factor.


Conflict of interest statement

The authors declare no competing interests.

Figures

Figure 1
Figure 1
Proteomic and metabolomic analysis of plasma from COVID-19 patients. (A) Holistic view of the experimental design starts with plasma extraction from 57 individuals: 25 healthy individuals and 32 severely diagnosed SARS-CoV-2-positive patients. (B, C) Heat map hierarchical clustering highlights the top 25 significant proteins and metabolites between the two groups, respectively. (D, F) Volcano plot analysis showing DEPs and DEMs, respectively (E, G) Principle component analysis for proteomics and metabolomics profiles, respectively. (H, I) pathway enrichment analysis of untargeted proteomics (H) and metabolomics (I) retrieved from KEGG and Reactome databases using proteins and metabolites passed FDR 5% (q-value) and p value < 0.05. Colours represent different databases. The size of the circle reflects the identified number of hits over the total pathway entities. The x-axis represents the –log10 of the q-value.
Figure 2
Figure 2
Knowledge-based interactions between plasma proteins and metabolites. The knowledge-based network generated by MetaboAnalyst and visualized by Cytoscape. (A) The network shows the metabolite-protein interactions across both omics The network contained 14 proteins, 18 metabolites, and 48 protein-metabolite interactions. Proteins are labelled in red and metabolites in blue. Upregulated and unique molecules are tagged in green and orange, respectively. (B, C) Pathway enrichment analyses applied on the knowledge-based network and retrieved from KEGG (red) and Reactome (green) databases. The circle size reflects the identified hits in this pathway divided by the total entities and the x-axis is the –log10 of the q-value.
Figure 3
Figure 3
Statistical-based correlation between plasma proteins and metabolites. (A) Alignment and distribution of proteomic and metabolomic datasets after the auto-scaling and prior to integration. (B, C) PCA and t-SNE plots for both omics among healthy individuals and COVID-19 patients (D, E) correlation between and intra-omics datasets (F) The Statistical-based network contains 37 proteins labeled in red and 23 metabolites labeled in blue, with 64 negative correlation edges highlighted in purple and 179 positive correlation edges highlighted in green. (G, H) Pathway enrichment analyses applied on the statistical-based network and retrieved from KEGG (red) and Reactome (green) databases. The circle size reflects the number of identified hits in the pathway divided by the total entities within the same pathway. The x-axis represents the –log10 of the q-value.
Figure 4
Figure 4
Integrated Knowledge-statistical-omics based network. (A) Integrated knowledge-statistical based network. The black colored nodes represent 14 overlapped features between the knowledge-based and the statistical-based networks interacting with 14 metabolites highlighted in blue and 39 proteins highlighted in red. Unique features highlighted in orange and each up or down regulated feature is marked with an up or down arrow as illustrated in the figure legend. (B, C) Pathway enrichment analyses applied on the knowledge-statistical based network and rerieved from KEGG (red) and Reactome (green) databases. The circle size reflects the number of identified hits in the pathway divided by the total entities within the same pathway. The x-axis represents the –log10 of the q-value.
Figure 5
Figure 5
Networks comparative analysis and pathways tracking analysis. (A) UpSet plot comparing node size of each network generated from different omics method. The knowledge-statistical network (KB-SB) has the largest node size with 43 proteins and 24 metabolites. Meanwhile, the knowledge-based network (KB) has the smallest node size with 23 proteins and 18 metabolites and also revealed 14 overlapped features in the intersection between the knowledge-based and statistical-based networks. (B) Radar plot shows the similarity between the networks on both node and edge levels based on the distances between them, the node distance is highlighted in green and the edge distance is highlighted in yellow. (C) Significant pathways (FDR < 0.05) uncovered by each method were compared to each other and represented by the Venn diagram. (D–G) Four pathways were further tracked for a better understanding of how far each method can see inside the pathway, including (D) platelet activation, (E) coronavirus disease, (F) disorders of transmembrane transporters pathways, and (G) purine metabolism pathway. Each method was highlighted in a different color as illustrated in the chord plot.
Figure 6
Figure 6
Key Proteins and Metabolites characterized by each omics method in severe COVID-19 Patients. Multi-omics methods were able to pinpoint the SARS-CoV-2 activation on both classical and lectin pathways with subsequent visualizing the whole complement cascade. This scenario leads to cell damage caused by the membrane attack complex, neutrophils recruited by chemoattractant like PPBP, inducing the elevation of various APPs such as F2, ITIH3, ITIH4, ALB, KNG, AHSG, and HRG. Additionally, it induces platelet activation, signalling, and aggregation. In contrast, the single omics analysis was able to uncover only one C2 in the initiation of the complement cascade and few APPs in the platelet activation pathway. On the metabolic side, the multi-omics approaches were able to uncover most of the hits in the “Disorder of transmembrane transporters” and “Purine metabolism” pathways compared to single omics.

References

    1. Yuki, K., Fujiogi, M. & Koutsogiannaki, S. COVID-19 pathophysiology: A review. Clin. Immunol. 108427 (2020). - PMC - PubMed
    1. Zhang X, et al. Viral and host factors related to the clinical outcome of COVID-19. Nature. 2020;583:437–440. doi: 10.1038/s41586-020-2355-0. - DOI - PubMed
    1. WHO. Coronavirus Disease (COVID-19) Dashboard., https://covid19.who.int/ (2021).
    1. Rabi FA, Al Zoubi MS, Kasasbeh GA, Salameh DM, Al-Nasser AD. SARS-CoV-2 and coronavirus disease 2019: What we know so far. Pathogens. 2020;9:231. doi: 10.3390/pathogens9030231. - DOI - PMC - PubMed
    1. Gorbalenya AE, et al. The species Severe acute respiratory syndrome-related coronavirus: Classifying 2019-nCoV and naming it SARS-CoV-2. Nat. Microbiol. 2020;5(4):536–544. doi: 10.1038/s41564-020-0695-z. - DOI - PMC - PubMed

Publication types