. 2023 Jan 31;13(1):1749.
doi: 10.1038/s41598-023-28508-0.

Combined space stressors induce independent behavioral deficits predicted by early peripheral blood monocytes

Affiliations

Combined space stressors induce independent behavioral deficits predicted by early peripheral blood monocytes

Kira D A Rienecker et al. Sci Rep. .

Abstract

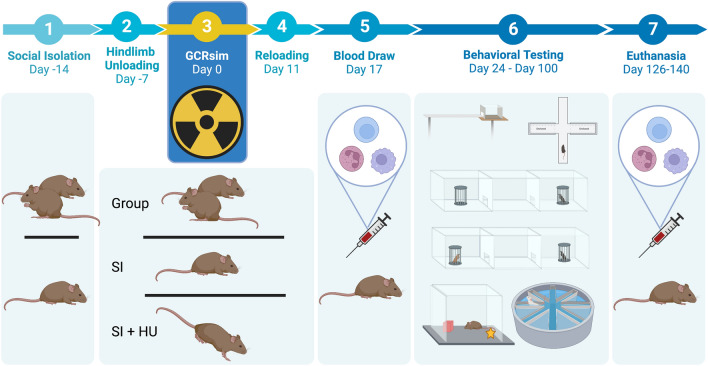
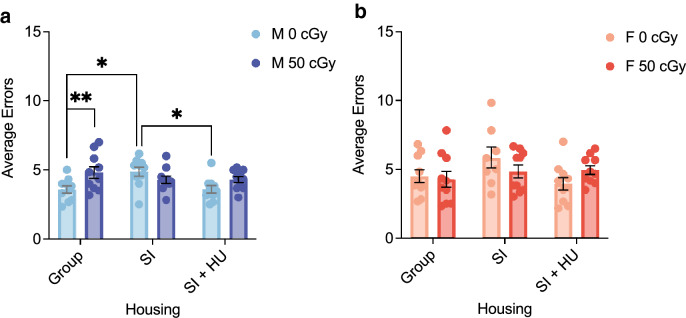
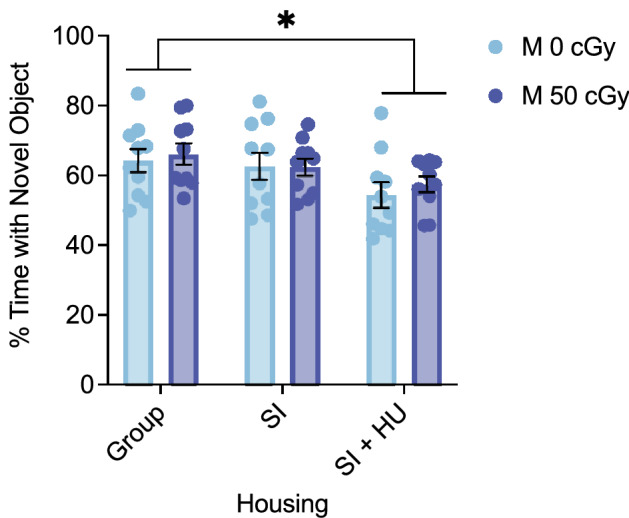
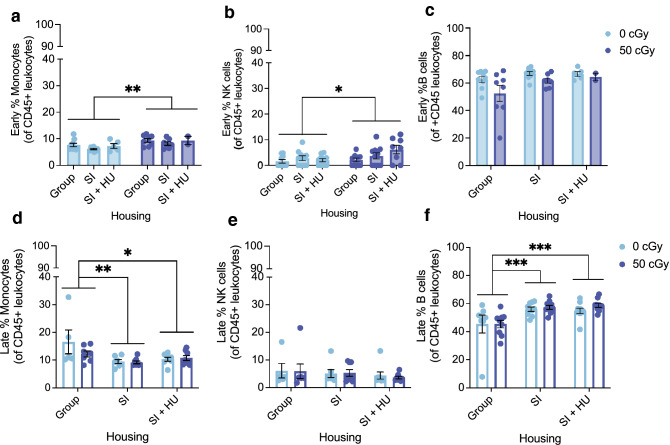
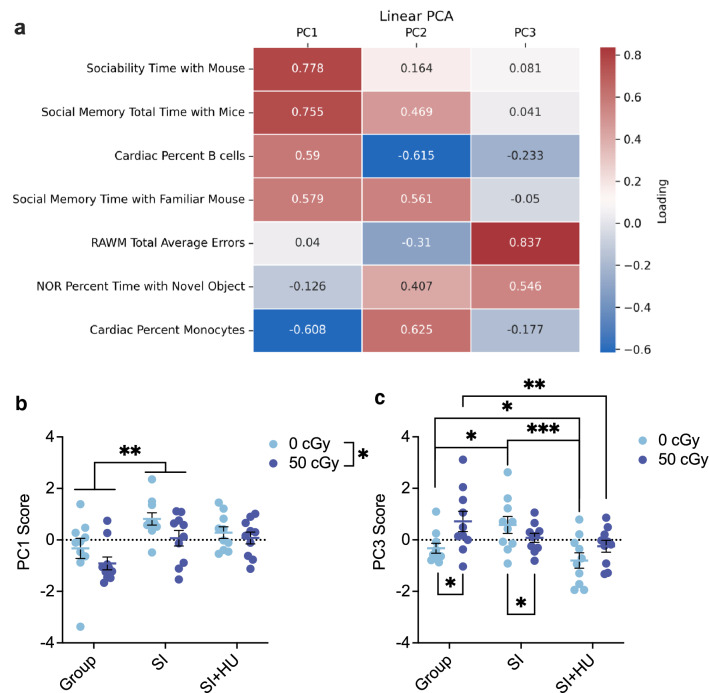
Interplanetary space travel poses many hazards to the human body. To protect astronaut health and performance on critical missions, there is first a need to understand the effects of deep space hazards, including ionizing radiation, confinement, and altered gravity. Previous studies of rodents exposed to a single such stressor document significant deficits, but our study is the first to investigate possible cumulative and synergistic impacts of simultaneous ionizing radiation, confinement, and altered gravity on behavior and cognition. Our cohort was divided between 6-month-old female and male mice in group, social isolation, or hindlimb unloading housing, exposed to 0 or 50 cGy of 5 ion simplified simulated galactic cosmic radiation (GCRsim). We report interactions and independent effects of GCRsim exposure and housing conditions on behavioral and cognitive performance. Exposure to GCRsim drove changes in immune cell populations in peripheral blood collected early after irradiation, while housing conditions drove changes in blood collected at a later point. Female mice were largely resilient to deficits observed in male mice. Finally, we used principal component analysis to represent total deficits as principal component scores, which were predicted by general linear models using GCR exposure, housing condition, and early blood biomarkers.


Conflict of interest statement

The authors declare no competing interests.

Figures

Figure 1
Figure 1
Experimental Design. Days are relative to GCRsim exposure, designated Day 0. On Day-14, animals were split into group housing and social isolation (SI) housing. On Day-7, socially isolated animals in the SI + HU group began hindlimb unloading (HU). GCRsim dose (0 cGy or 50 cGy) was delivered in one exposure on Day 0. All animals were loaded into the beam line housing array for dose delivery. SI + HU animals remained in hindlimb unloading posture. On Day 11, SI + HU animals were reloaded, and given a recovery period before being shipped from Brookhaven National Lab to UCSF. Blood was collected by tail vein on Day 17, and behavioral testing began with the Balance Beam on Day 24. Behavioral testing continued with EPM, Three Chamber Social Approach, Open Field, NOR, and RAWM, concluding around Day 100. Animals were euthanized around Day 126–140, and blood was collected by cardiac puncture for analysis. Created with BioRender.com.
Figure 2
Figure 2
Combined stressors and biological sex differences in spatial learning. Radial Arm Water Maze (RAWM) was used to measure spatial learning under different housing and treatment conditions. Total Average Errors over 6 trials for Males (a) and Females (b). A two-way ANOVA showed a significant interaction between GCR and Housing for Total Average Errors (F(2,54) = 4.838, p = 0.012, η2 = 0.152). The simple main effect of GCR (F(1,54) = 8.340, p = 0.006, η2 = 0.134) showed a significant increase in average errors in 50 cGy compared to 0 cGy group housed males (mean diff 1.233, 95%CI(.377 to 2.090), p = 0.006), and the simple main effect of housing (F(2,54) = 6.036, p = 0.004, η2 = 0.183) showed a significant increase in average errors in 0 cGy SI males compared to 0 cGy group housed (mean diff 1.293, 95%CI(.238 to 2.349), p = 0.011) and SI + HU housed males (mean diff 1.277, 95%CI (.221 to 2.332), p = 0.013). Males: n = 10 per group for 60 total mice. Females: n = 10 for all groups except Group 50 cGy (n = 9), SI 0 cGy (n = 8) for 57 total mice. *p < 0.05, **p < 0.01.
Figure 3
Figure 3
Combined stressors impair recognition memory. The novel object recognition (NOR) task was used to assess object recognition memory. (a) There was a significant main effect of Housing on % Time spent with the Novel Object during NOR Day 4 (F(2,54) = 4.523, p = 0.015, η2 = 0.143). Animals in the Social Isolation + Hindlimb unloaded condition spent a significantly lower % Time with the Novel Object compared to Group housed animals (mean diff 9.280, 95%CI (1.433 to 17.127), p = 0.015). Males: n = 10 for all groups. *p < 0.05.
Figure 4
Figure 4
Combined stressors induce differences in social exploration. The three chamber social approach task was used to assess sociability and social memory. (a) The main effect of Housing on Time spent with the Mouse during the Sociability phase was F(2,48) = 7.312, p = 0.002, η2 =  0.234. SI mice spent significantly more time (s) with the social mouse than did Group (mean diff 20.966, 95%CI (7.005 to 34.926), p = 0.002) or SI + HU housed mice (mean diff 14.090, 95%CI (0.348 to 27.831), p = 0.043). (b) The main effect of Housing on Total Time spent with the Mouse + Cage was F(2,48) = 10.052, p < 0.001, η2 = 0.295. SI mice spent more total time than Group (mean diff 25.475, 95%CI(11.202 to 39.711), p < 0.001) or SI + HU housed mice (mean diff 15.444, 95%CI(1.412 to 29.476), p = 0.026). (c) The main effect of GCR on Time spent with the Familiar Mouse during the Social Memory phase was F(1,45) = 7.378, p = 0.009, η2 = 0.141. 50 cGy irradiated mice spent significantly less time with the Familiar mouse than did 0 cGy control mice (mean diff − 8.581, 95%CI (− 14.944 to − 2.218), p = 0.009). (d) The main effect of GCR on total time spent with mice was F(1,45) = 6.024, p = 0.018, η2 = 0.118. 50 cGy irradiated mice spent less total time than 0 cGy control mice (mean diff − 15.698, 95%CI (− 28.579 to − 2.816), p = 0.018). (SI = Social Isolation, HU = Hindlimb Unloading) Sociability Males: N = 9 for all groups except Group 0 cGy (n = 8) and SI 0 cGy (n = 10). Four animals were removed because due to errors in the task, and one because %Time with Mouse exceeded the 85% threshold. Social Memory Males: n = 10 for Group 50 cGy and SI 0 cGy, n = 9 for SI 50 cGy, n = 8 for SI + HU 0 cGy and SI + HU 50 cGy, and n = 6 for Group 0 cGy. Eight animals were removed due to errors in the task. One animal was removed due to %Time Novel Mouse exceeding the 85% threshold. *p < 0.05, **p < 0.01, ***p < 0.001.
Figure 5
Figure 5
Combined stressors effects on early and late blood. Blood was collected from tail vein 3 weeks after GCRsim irradiation (a, b, c) and cardiac puncture at euthanasia (d, e, f). Percentages are of CD45 + cells. (a) Males exposed to 50 cGy had higher % monocytes than 0 cGy controls (F (1, 34) = 9.448, p = 0.004, η2 = 0.217) (mean diff 1.921, 95%CΙ (0.651 to 3.190), p = 0.004). (b) There was a main effect of GCRsim on % NK cells (F(1,50) = 4.756, p = 0.034, η2 = 0.087). Males exposed to 50 cGy had a higher % NK cells than controls (mean diff 1.801, 95%CI (0.142 to 3.459), p = 0.034). (c) % B cells trended toward a main effect of housing (F(1,34) = 3.179, p = 0.054, η2 = 0.158) and of GCRsim (F(1,34) = 3.474, p = 0.0709, η2 = 0.093). Males: n = 9 for Group 0 cGy, SI 0 cGy, n = 8 for Group 50 cGy, n = 7 for SI 50 cGy, n = 5 for SI + HU 0 cGy, n = 2 for SI + HU 50 cGy. (d) %Monocytes had a significant main effect of housing, F(2,37) = 6.382, p = 0.004, η2 = 0.256. Group housed mice had higher % Monocyte levels than SI (mean diff. 5.096%, 95%CI (1.411 to 8.780), p = 0.004) and SI + HU housed mice (mean diff. 3.882%, 95%CI (0.252 to 7.512), p = 0.033). (e) % NK cells for males. There were no main effects of housing or GCR. (f) For % B cells, there was a significant main effect of Housing. F(2,49) = 11.251, p < 0.0001, η2 = 0.315. Group housed mice had lower %B cells than SI (mean diff. − 11.203%, 95%CI (− 17.914 to -4.492), p < 0.001) and SI + HU housed mice (mean diff. − 11.287%, 95%CI (− 17.917 to − 4.656), p < 0.001). Males Monocytes and NK cells: n = 8 for SI + HU 0 and 50 cGy, SI 50 cGy, n = 7 for SI 0 cGy and group 50 cGy, n = 5 for group 0 cGy. Males B cells: n = 10 for SI + HU 0 and 50 cGy, SI 50 cGy, n = 9 for SI 0 cGy and group 50 cGy, n = 7 for group 0 cGy. *p < 0.05, **p < 0.01, ***p < 0.001.
Figure 6
Figure 6
Linear PC Scores are modeled by Housing and GCRsim. (a) Loadings for features in the Linear PCA. Scores greater than |0.45| were used for interpretation of the PC. (b) PC1–Social exploration measures and B cells percentage from cardiac blood loaded strongly positively, while monocyte percentage from cardiac blood loaded strongly negatively on PC1. Two-way ANCOVA analysis had the best model fit for PC1. There was a significant main effect of housing (F(2,33) = (5.816, p = 0.007, η2 = 0.261) and GCRsim (F(1,33) = 6.694, p = 0.014, η2 = 0.169) on PC1. SI stress increased PC1 score compared to group housing (mean diff 1.155, 95%CΙ (0.294 to 2.015), p = 0.006). Sham irradiated animals scored higher on PC1 than 50 cGy exposed animals (mean diff 0.967, 95%CI (0.207 to 1.728), p = 0.014). (c) PC3- RAWM average errors and NOR percent time with the novel object loaded strongly positively. Two-way ANCOVA analysis including percent monocytes in early blood as a covariate had the best model fit for PC3. There was a significant interaction between GCRsim and housing condition (F(2,33) = 4.827, p = 0.014, η2 = 0.226). Compared to shams, the 50 cGy exposed mice scored higher in group housing (mean diff 0.906 (95%CI (0.015 to 1.797), p = 0.047) and lower in SI housing (mean diff − 0.948, 95%CI (− 1.890 to − 0.007), p = 0.048). Within all sham exposed animals, SI animals scored higher than both SI + HU (mean diff 2.496, 95%C (1.272 to 3.720), p < 0.001) and group housed animals (mean diff 1.276, 95%C (0.212 to 2.341), p = 0.014). Sham group housed males scored higher than SI + HU animals (mean diff 1.220, 95%C (0.019 to 2.420), p = 0.045). Within all 50 cGy animals, group housed scored higher than SI + HU animals (mean diff 2.180, 95%CΙ (0.482 to 3.878), p = 0.008). Males n = 9 0 cGy group, 0 cGy SI; n = 8 50 cGy group; n = 7 50 cGy SI; n = 5 0 cGy SI + HU; n = 2 50 cGy SI + HU. *p < 0.05 **p < 0.01, ***p < 0.001.

References

    1. Cekanaviciute E, Rosi S, Costes SV. Central nervous system responses to simulated galactic cosmic rays. Int. J. Mol. Sci. 2018 doi: 10.3390/ijms19113669. - DOI - PMC - PubMed
    1. Nelson GA. Space radiation and human exposures, A Primer. Radiat. Res. 2016 doi: 10.1667/RR14311.1. - DOI - PubMed
    1. Krukowski K, et al. Female mice are protected from space radiation-induced maladaptive responses. Brain Behav. Immun. 2018 doi: 10.1016/j.bbi.2018.08.008. - DOI - PMC - PubMed
    1. Krukowski K, et al. The impact of deep space radiation on cognitive performance—from biological sex to biomarkers to countermeasures. Sci. Adv. 2021;7:eabg6702. doi: 10.1126/sciadv.abg6702. - DOI - PMC - PubMed
    1. Garrett-Bakelman FE, et al. The NASA twins study: A multidimensional analysis of a year-long human spaceflight. Science. 2019;364:eaau8650. doi: 10.1126/science.aau8650. - DOI - PMC - PubMed

Publication types