. 2023 Jan 31;11(1):19.
doi: 10.1186/s40168-022-01458-x.

Gut microbiota-derived ursodeoxycholic acid alleviates low birth weight-induced colonic inflammation by enhancing M2 macrophage polarization

Affiliations

Gut microbiota-derived ursodeoxycholic acid alleviates low birth weight-induced colonic inflammation by enhancing M2 macrophage polarization

Yu Pi et al. Microbiome. .

Abstract

Background: Low birth weight (LBW) is associated with intestinal inflammation and dysbiosis after birth. However, the underlying mechanism remains largely unknown.

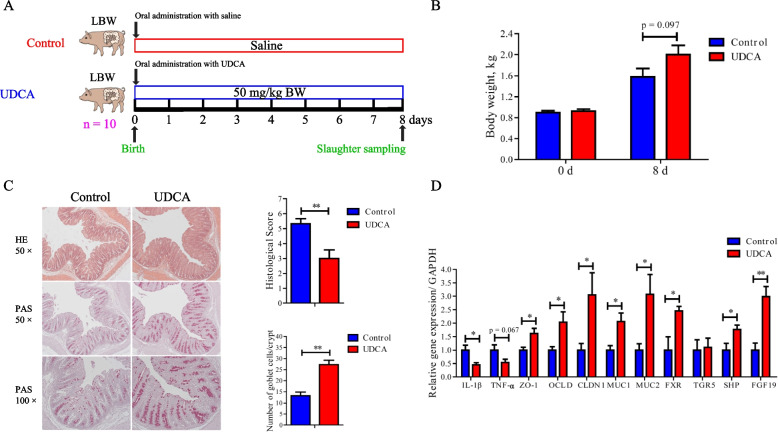
Objective: In the present study, we aimed to investigate the metabolism, therapeutic potential, and mechanisms of action of bile acids (BAs) in LBW-induced intestinal inflammation in a piglet model.

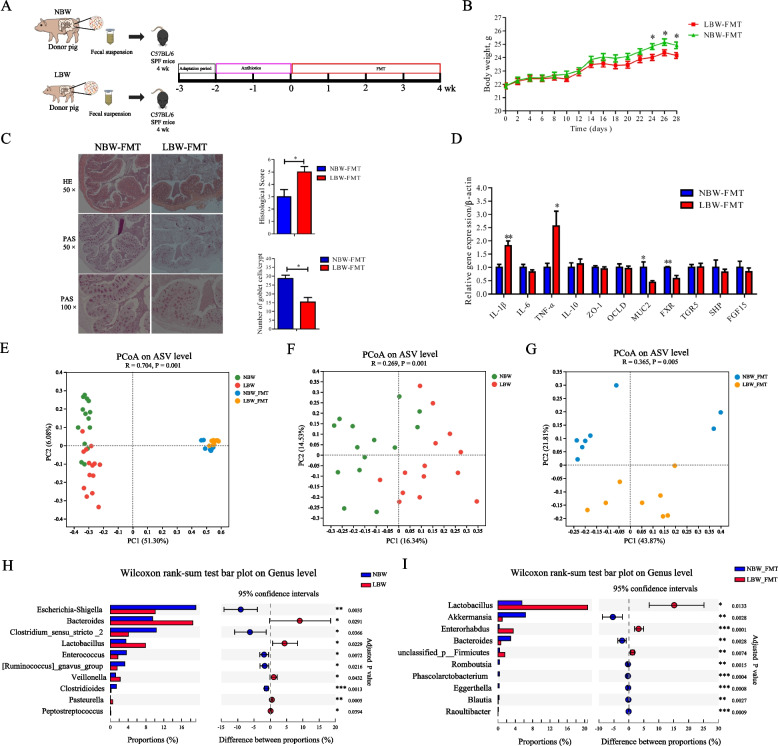
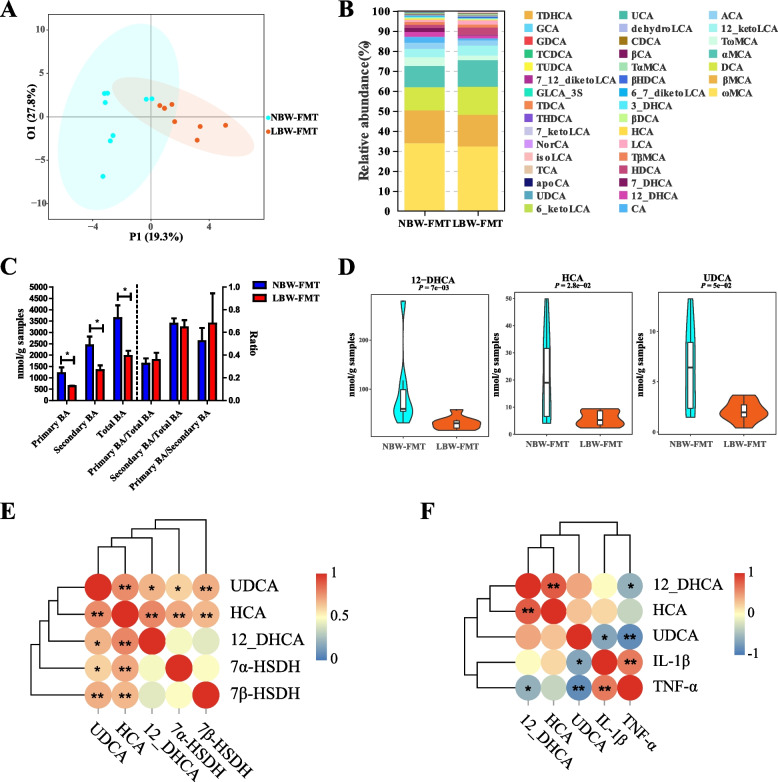
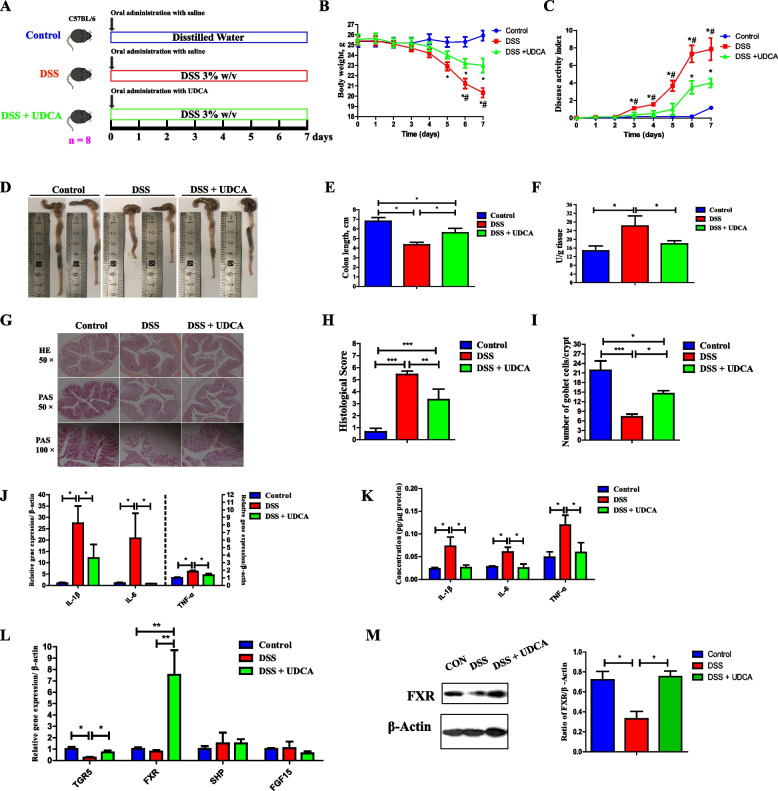
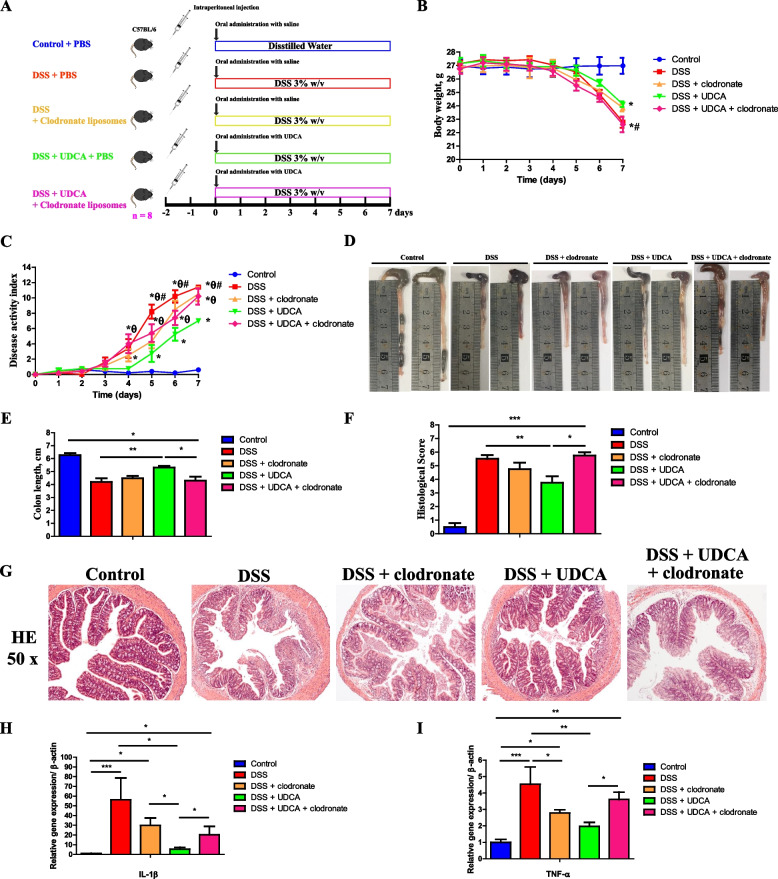
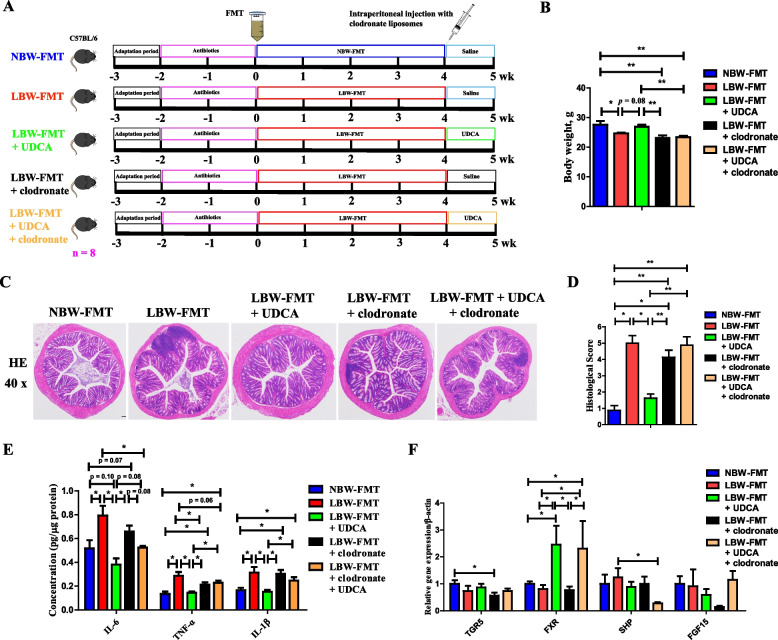
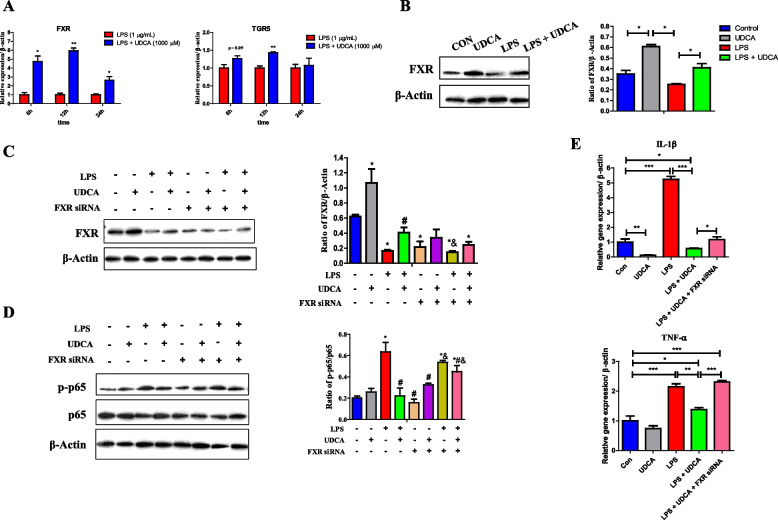
Methods: The fecal microbiome and BA profile between LBW and normal birth weight (NBW) neonatal piglets were compared. Fecal microbiota transplantation (FMT) was employed to further confirm the linkage between microbial BA metabolism and intestinal inflammation. The therapeutic potential of ursodeoxycholic acid (UDCA), a highly differentially abundant BA between LBW and NBW piglets, in alleviating colonic inflammation was evaluated in both LBW piglets, an LBW-FMT mice model, and a DSS-induced colitis mouse model. The underlying cellular and molecular mechanisms by which UDCA suppresses intestinal inflammation were also investigated in both DSS-treated mice and a macrophage cell line. Microbiomes were analyzed by using 16S ribosomal RNA sequencing. Fecal and intestinal BA profiles were measured by using targeted BA metabolomics. Levels of farnesoid X receptor (FXR) were knocked down in J774A.1 cells with small interfering RNAs.

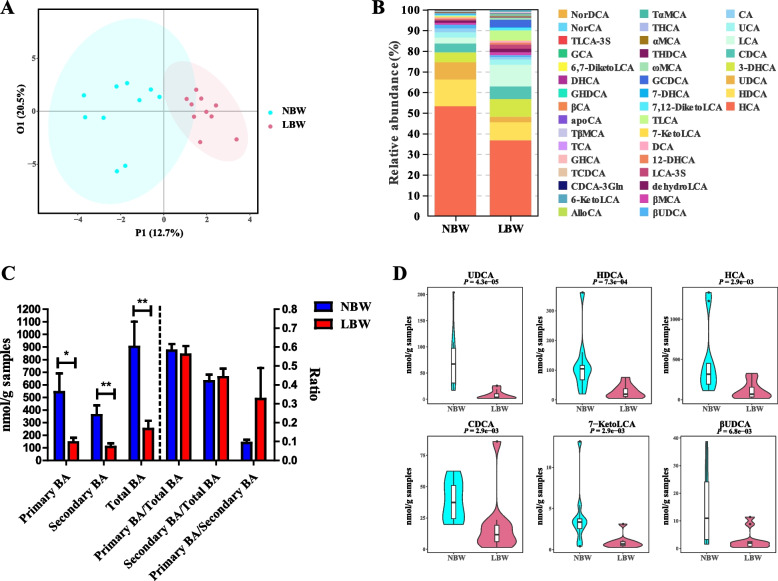
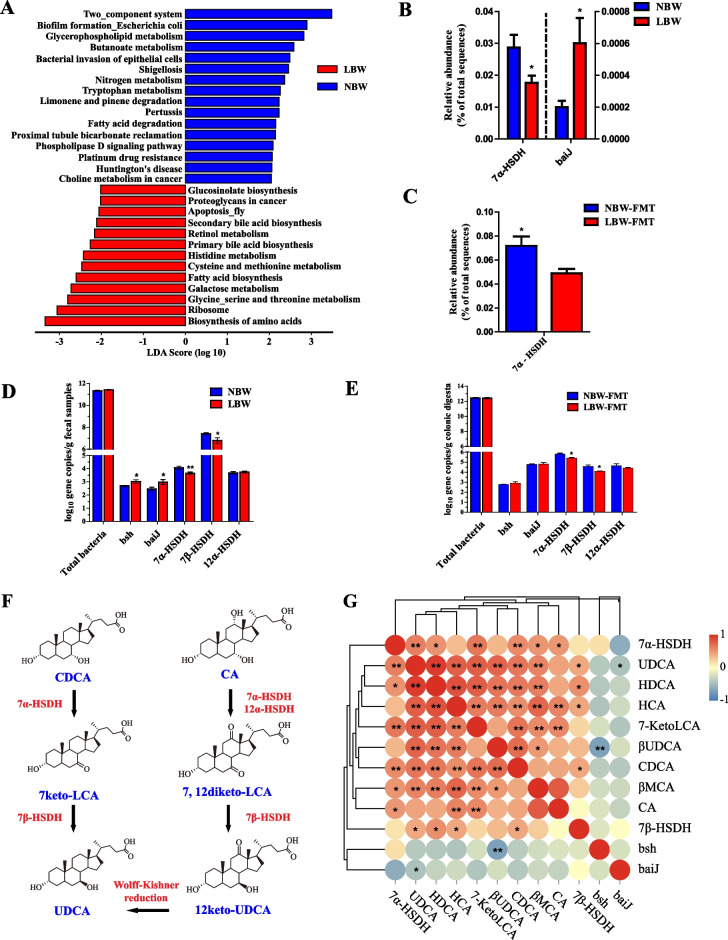
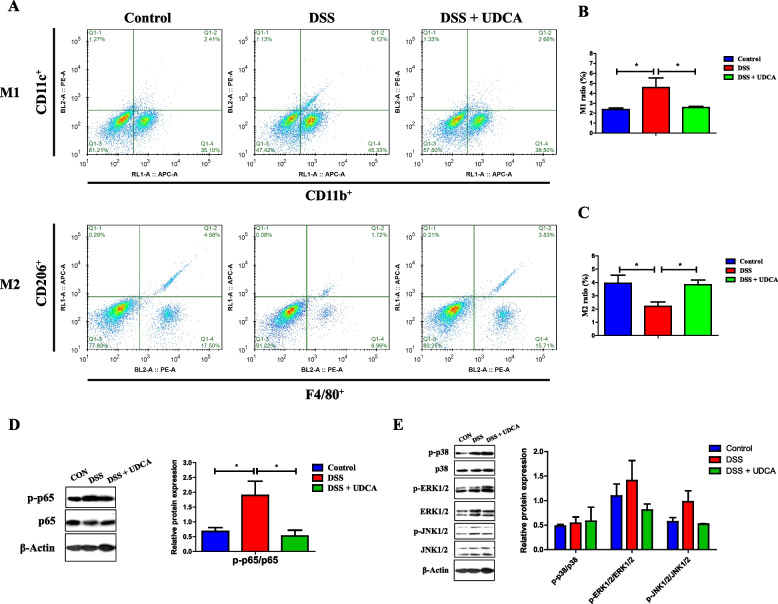
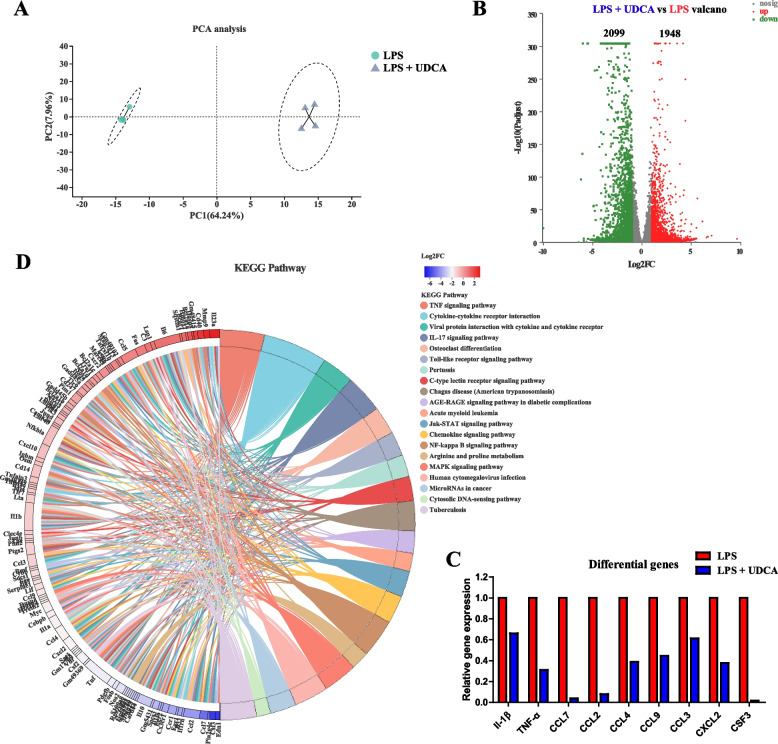
Results: We show a significant difference in both the fecal microbiome and BA profiles between LBW and normal birth weight animals in a piglet model. Transplantation of the microbiota of LBW piglets to antibiotic-treated mice leads to intestinal inflammation. Importantly, oral administration of UDCA, a major BA diminished in the intestinal tract of LBW piglets, markedly alleviates intestinal inflammation in LBW piglets, an LBW-FMT mice model, and a mouse model of colitis by inducing M2 macrophage polarization. Mechanistically, UDCA reduces inflammatory cytokine production by engaging BA receptor FXR while suppressing NF-κB activation in macrophages.

Conclusions: These findings establish a causal relationship between LBW-associated intestinal abnormalities and dysbiosis, suggesting that restoring intestinal health and postnatal maldevelopment of LBW infants may be achieved by targeting intestinal microbiota and BA metabolism. Video Abstract.

Keywords: Bile acids; Immunity; Low birth weight; Macrophage; Microbiome.


Conflict of interest statement

The authors declare that they have no competing interests.

Figures

Fig. 1
Fig. 1
Fecal bile acid (BA) profiles of low birth weight (LBW) and normal birth weight (NBW) piglets 2 days after birth (n = 10). A OPLS-DA score plot of the fecal BA profiles. B Relative abundances of BAs in the feces of NBW and LBW piglets. C The concentration of primary BAs, secondary BAs, total BAs, and the ratio of primary BAs to total BAs, primary BAs to total BAs, and primary BAs to secondary BAs. D Violin plots of the six most differentially abundant fecal BAs. Data are presented as means ± SEM in panels C and D. *P < 0.05, **P < 0.01
Fig. 2
Fig. 2
Effects of fecal microbiota transplantation (FMT) of NBW and LBW piglets to antibiotic-treated mice on gut microbial composition and intestinal health (n = 8). A Schematic outline of the experimental design. B Body weight changes of mice after FMT. C Representative H&E staining (50× magnification), PAS staining (50× and 100× magnification), histology score of the colonic sections, and the number of goblet cells of the mice after FMT. D The mRNA expression levels of genes related to inflammation, barrier function, and bile acid receptors in the colon of mice after FMT. Principal coordinates analysis (PCoA) plot of the microbiomes between the donor piglets and the recipient mice (E), and the fecal microbiomes of LBW and NBW piglets (F) or the colonic microbiomes of mice following FMT (G) based on the Bray-Curtis distance. Differential enrichment of bacterial genera between LBW and NBW groups (H) or between LBW-FMT and NBW-FMT groups (I) based on the Wilcoxon rank-sum test. Data are presented as means ± SEM. *P < 0.05, **P < 0.01. LBW-FMT, mice transplanted with the feces of LBW piglets; NBW-FMT, mice transplanted with the feces of NBW piglets
Fig. 3
Fig. 3
Microbial functional analysis in mice transplanted with the feces of NBW and LBW piglets (n = 8). A LEfSe analysis of the predicted microbial function based on PICRUSt2 between LBW and NBW groups. Differential enrichment of 7α-hydroxysteroid dehydrogenase (7α-HSDH) and BA 7-dehydroxylation (baiJ)-positive bacteria in the feces of LBW and NBW piglets (B) or colonic digesta of LBW-FMT and NBW-FMT mice (C) based on PICRUSt2 functional prediction. Gene copy numbers of baiJ, BA hydrolase (bsh), 7α-HSDH, 7β-HSDH, and 12α-HSDH in feces of LBW and NBW piglets (D) or the colonic digesta of LBW-FMT and NBW-FMT mice (E) based on the qPCR analysis. F The synthesis pathway of UDCA by microbial biotransformation from CA and CDCA. G Spearman correlation between the gene copy numbers of individual BA-metabolizing genes and the concentrations of BAs in feces of LBW and NBW piglets. Data are presented as means ± SEM in panels B, C, D, and E. *P < 0.05, **P < 0.01. LBW-FMT, mice transplanted with the feces of LBW piglets; NBW-FMT, mice transplanted with the feces of NBW piglets
Fig. 4
Fig. 4
Colonic BA profiles of mice transplanted with the feces of LBW or NBW piglets (n = 8). A OPLS-DA score plot of the colonic BA profiles. B Relative abundances of BAs in the colonic digesta of NBW-FMT and LBW-FMT mice. C The concentration of primary BAs, secondary BAs, total BAs, and the ratio of primary BAs to total BAs, primary BAs to total BAs, and primary BAs to secondary BAs. D Violin plots of three differentially abundant colonic BAs. E Spearman correlation between the gene copy numbers of 7α-HSDH and 7β-HSDH and the concentrations of three differentially abundant BAs in the colon. F Spearman correlation between the concentration of BAs and the gene expression of proinflammatory cytokines in the colon. Data are presented as means ± SEM in panels C and D. *P < 0.05, **P < 0.01. LBW-FMT, mice transplanted with the feces of LBW piglets; NBW-FMT, mice transplanted with the feces of NBW piglets
Fig. 5
Fig. 5
Amelioration of DSS-induced acute colitis in mice by oral administration of UDCA (n = 8). A Schematic outline of the experimental design. B Body weight changes of mice after FMT. C Disease activity index score. D Representative images of the colon. E Colon length. F Myeloperoxidase (MPO) concentrations in the colon. G Representative H&E staining (×50 magnification) and PAS staining (×50 and ×100 magnification) of the colonic sections. H Histology score of the colon. I The number of goblet cells. J The mRNA expression levels of inflammatory cytokines in the colon. K The protein levels of inflammatory cytokines in the colon. L The mRNA expression levels of BA receptors in the colon. M The protein levels of FXR in the colon. Data are presented as means ± SEM. *P < 0.05, **P < 0.01, *** P < 0.001; # P < 0.05, relative to the DSS + UDCA group
Fig. 6
Fig. 6
Alleviation of colonic inflammation by oral administration of UDCA in LBW piglets (n = 10). A Schematic outline of the experimental design. B Body weight before and 8 days after UDCA administration. C Representative H&E staining (×50 magnification), PAS staining (×50 and ×100 magnification), histology score of the colonic sections, and the number of goblet cells of LBW piglets receiving UDCA. D The mRNA expression levels of genes related to inflammation, barrier function, and bile acid receptors in the colon of LBW piglets receiving UDCA. Data are presented as means ± SEM. *P < 0.05, **P < 0.01
Fig. 7
Fig. 7
Effect of macrophage depletion on UDCA-mediated alleviation of intestinal inflammation in DSS-treated mice (n = 8). A Schematic outline of the experimental design. B Daily body weight changes. C Disease activity index score. D Representative images of the colon. E Colon length. F Histology score. G Representative H&E staining (×50 magnification) of the colon sections. The mRNA expression levels of two inflammatory cytokines, IL-1β (H) and TNF-α (I), in the colon. Data are presented as means ± SEM. *P < 0.05, **P < 0.01, *** P < 0.001; #P < 0.05, relative to the DSS+UDCA group; θP < 0.05, relative to their respective clodronate treated groups
Fig. 8
Fig. 8
Effect of macrophage depletion on UDCA-mediated alleviation of intestinal inflammation in LBW-FMT mice (n = 8). A Schematic outline of the experimental design. B Body weight changes. C Representative H&E staining (×40 magnification) of the colon sections. D Histology score. E The mRNA expression levels of proinflammatory cytokines (IL-6, TNF-α, and IL-1β) and F bile acid receptors in the colon. Data are presented as means ± SEM. *P < 0.05, **P < 0.01. LBW-FMT, mice transplanted with the feces of LBW piglets; NBW-FMT, mice transplanted with the feces of NBW piglets
Fig. 9
Fig. 9
Effect of UDCA on macrophage polarization and NF-κB inhibition in DSS-treated mice (n = 8). Shown are representative flow cytometry plots (A) as well as the prevalence of M1 macrophages (CD11b+CD11c+) (B) and M2 macrophages (F4/80+CD206+) (C) in the colonic homogenate of DSS-treated mice in response to UDCA. D Decreased phosphorylation of p65 NF-κB in the colon of DSS-treated mice in response to UDCA. E Phosphorylation of p38, ERK1/2, and JNK1/2 in the colon of DSS-treated mice in response to UDCA. Data are presented as means ± SEM. *P < 0.05
Fig. 10.
Fig. 10.
Transcriptional profiling of LPS-treated J774A.1 cells in the presence or absence of UDCA (n = 4). A PCA plot of the transcriptional profiles between the two groups. B Volcano plot of significantly differentially expressed genes between the two groups. The differentially expressed genes included only those showing a > 2-fold difference and FDR < 0.05. C Inhibition of a panel of LPS-induced proinflammatory cytokine and chemokine gene expression in the presence of UDCA. D Differential enrichment of KEGG pathways in LPS-stimulated cells following UDCA treatment
Fig. 11
Fig. 11
Involvement of FXR in UDCA-mediated anti-inflammatory effects in LPS-treated J774A.1 cells (n = 3). Shown are the expressions of FXR and TGR5 mRNA (A) and FXR protein (B) in response to 1 μg/mL LPS with or without 1 mM UDCA. C The FXR expression after FXR siRNA interference. D FXR knockdown on phosphorylation of p65 NF-κB. Data are presented as means ± SEM. *P < 0.05, versus the control group, #P < 0.05, versus LPS, &P < 0.05, versus the LPS+UDCA group. E the mRNA expressions of IL-1β and TNF-α in response to 1 μg/mL LPS, 1 mM UDCA and/or FXR siRNA. Data are presented as means ± SEM. *P < 0.05, **P < 0.01, *** P < 0.001

References

    1. McIntire DD, Bloom SL, Casey BM, Leveno KJ. Birth weight in relation to morbidity and mortality among newborn infants. New Engl J Med. 1999;340(16):1234–1238. - PubMed
    1. Zhu YH, Wang W, Yuan TL, Fu LL, Zhou LA, Lin G, Zhao SH, Zhou HJ, Wu GY, Wang JJ. MicroRNA-29a mediates the impairment of intestinal epithelial integrity induced by intrauterine growth restriction in pig. Am J Physiol-Gastr L. 2017;312(5):G434–G442. - PubMed
    1. Wu G, Bazer FW, Wallace JM, Spencer TE. Board-invited review: intrauterine growth retardation: implications for the animal sciences. J Anim Sci. 2006;84(9):2316–2337. - PubMed
    1. Jain V, Singhal A. Catch up growth in low birth weight infants: striking a healthy balance. Rev Endocr Metab Disord. 2012;13(2):141–147. - PubMed
    1. Guilloteau P, Zabielski R, Hammon HM, Metges CC. Nutritional programming of gastrointestinal tract development. Is the pig a good model for man? Nutr Res Rev. 2010;23(1):4–22. - PubMed

Publication types

Substances