. 2023 Apr 7;44(14):1265-1279.
doi: 10.1093/eurheartj/ehad044.

Purine synthesis suppression reduces the development and progression of pulmonary hypertension in rodent models

Affiliations

Purine synthesis suppression reduces the development and progression of pulmonary hypertension in rodent models

Qian Ma et al. Eur Heart J. .

Abstract

Aims: Proliferation of vascular smooth muscle cells (VSMCs) is a hallmark of pulmonary hypertension (PH). Proliferative cells utilize purine bases from the de novo purine synthesis (DNPS) pathways for nucleotide synthesis; however, it is unclear whether DNPS plays a critical role in VSMC proliferation during development of PH. The last two steps of DNPS are catalysed by the enzyme 5-aminoimidazole-4-carboxamide ribonucleotide formyltransferase/inosine monophosphate cyclohydrolase (ATIC). This study investigated whether ATIC-driven DNPS affects the proliferation of pulmonary artery smooth muscle cells (PASMCs) and the development of PH.

Methods and results: Metabolites of DNPS in proliferative PASMCs were measured by liquid chromatography-tandem mass spectrometry. ATIC expression was assessed in platelet-derived growth factor-treated PASMCs and in the lungs of PH rodents and patients with pulmonary arterial hypertension. Mice with global and VSMC-specific knockout of Atic were utilized to investigate the role of ATIC in both hypoxia- and lung interleukin-6/hypoxia-induced murine PH. ATIC-mediated DNPS at the mRNA, protein, and enzymatic activity levels were increased in platelet-derived growth factor-treated PASMCs or PASMCs from PH rodents and patients with pulmonary arterial hypertension. In cultured PASMCs, ATIC knockdown decreased DNPS and nucleic acid DNA/RNA synthesis, and reduced cell proliferation. Global or VSMC-specific knockout of Atic attenuated vascular remodelling and inhibited the development and progression of both hypoxia- and lung IL-6/hypoxia-induced PH in mice.

Conclusion: Targeting ATIC-mediated DNPS compromises the availability of purine nucleotides for incorporation into DNA/RNA, reducing PASMC proliferation and pulmonary vascular remodelling and ameliorating the development and progression of PH.

Keywords: De novo purine synthesis; ATIC; Pulmonary hypertension; Vascular smooth muscle cells.


Conflict of interest statement

Conflict of interest statement All authors declare no conflict of interest for this contribution.

Figures

Structured Graphical Abstract
Left panel: For vascular smooth muscle cells (VSMCs) of normal pulmonary artery, low levels of growth signals result in a low level of de novo purine synthesis and RNA and DNA production, maintaining haemostasis of VSMCs. Right panel: For VSMCs of pulmonary artery of pulmonary hypertension (PH), high levels of growth signals give rise to increased expression of purine-associated genes including ATIC, enhanced de novo purine synthesis and RNA and DNA production, promoting VSMC proliferation, and thickness of the pulmonary arterial wall. AMP, adenosine monophosphate; ATIC, 5-aminoimidazole-4-carboxamide ribonucleotide formyltransferase/inosine monophosphate cyclohydrolase; GMP, guanosine monophosphate; IMP, inosine monophosphate.
Figure 1
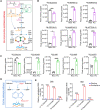
Figure 1
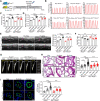
Increased de novo purine synthesis in PASMCs of pulmonary hypertension patients. (A) Schematic of the purine synthetic pathway and associated enzymes and metabolites. (B) Heat map showing the fold change of mRNA levels of purine synthesis-associated genes in the lungs of control and PAH patients (n = 11 for control, n = 15 for PAH). (C) Heat map displaying mRNA levels of purine synthesis-associated and proliferative genes in the PASMCs of control and IPAH patients (n = 4). (D) Western blots showing ATIC expression in the lungs of control and PAH patients. (E and F) Representative ATIC immunofluorescent staining and quantification on PASMCs of control and IPAH patients (n = 6–7). Data are represented as mean ± SEM, **P < 0.01 for indicated comparisons. Statistical significance was determined by unpaired two-tailed Student’s t-test.
Figure 2
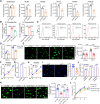
Figure 2
Enhanced de novo purine metabolism in proliferative PASMCs. (A) Schematic showing the strategy of isotope-labelled glutamine, glycine, and formate incorporated into purine metabolites. (B) Normalized peak areas of 15N-labelled purine metabolites, as measured by targeted LC-MS/MS, in resting and proliferative PASMCs labelled with 4 mM 15N-amide-glutamine for 4 h (n = 3). (C) Normalized peak areas of 13C-labelled purine metabolites, as measured by targeted LC-MS/MS, in resting and proliferative PASMCs labelled with 1 mM 13C2-glycine for 4 h (n = 3). (D) Schematic showing the strategy of radioisotope-labelled hypoxanthine incorporated into nucleic acids. (E) Relative incorporation of 14C from glycine and formate, and relative incorporation of 3H from hypoxanthine into DNA and RNA in resting and proliferative PASMCs labelled with 2 μCi U-14C-glycine, 14C-formate, and 3H-hypoxanthine for 12 h, respectively (n = 3). Data are represented as mean ± SEM; ns, no significance; *P < 0.05, **P < 0.01, and ***P < 0.001 for indicated comparisons. Statistical significance was determined by unpaired two-tailed Student’s t-test.
Figure 3
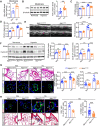
Figure 3
Decreased de novo purine metabolism-mediated nucleotide synthesis and proliferation in ATIC knockdown PASMCs. (A) Normalized peak areas of 15N-labelled purine metabolites, as measured by targeted LC-MS/MS, in proliferative PASMCs transfected with control or ATIC siRNA and labelled with 4 mM 15N-amide-glutamine for 4 h (n = 3). (B) Relative incorporation of 14C from formate into DNA and RNA in resting and proliferative PASMCs transfected with control or ATIC siRNA and labelled with 2 μCi U-14C-glycine for 12 h (n = 6). (C and D) Representative images and quantification of flow cytometry analysis showing EdU incorporation in PASMCs transfected with control or ATIC siRNA for 48 h and treated with vehicle or PDGF (20 ng/mL) for 18 h (n = 3–6). (E) Representative images and quantification of 5-EU staining showing newly synthesized RNA synthesis in PASMCs transfected with control or ATIC siRNA for 48 h and treated with vehicle or PDGF (20 ng/mL) for 12 h (n = 5). (F) Growth curves of PASMCs transfected with control or ATIC siRNA for the indicated times (n = 6). (G) WST-1 cell proliferation assay of PASMCs transfected with control or ATIC siRNA for 72 h (n = 9). (H) Growth curves of AticWT and AticKO mPASMCs cultured for the indicated times (n = 6). (I) Representative EdU staining and the percentage of EdU-positive AticWT and AticKO mPASMCs (n = 8). (J) WST-1 cell proliferation assay of AticWT and AticKO mPASMCs (n = 10). (K) Representative images and quantification of 5-EU staining showing new RNA synthesis in PASMCs transfected with control or ATIC siRNA for 48 h and treated with PDGF (20 ng/mL) and supplemented with adenine (20 μM) or hypoxanthine (100 μM) for 12 h (n = 5). (L) Growth curves of PASMCs transfected with control or ATIC siRNA and treated with adenine (20 μM) or hypoxanthine (100 μM) for the indicated times (n = 6). Data are represented as mean ± SEM; ns, no significance; *P < 0.05, **P < 0.01, and ***P < 0.001 for indicated comparisons. Statistical significance was determined by unpaired two-tailed Student’s t-test (A and F–J), one-way analysis of variance with Bonferroni’s test (B, D, E, and K) and two-way analysis of variance with Bonferroni’s test (L).
Figure 4
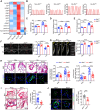
Figure 4
The effect of VSMC-specific deletion of Atic on the development of hypoxia-induced PH. (A) qRT–PCR assays showing fold change of Atic mRNA levels in the lungs of normoxic and hypoxic mice (n = 4–6). (B) Representative western blots and quantification showing ATIC expression in the lungs of normoxic and hypoxic mice (n = 7–9). (C–E) Representative images or quantification of RVSP (C), RV/(LV + septum) (D), and RV thickness (E) of Myh11Cre/ERT2 and AticiΔVSMC mice under normoxic or hypoxic (10% O2) conditions for 4 weeks (n = 5 for normoxia, n = 8 for hypoxia). (F) Western blot analysis and densitometric quantification of PCNA and Cyclin D1 protein levels in lung homogenates of Myh11Cre/ERT2 and AticiΔVSMC mice exposed to normoxia or hypoxia (10% O2) for 4 weeks (n = 5 for normoxia, n = 7 for hypoxia). (G) (Left) Representative images of HE staining and ACTA2 immunostaining of the distal pulmonary arteries in Myh11Cre/ERT2 and AticiΔVSMC mice; (Right) Quantification of the ratio of vessel wall area to total vessel area and ACTA2 immunostaining-positive area (n = 5). (H) Representative images and quantification of EdU and Masson’s Trichrome staining of the distal pulmonary arteries in Myh11Cre/ERT2 and AticiΔVSMC mice exposed to normoxia and hypoxia condition (n = 4–7). Data are represented as mean ± SEM; ns, no significance; **P < 0.01 and ***P < 0.001 for indicated comparisons. Statistical significance was determined by unpaired two-tailed Student’s t-test (A, B, and H) and one-way analysis of variance with Bonferroni test (C–G).
Figure 5
Figure 5
The effect of global Atic deficiency in mice on the development of hypoxia-induced PH. (A) Heat map displaying normalized peak area of purine intermediates, as measured by LC-MS/MS, in pulmonary arteries of AticWT and AticiKO mice exposed to normoxia and hypoxia condition for 3 weeks (n = 4). (B–G) Representative images and quantification of RVSP (B and C), RV/(LV + septum) (D), RV thickness (E), TAPSE (F), and PAT/PET ratio (G) of AticWT and AticiKO mice under normoxic or hypoxic (10% O2) conditions for 4 weeks (n = 5 for normoxia, n = 9–10 for hypoxia). (H) (Left) Representative images of H&E staining and ACTA2 immunostaining of the distal pulmonary arteries in AticWT and AticiKO mice exposed to normoxia or hypoxia (10% O2) for 4 weeks; (Right) Quantification of the ratio of vessel wall area to total vessel area and ACTA2 immunostaining-positive area (n = 5 for normoxia, n = 6–7 for hypoxia). (I and J) Representative images and quantification of EdU (I) and Masson’s Trichrome (J) staining of the distal pulmonary arteries of AticWT and AticiKO mice exposed to normoxia and hypoxia condition for 4 weeks (n = 4–7). Data are represented as mean ± SEM; ns, no significance; ***P < 0.001 for indicated comparisons. Statistical significance was determined by unpaired two-tailed Student’s t-test (I and J) and one-way analysis of variance with Bonferroni’s test (C–H).
Figure 6
Figure 6
The effect of global Atic deficiency on hypoxia/IL-6 induced PH in mice. (A) Schematic of the recombinant AAV6.2FF genome encoding the human IL6 gene. ITR, inverted terminal repeat; CMVenh, human cytomegalovirus immediate early gene enhancer region; b-actin prom, chicken beta-actin promoter; SD, splice donor; SA, splice acceptor; UBCenh, human ubiquitin C promoter; WPRE, woodchuck hepatitis virus posttranscriptional regulatory element; pA, simian virus 40 polyadenylation signal. (B) Schematic of the timing of tamoxifen treatment and recipient mice, AAV virus instillation, and hypoxia exposure. (C) Representative images and quantification of RVSP of AticWT and AticiKO mice injected with AAV-GFP or AAV-IL6 under normoxic or hypoxic (10% O2) conditions for 3 weeks (n = 5–7). (D) Representative images of HE staining of the distal pulmonary arteries and quantification of the ratio of vessel wall area to total vessel area in AticWT and AticiKO mice injected with AAV-GFP or AAV-IL6 under normoxic or hypoxic (10% O2) conditions for 3 weeks (n = 5–7). Data are represented as mean ± SEM; ns, not significant; ***P < 0.001 for indicated comparisons. Statistical significance was determined by one-way analysis of variance with the Bonferroni test.
Figure 7
Figure 7
The effect of global Atic deficiency on the progression of hypoxia-induced PH. (A) Schematic timeline of tamoxifen treatment and hypoxia (10% O2) exposure. Inducible Atic-deficient mice (AticF/F;Rosa26Cre/ERT2) and control mice (Rosa26Cre/ERT2) were exposed to chronic hypoxia (10% O2) for 2 weeks, followed by 75 mg/kg of tamoxifen injection for 5 days under hypoxia conditions. Mice were continuously exposed to hypoxia for 2 weeks before assessment. (B–G) Representative images (B) and quantification of RVSP (C), RV/(LV + septum) (D), RV thickness (E), and PAT/PET ratio (F and G) of Rosa26Cre/ERT2 and AticF/F;Rosa26Cre/ERT2 mice under normoxic or hypoxic (10% O2) conditions for indicated times (n = 5 for normoxia and hypoxia-2 weeks, n = 7–8 for hypoxia-4 weeks). (H) Representative images of HE staining of the distal pulmonary arteries and quantification of the ratio of vessel wall area to total vessel area in Rosa26Cre/ERT2 and AticF/F;Rosa26Cre/ERT2 mice (n = 5 for normoxia and hypoxia-2 weeks, n = 8 for hypoxia-4 weeks). (I) Representative images and quantification of ACTA2 immunostaining of the distal pulmonary arteries in Rosa26Cre/ERT2 and AticF/F;Rosa26Cre/ERT2 mice (n = 5–6). Data are represented as mean ± SEM; ns, no significance; *P < 0.05, **P < 0.01, and ***P < 0.001 for indicated comparisons. Statistical significance was determined by one-way analysis of variance with the Bonferroni test.

Comment in

References

    1. Humbert M, Morrell NW, Archer SL, Stenmark KR, MacLean MR, Lang IM, et al. . Cellular and molecular pathobiology of pulmonary arterial hypertension. J Am Coll Cardiol 2004;43:13S–24S. 10.1016/j.jacc.2004.02.029 - DOI - PubMed
    1. Vonk-Noordegraaf A, Haddad F, Chin KM, Forfia PR, Kawut SM, Lumens J, et al. . Right heart adaptation to pulmonary arterial hypertension: physiology and pathobiology. J Am Coll Cardiol 2013;62:D22–D33. 10.1016/j.jacc.2013.10.027 - DOI - PubMed
    1. Lajoie AC, Lauziere G, Lega JC, Lacasse Y, Martin S, Simard S, et al. . Combination therapy versus monotherapy for pulmonary arterial hypertension: a meta-analysis. Lancet Respir Med 2016;4:291–305. 10.1016/S2213-2600(16)00027-8 - DOI - PubMed
    1. Ali ES, Sahu U, Villa E, O’Hara BP, Gao P, Beaudet C, et al. . ERK2 Phosphorylates PFAS to mediate posttranslational control of de novo purine synthesis. Mol Cell 2020;78:1178–1191.e1176. 10.1016/j.molcel.2020.05.001 - DOI - PMC - PubMed
    1. Boucherat O, Vitry G, Trinh I, Paulin R, Provencher S, Bonnet S. The cancer theory of pulmonary arterial hypertension. Pulm Circ 2017;7:285–299. 10.1177/2045893217701438 - DOI - PMC - PubMed

Publication types