. 2023 Jul 3;146(7):2828-2845.
doi: 10.1093/brain/awad016.

The Interictal Suppression Hypothesis in focal epilepsy: network-level supporting evidence

Affiliations

The Interictal Suppression Hypothesis in focal epilepsy: network-level supporting evidence

Graham W Johnson et al. Brain. .

Abstract

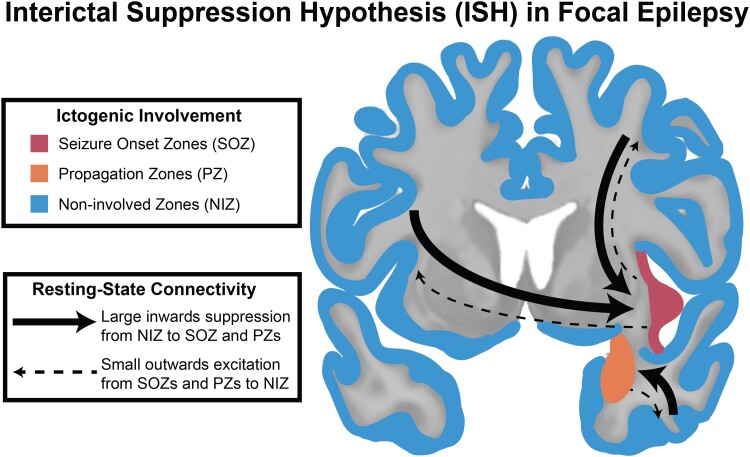
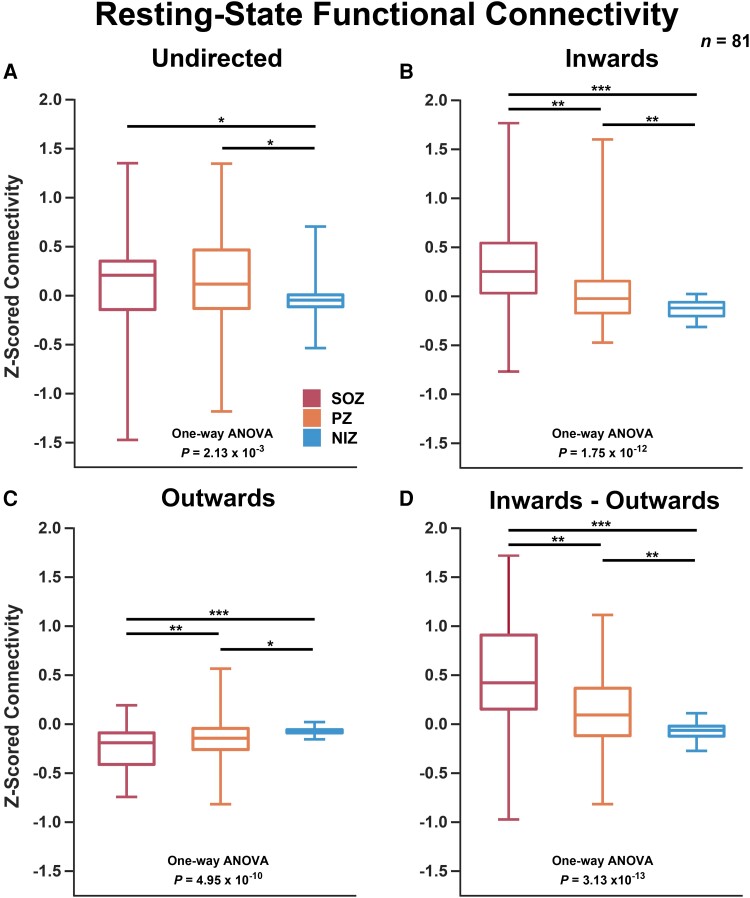
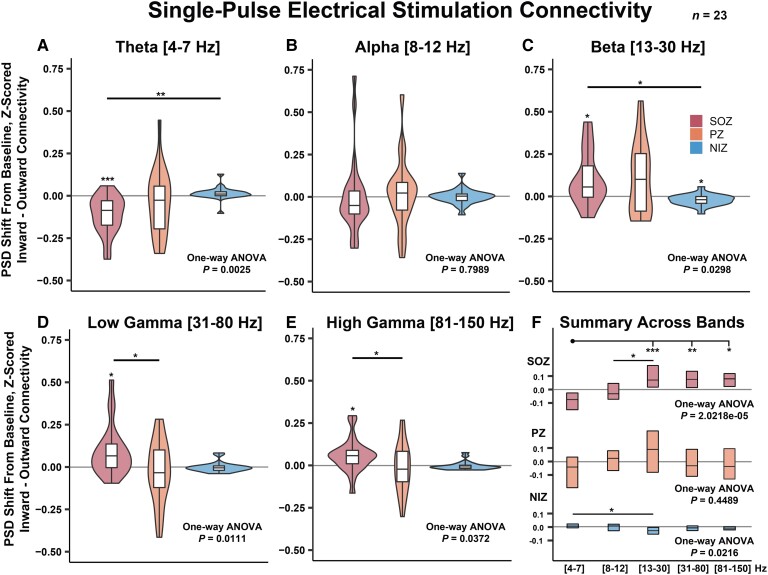
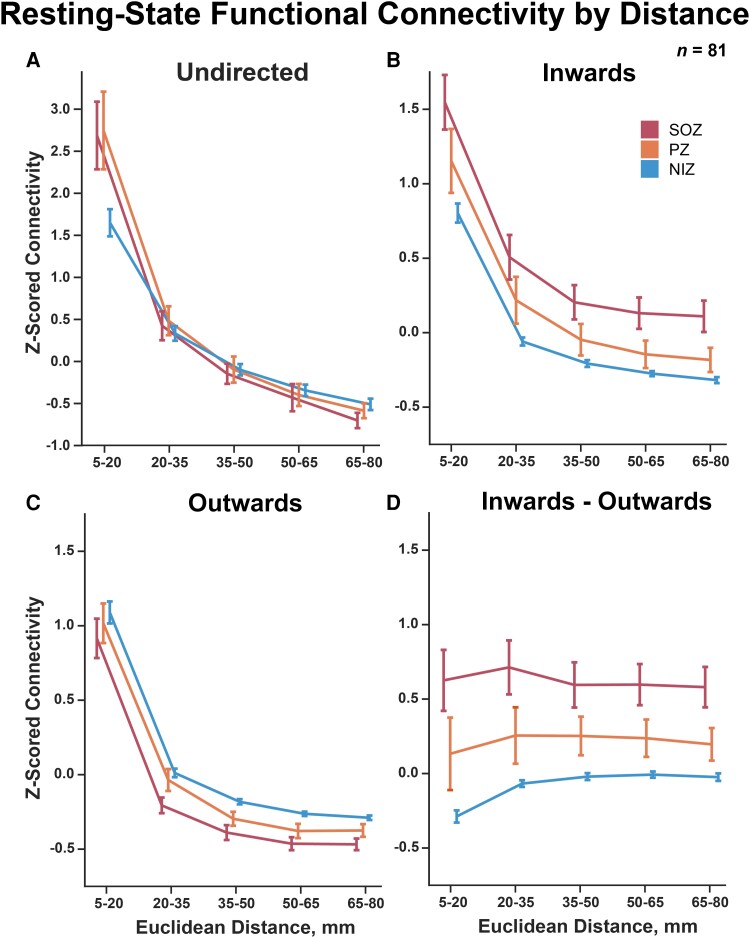
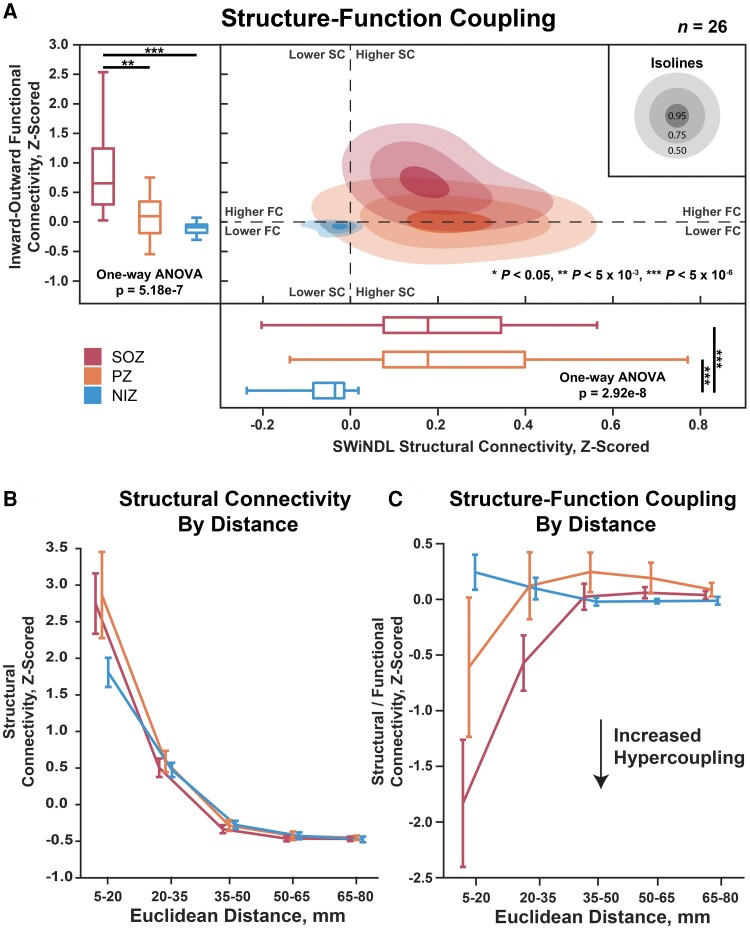
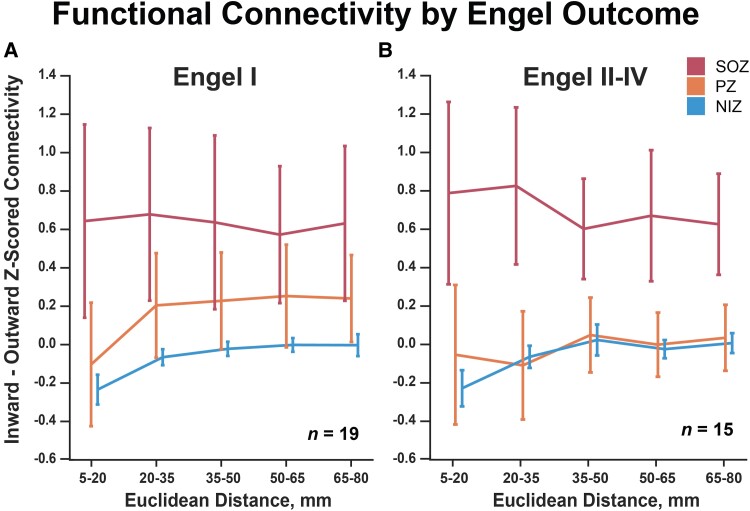
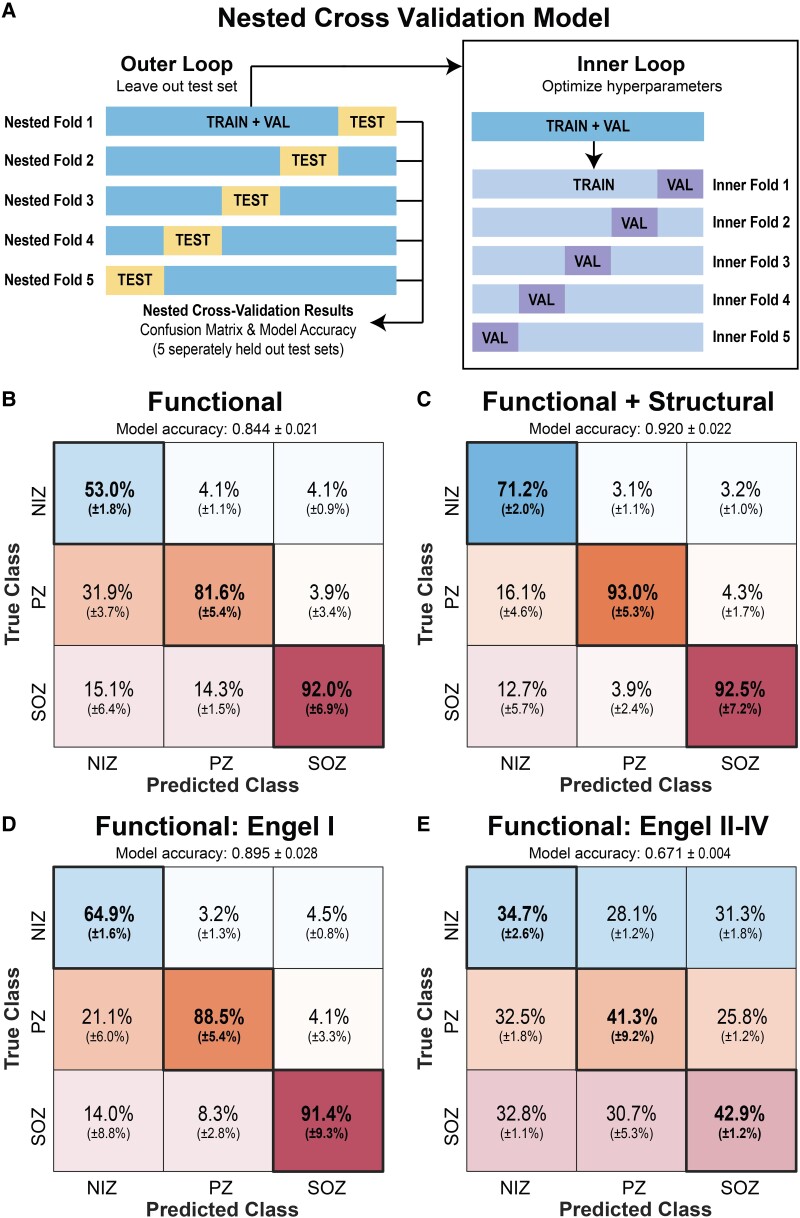
Why are people with focal epilepsy not continuously having seizures? Previous neuronal signalling work has implicated gamma-aminobutyric acid balance as integral to seizure generation and termination, but is a high-level distributed brain network involved in suppressing seizures? Recent intracranial electrographic evidence has suggested that seizure-onset zones have increased inward connectivity that could be associated with interictal suppression of seizure activity. Accordingly, we hypothesize that seizure-onset zones are actively suppressed by the rest of the brain network during interictal states. Full testing of this hypothesis would require collaboration across multiple domains of neuroscience. We focused on partially testing this hypothesis at the electrographic network level within 81 individuals with drug-resistant focal epilepsy undergoing presurgical evaluation. We used intracranial electrographic resting-state and neurostimulation recordings to evaluate the network connectivity of seizure onset, early propagation and non-involved zones. We then used diffusion imaging to acquire estimates of white-matter connectivity to evaluate structure-function coupling effects on connectivity findings. Finally, we generated a resting-state classification model to assist clinicians in detecting seizure-onset and propagation zones without the need for multiple ictal recordings. Our findings indicate that seizure onset and early propagation zones demonstrate markedly increased inwards connectivity and decreased outwards connectivity using both resting-state (one-way ANOVA, P-value = 3.13 × 10⁻¹³) and neurostimulation analyses to evaluate evoked responses (one-way ANOVA, P-value = 2.5 × 10⁻³). When controlling for the distance between regions, the difference between inwards and outwards connectivity remained stable up to 80 mm between brain connections (two-way repeated measures ANOVA, group effect P-value of 2.6 × 10⁻¹²). Structure-function coupling analyses revealed that seizure-onset zones exhibit abnormally enhanced coupling (hypercoupling) of surrounding regions compared to presumably healthy tissue (two-way repeated measures ANOVA, interaction effect P-value of 9.76 × 10⁻²¹). Using these observations, our support vector classification models achieved a maximum held-out testing set accuracy of 92.0 ± 2.2% to classify early propagation and seizure-onset zones. These results suggest that seizure-onset zones are actively segregated and suppressed by a widespread brain network. Furthermore, this electrographically observed functional suppression is disproportionate to any observed structural connectivity alterations of the seizure-onset zones. These findings have implications for the identification of seizure-onset zones using only brief electrographic recordings to reduce patient morbidity and augment the presurgical evaluation of drug-resistant epilepsy. Further testing of the interictal suppression hypothesis can provide insight into potential new resective, ablative and neuromodulation approaches to improve surgical success rates in those suffering from drug-resistant focal epilepsy.

Keywords: EEG; connectivity; diffusion imaging; epilepsy; inhibition excitation.


Conflict of interest statement

The authors report no competing interests.

Figures

Figure 1
Figure 1
ISH in focal epilepsy. The ISH proposes that regions not involved in ictogenesis (NIZ, blue) have an active role in suppressing SOZ and early PZ through brain network interactions that can be observed electrographically.
Figure 2
Figure 2
Resting-state SEEG connectivity. (A) Undirected alpha-band ImCoh was elevated for SOZs and PZs (one-way ANOVA P = 2.13 × 10⁻³ with post hoc multiple pairwise t-test comparisons significant for SOZ-NIZ and PZ-NIZ. (B) Inwards PDC strength was elevated significantly for SOZs and PZs (one-way ANOVA P = 1.75 × 10⁻¹² with post hoc multiple pairwise t-test comparisons significant between all three groups. (C) Outwards PDC strength was significantly lower for SOZs and PZs (one-way ANOVA P = 4.95 × 10⁻¹⁰ with post hoc multiple pairwise t-test comparisons significant between all three groups. (D) Inwards—outwards (reciprocal) connectivity exhibited a stronger signal to that of inwards or outwards separately (one-way ANOVA P = 3.13 × 10⁻¹³ with post hoc multiple pairwise t-test comparisons significant between all three groups). Box represents first quartile, mean and third quartile. Whiskers represent maximum and minimum. *P < 5 × 10⁻², **P < 5 × 10⁻³, ***P < 5 × 10⁻⁶. n = 81 subjects.
Figure 3
Figure 3
SPES connectivity. Frequency-band specific low-frequency stimulation-induced change in PSD from prestimulation baseline. (A) SOZ theta power is reduced when non-SOZ SEEG contacts are stimulated. (B) Alpha-band power was not observed to be significantly altered during stimulation. (CE) Beta, low-gamma and high-gamma band power in SOZs were elevated when non-SOZs were stimulated. (F) The inner quartiles are shown from plots AE and separate one-way ANOVAs were conducted for each SOZ, PZ and NIZ separately. *P < 5 × 10⁻², **P < 5 × 10⁻³, ***P < 5 × 10⁻⁶. n = 23 subjects.
Figure 4
Figure 4
SEEG resting-state connectivity over Euclidean distance. (AC) Undirected and directed connectivity declined rapidly with increasing network edge Euclidean distance thresholds (two-way repeated measures ANOVA distance effect P-value < 1 × 10⁻¹⁰ for undirected inwards and outwards connectivity). (D) Reciprocal connectivity (inwards–outwards PDC strength) demonstrates a consistent relationship spanning all distance thresholds measured (two-way repeated measures ANOVA group effect P-value = 2.6 × 10⁻¹², interaction P-value = 1.15 × 10⁻⁶). Error bars represent 95% confidence intervals of the mean.
Figure 5
Figure 5
Structurefunction coupling over Euclidean distance. (A) The left boxplots show the functional connectivity (PDC inwards strength minus outwards strength) of SOZ, PZ and NIZ. The bottom boxplots show structural connectivity as measured by SWiNDL. The contours in the middle show the 2D distribution of the scatterplot of functional versus structural connectivity. (B) Structural connectivity over Euclidean edge distance. Error bars represent 95% confidence intervals. Repeated measures two-way ANOVA: SOZ/PZ/NIZ effect P = 7.52 × 10⁻³, distance effect P = 1.75 × 10−64, interaction effect P = 5.44 × 10⁻⁹. (C) Structural–functional connectivity over Euclidean edge distance. Repeated measures two-way ANOVA: SOZ/PZ/NIZ effect P = 7.27 × 10⁻⁴, distance effect P = 8.63 × 10⁻¹⁹, interaction effect P = 9.76 × 10⁻²¹. Post-ANOVA multiple comparison: **P < 5 × 10⁻³, ***P < 5 × 10⁻⁶. n = 26 patients.
Figure 6
Figure 6
Functional connectivity by Engel outcome. (A) SOZ, PZ and NIZ connectivity for subjects with Engel 1 outcomes (two-way repeated measures ANOVA group effect P = 1.16 × 10⁻², distance effect P = 1.26 × 10⁻², interaction P = 5.15 × 10⁻²). (B) PZs exhibit lower connectivity in subjects with Engel II–IV outcomes (two-way repeated measures ANOVA group effect P = 1.73 × 10⁻⁴, distance effect P = 7.83 × 10⁻¹, interaction P = 3.01 × 10⁻³). Error bars represent 95% confidence intervals of the mean.
Figure 7
Figure 7
Classification of SOZ, PZ and NIZs using an SVM. (A) A 5-fold nested cross-validation scheme was used to evaluate the SVM’s ability to classify SOZ versus PZ versus NIZ. A completely withheld testing set delineated at the patient level was used for each model evaluation. (B) Confusion matrix when only functional connectivity was used to generate the model. Overall held-out test set accuracy of 84.4 ± 2.1% (mean ± SD). Confusion matrix percentages are normalized by column—i.e. each confusion matrix entry can be interpreted as ‘If the model predicts this SEEG contact is a [SOZ/PZ/NIZ], then there is an X% chance it truly is’. (C) Confusion matrix for a model using functional and structural connectivity with overall held-out test set accuracy of 0.920 ± 2.2%. (D) Confusion matrix for a model generated with only Engel I subjects with overall held-out test set accuracy of 89.5 ± 2.8% (E) Confusion matrix for Engel II–IV subjects tested with the model generated from Engel I subjects (i.e. model ‘D’) with overall held-out test set accuracy of 67.1 ± 0.4%.

Comment in

References

    1. Behr C, Goltzene MA, Kosmalski G, Hirsch E, Ryvlin P. Epidemiology of epilepsy. Rev Neurol (Paris). 2016;172:27–36. - PubMed
    1. Engel J Jr. What can we do for people with drug-resistant epilepsy? The 2016 Wartenberg Lecture. Neurology. 2016;87:2483–2489. - PMC - PubMed
    1. Englot DJ, Chang EF. Rates and predictors of seizure freedom in resective epilepsy surgery: An update. Neurosurg Rev. 2014;37:389–405; discussion 404-5. - PMC - PubMed
    1. Engel J, McDermott MP, Wiebe S, et al. Early surgical therapy for drug-resistant temporal lobe epilepsy: A randomized trial. Multicenter study randomized controlled trial research support, N.I.H., extramural. JAMA. 2012;307:922–930. - PMC - PubMed
    1. Wu C, Jermakowicz WJ, Chakravorti S, et al. Effects of surgical targeting in laser interstitial thermal therapy for mesial temporal lobe epilepsy: A multicenter study of 234 patients. Epilepsia. 2019;60:1171–1183. - PMC - PubMed

Publication types