. 2023 Feb 1;108(2):568-580.
doi: 10.3324/haematol.2022.281339.

All-trans retinoic acid works synergistically with the γ-secretase inhibitor crenigacestat to augment BCMA on multiple myeloma and the efficacy of BCMA-CAR T cells

Affiliations

All-trans retinoic acid works synergistically with the γ-secretase inhibitor crenigacestat to augment BCMA on multiple myeloma and the efficacy of BCMA-CAR T cells

Estefanía García-Guerrero et al. Haematologica. .

Abstract

B-cell maturation antigen (BCMA) is the lead antigen for chimeric antigen receptor (CAR) T-cell therapy in multiple myeloma (MM). A challenge is inter- and intra-patient heterogeneity in BCMA expression on MM cells and BCMA downmodulation under therapeutic pressure. Accordingly, there is a desire to augment and sustain BCMA expression on MM cells in patients that receive BCMA-CAR T-cell therapy. We used all-trans retinoic acid (ATRA) to augment BCMA expression on MM cells and to increase the efficacy of BCMA-CAR T cells in pre-clinical models. We show that ATRA treatment leads to an increase in BCMA transcripts by quantitative reverse transcription polymerase chain reaction and an increase in BCMA protein expression by flow cytometry in MM cell lines and primary MM cells. Analyses with super-resolution microscopy confirmed increased BCMA protein expression and revealed an even distribution of non-clustered BCMA molecules on the MM cell membrane after ATRA treatment. The enhanced BCMA expression on MM cells after ATRA treatment led to enhanced cytolysis, cytokine secretion and proliferation of BCMA-CAR T cells in vitro, and increased efficacy of BCMA-CAR T-cell therapy in a murine xenograft model of MM in vivo (NSG/MM.1S). Combination treatment of MM cells with ATRA and the γ- secretase inhibitor crenigacestat further enhanced BCMA expression and the efficacy of BCMA-CAR T-cell therapy in vitro and in vivo. Taken together, the data show that ATRA treatment leads to enhanced BCMA expression on MM cells and consecutively, enhanced reactivity of BCMA-CAR T cells. The data support the clinical evaluation of ATRA in combination with BCMA-CAR T-cell therapy and potentially, other BCMA-directed immunotherapies.


Figures
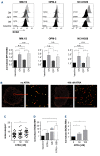
Figure 1.
Figure 1.
All-trans retinoic acid treatment enhances B-cell maturation antigen expression on myeloma cell lines. (A) B-cell maturation antigen (BCMA) expression on MM.1S, OPM-2 and NCI-H929 cell lines was analyzed by flow cytometry. Expression was measured on untreated myeloma cell lines, after 72 hours of all-trans retinoic acid (ATRA) treatment (50 nM), 24 hours after subsequent removal of the drug, and 72 hours after ATRA re-exposition. 7-AAD was used to exclude dead cells from analysis. Upper panel: representative overlay histograms. Lower panel: bar diagrams show relative increase normalized to completely untreated cells (n=5). (B) Representative photographs of BCMA molecule distribution on untreated and ATRA-treated MM.1S cells visualized by direct stochastic optical reconstruction microscopy (dSTORM). (C) Number of BCMA molecules on untreated and ATRA-treated MM.1S cells measured by dSTORM. (D) BCMA expression on MM.1S cells that had been treated with 100 nM ATRA and/or 10 nM γ-secretase inhibitors (GSI) crenigacestat for 72 hours was analyzed by flow cytometry (n=5). (E) BCMA RNA levels in MM.1S were analyzed by quantitative reverse transcription PCR (qRT-PCR) assay after incubation with increasing doses of ATRA for 48 hours (n=4). Bar diagrams show mean values + standard deviation. P values between indicated groups were calculated using unpaired t-test. n.s.: not significant. *P<0.05, **P<0.01, ***P<0.001.
Figure 2.
Figure 2.
All-trans retinoic acid treatment leads to enhanced B-cell maturation antigen expression expression on primary myeloma cells. (A) B-cell maturation antigen (BCMA) expression on CD38+ CD138+ myeloma cells from newly diagnosed (ND) and relapse/refractory (R/R) myeloma patients was analyzed by flow cytometry (n=18 biological replicates). Diagram shows differential mean fluorescence intensity (MFI) of BCMA and isotype control staining. (B) BCMA expression on primary myeloma cells before and after all-trans retinoic acid (ATRA) treatment was analyzed by flow cytometry (n=5 biological replicates). Bar diagram shows relative increase of BCMA expression on ATRA-treated multiple myleloma cell lines normalized to untreated cells. (C) Overlay histogram shows BCMA expression on untreated primary myeloma cells 72 hours after ATRA treatment (100 nM), 24 hours after subsequent removal of the drug, and 72 hours after re-exposition. (D) Bar diagram shows BCMA expression on primary myeloma cells after treatment with 100 nM ATRA and/or 10 nM y-secretase inhibitors crenigacestat for 72 hours (n=3 biological replicates). Bar diagrams show mean values + standard deviation. P values between indicated groups were calculated using unpaired t-test. *P<0.05, **P<0.01, ***P<0.001.
Figure 3.
Figure 3.
B-cell maturation antigen-CAR T cells are not impaired by all-trans retinoic acid treatment. (A) Cell count and viability of CD4+ and CD8+ B-cell maturation antigen chimeric antigen receptor (BCMA-CAR) T cells after incubation with 100 nM all-trans retinoic acid (ATRA) for 72 hours was analyzed by trypan blue staining (n=3 technical triplicates). Left bar diagram shows the total number of living cells, right bar diagram shows the percentage of viable cells. (B) Expression of the EGFRt-CAR transgene construct after incubation of CD4+ and CD8+ BCMA-CAR T cells with 100 nM ATRA for 72 hours was analyzed by flow cytometry (n=3 technical triplicates). Left bar shows percentage of CAR-positive cells, right bar shows geometric mean of transgene signal (C) Cytolytic activity of CD8+ BCMA-CAR T cells was determined in a bioluminescence-based assay after 4 hours of co-incubation with target cells. T cells had been pretreated with 100 nM ATRA for 1 week. Assay was performed in triplicate wells with 5,000 target cells per well (n=3 biological replicates) (D) Soluble BCMA (sBCMA) concentration in the supernatant of MM.1S after incubation with increasing doses of ATRA was analyzed by enzyme-linked immosorbant assay. Bar diagrams show mean values + standard deviation. P values between indicated groups were calculated using (A to C) unpaired t-test or (D) two-way ANOVA. n.s.: not significant.
Figure 4.
Figure 4.
All-trans retinoic acid treatment enhances the anti-myeloma efficacy of B-cell maturation antigen-CAR T cells in vitro. (A to C) Prior to assay setup, MM.1S cells were incubated with 100 nM all-trans retinoic acid (ATRA) and/or 10 nM γ-secretase inhibitors (GSI) for 72 hours or were left untreated. ATRA was washed out before CAR T cells were added. (A) Cytolytic activity of CD8+ B-cell maturation antigen chimeric antigen receptor (BCMA-CAR) T cells was determined in a bioluminescence-based assay after 4 hours of co-incubation with MM.1S target cells. Assay was performed in triplicate wells with 5,000 target cells per well (n=4 biological replicates). (B) BCMA-CAR T cells were co-incubated with MM.1S cells for 24 hours. Cytokine release of BCMA-CAR T cells was determined in the supernatant by enzyme-linked immunosorbant assay. Assay was performed in triplicate wells (n=3 biological replicates). (C) CFSE-labeled BCMA-CAR T cells were co-incubated with MM.1S cells. Proliferative capacity of BCMA-CAR T cells was determined after 3 days by measuring the reduction of CFSE-signal (n=3 biological replicates). Bar diagrams show mean values + standard deviation, P values between indicated groups were calculated using unpaired t-test. n.s.: not significant. *P<0.05, **P<0.01.
Figure 5.
Figure 5.
All-trans retinoic acid treatment enhances the anti-myeloma efficacy of B-cell maturation antigen-CAR T cells in vivo. (A) NSG mice were inoculated with 2x10⁶ MM.1S cells. After 12 days, mice were intraperitoneally (i.p.) injected with 30 mg/kg all-trans retinoic acid (ATRA) for 4 days. BCMA expression on MM.1S cells obtained from bone marrow of untreated and ATRA-treated mice was analyzed by flow cytometry (n=3). (B) ATRA and crenigacestat treatment scheme for experiments in NSU+00a0\1D) NSG mice were inoculated with 2×10⁶ MM.1S/ffluc_GFP cells. 14 days later, they were treated with 1×10⁶ BCMA-CAR T-cells (CD4+:CD8+ ratio = 1:1). BCMA-CAR T cells were given alone or in combination with ATRA (30 mg/kg body weight as i.p. injection), γ -secretase inhibitors (GSI) crenigacestat (1 mg/kg body weight as i.p. injection) or both drugs (n=5-6 mice per group). 12 doses of ATRA and 7 doses of GSI were injected between day 12 and day 27. BLI was measured on day 14, 21, 26 and 28. (C) Percentage of human T cells (CD3+ CD45+) among living cells (7-AAD-) in peripheral blood was measured two days after CAR T-cell injection (day 16) by flowcytometry. (D) The average radiance of MM.1S signal was analyzed to assess myeloma progression/regression in each treatment group. Bioluminescence (BLI) values were obtained as photon/sec/cm/sr in regions of interest encompassing the entire body of each mouse. Circles show the bioluminescence signals of single mice, red dots show the mean bioluminescene signals between day 14 (time point of CAR T-cell injection) and day 28 (end of experiment). (E) Percentage of MM.1S cells in bone marrow from mice treated with BCMA-CAR T cells alone or in combination with ATRA and GSI was analyzed by measuring CD138+, ffluc_GFP+, 7-AAD- cells by flow cytometry. (A and C) Bar diagrams show mean values + standard deviation, P values between indicated groups were calculated using unpaired t-test. *P<0.05, **P<0.01. (D) P values between indicated groups were calculated using non-parametric Mann Whitney U tests for comparing CAR T vs. CAR T + ATRA and CAR T + GSI vs. CART + ATRA + GSI. *P<0.05, **P<0.01.

References

    1. Cohen AD, Garfall AL, Stadtmauer EA, et al. . B cell maturation antigen-specific CAR T cells are clinically active in multiple myeloma. J Clin Invest. 2019;129(6):2210-2221. - PMC - PubMed
    1. Raje N, Berdeja J, Lin Y, et al. . Anti-BCMA CAR T-Cell Therapy bb2121 in relapsed or refractory multiple myeloma. N Engl J Med. 2019;380(18):1726-1737. - PMC - PubMed
    1. Ali SA, Shi V, Maric I, et al. . T cells expressing an anti-B-cell maturation antigen chimeric antigen receptor cause remissions of multiple myeloma. Blood. 2016;128(13):1688-1700. - PMC - PubMed
    1. Zhao W-H, Liu J, Wang B-Y, et al. . A phase 1, open-label study of LCAR-B38M, a chimeric antigen receptor T cell therapy directed against B cell maturation antigen, in patients with relapsed or refractory multiple myeloma. J Hematol Oncol. 2018;11(1):141. - PMC - PubMed
    1. Mullard A. FDA approves second BCMA-targeted CAR-T cell therapy. Nat Rev Drug Discov. 2022;21(4):249. - PubMed

Publication types