

NuRD-independent Mi-2 activity represses ectopic gene expression during neuronal maturation
- PMID: 36722816
- PMCID: PMC10074086
- DOI: 10.15252/embr.202255362
NuRD-independent Mi-2 activity represses ectopic gene expression during neuronal maturation
Abstract
During neuronal development, extensive changes to chromatin states occur to regulate lineage-specific gene expression. The molecular factors underlying the repression of non-neuronal genes in differentiated neurons are poorly characterised. The Mi2/NuRD complex is a multiprotein complex with nucleosome remodelling and histone deacetylase activity. Whilst NuRD has previously been implicated in the development of nervous system tissues, the precise nature of the gene expression programmes that it coordinates is ill-defined. Furthermore, evidence from several species suggests that Mi-2 may be incorporated into multiple complexes that may not possess histone deacetylase activity. We show that Mi-2 activity is required for suppressing ectopic expression of germline genes in neurons independently of HDAC1/NuRD, whilst components of NuRD, including Mi-2, regulate neural gene expression to ensure proper development of the larval nervous system. We find that Mi-2 binding in the genome is dynamic during neuronal maturation, and Mi-2-mediated repression of ectopic gene expression is restricted to the early stages of neuronal development, indicating that Mi-2/NuRD is required for establishing stable neuronal transcriptomes during the early stages of neuronal differentiation.
Keywords: Drosophila; NuRD; chromatin; differentiation; neurons.
© 2023 The Authors. Published under the terms of the CC BY 4.0 license.
Conflict of interest statement
The authors declare that they have no conflict of interest.
Figures
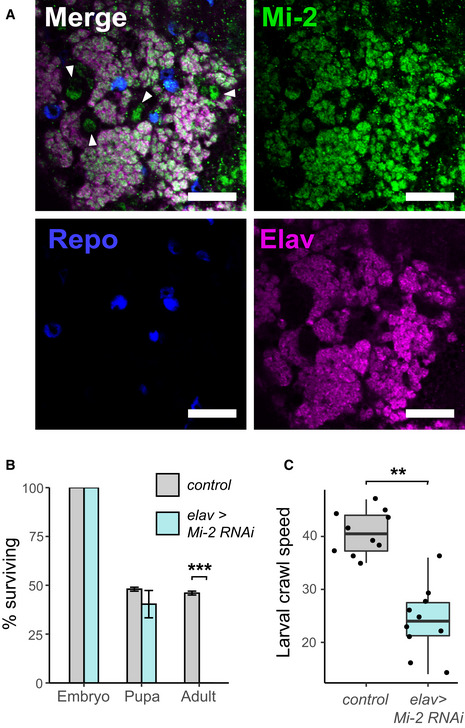
Third instar larval CNS of Mi‐2 GFP‐trap line (scale bar = 20 μm). White arrows highlight NSC nuclei.
Survival of Mi‐2 RNAi and control (mCherry‐RNAi) flies during development (***P < 0.001).
Larval crawl speed (cm/min) in Mi‐2 RNAi and mCherry RNAi controls (**P < 0.01).
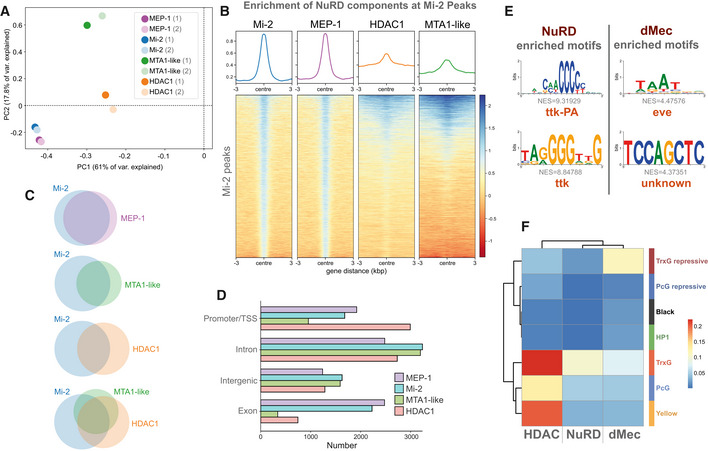
Principal component analysis of all NuRD component binding in neurons including replicates. Mi‐2/MEP‐1 (blue/purple) cluster independently of MTA1‐like (green) and HDAC1 (orange) reflecting greater similarity in their binding profiles.
Heatmap and enrichment plots indicating binding at Mi‐2 peaks.
Venn diagrams indicating the number of overlapping peaks between NuRD subunits. All intersections between peaks occur at statistically significant frequencies (Fisher's exact test P < 10−24).
Peak annotation for Mi‐2, MEP‐1, MTA‐1like and HDAC1 peaks.
Top enriched motifs at NuRD and dMec peaks.
Heatmap indicating jaccard similarity statistic between chromatin states and NuRD peaks (Mi‐2, MEP‐1, MTA‐1like and HDAC1) and dMEC (Mi‐2 and MEP‐1 only), or HDAC1 peaks.
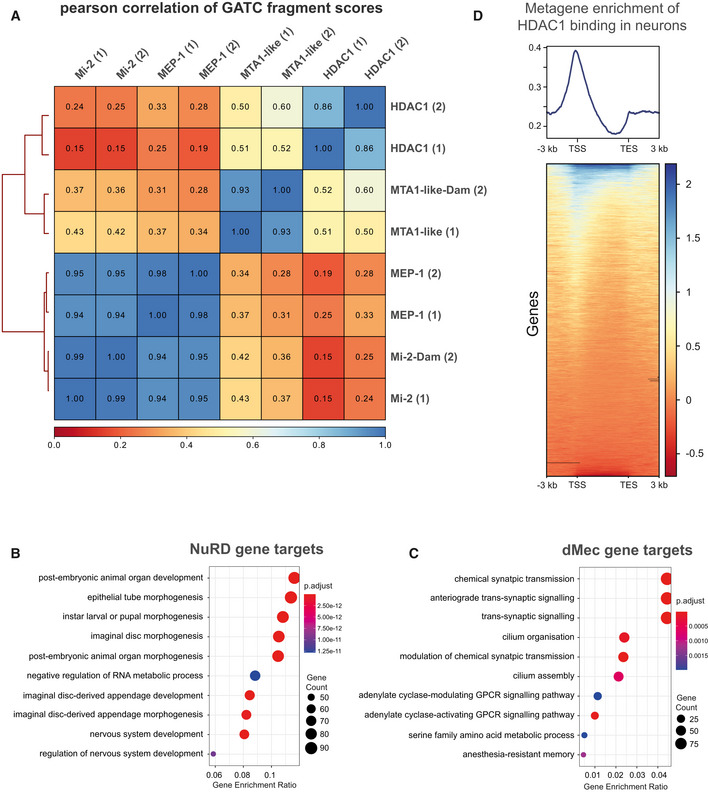
Correlation between NuRD subunits (including replicates) in larval neurons (elav‐GAL4). Very strong correlations are seen between Mi‐2 and MEP‐1 binding while the correlation between Mi‐2/MEP‐1 and either MTA‐1like or HDAC1 is relatively lower. Good correlations are exhibited between replicates for each subunit (spearman's correlation r 2 = 0.85–0.95).
GO analysis of NuRD gene targets.
GO analysis of dMec gene targets genes.
Metagene analysis of HDAC1 binding. TSS is Transcriptional Start Site, and TES is Transcriptional End Site.
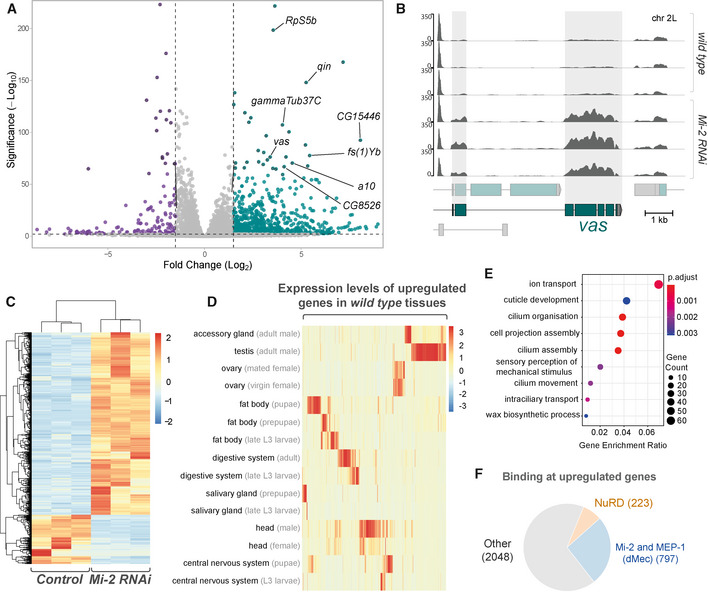
Volcano plot showing significantly upregulated (green) and downregulated (purple) genes with fold‐change. Selected mis‐expressed genes are annotated.
RNA‐seq tracks showing vas mRNA expression in third instar larval CNS (Y‐axis is RPKM).
Heatmap showing relative changes in normalised read‐counts between Mi‐2 RNAi and control replicates for all significantly differentially expressed genes (P‐adj < 0.05, log2 fold change > 1 or < −1). Significantly more genes are upregulated (1467) than downregulated (397).
Heatmap showing relative expression levels of upregulated genes across selected Drosophila tissues (full version in Appendix Fig S2).
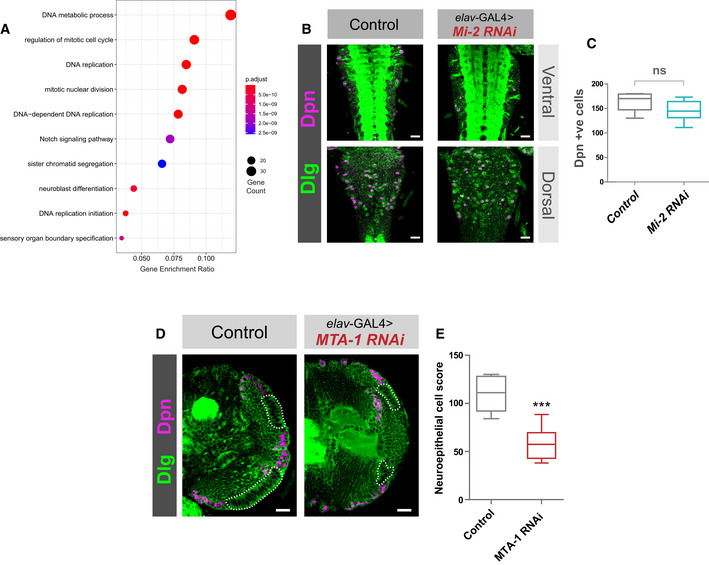
Enriched gene ontology terms for genes that are upregulated in Mi‐2 RNAi knockdown.
Proportion of differentially upregulated genes that directly intersect with Mi-2, MEP-1, MTA-1like and HDAC1 peaks, and differentially upregulated genes intersecting with exclusively Mi-2/MEP-1 or all NuRD subunits.
- A
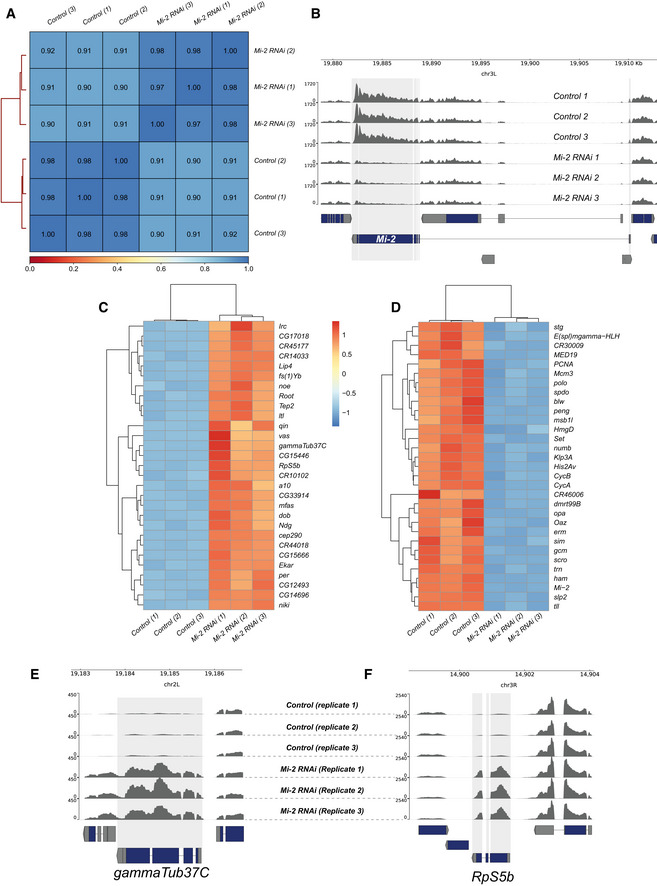
Heatmap showing Pearson correlation of RNA‐seq reads between biological replicates and control and experimental groups. Very strong correlations are observed between replicates (R 2 > 0.97) with slightly lower correlations between knockdown and controls reflecting the changes in Mi‐2 RNAi transcriptome.
- B
Genome browser tracks indicating RNA‐seq read coverage at the Mi‐2 locus. Mi‐2 reads are clearly depleted in Mi‐2 RNAi compared with elav‐GAL4 × mCherry RNAi controls (adjusted P value < 2.2 × 10−227).
- C
Heatmap showing relative changes in normalised gene expression for the thirty most significantly upregulated genes.
- D
Heatmap showing relative changes in normalised gene expression for the 30 most significantly down‐regulated genes.
- E, F
Read coverage for (E) gammaTub37C and (F) RpS5b loci, which are non‐CNS genes ectopically expressed in Mi‐2 knockdown.
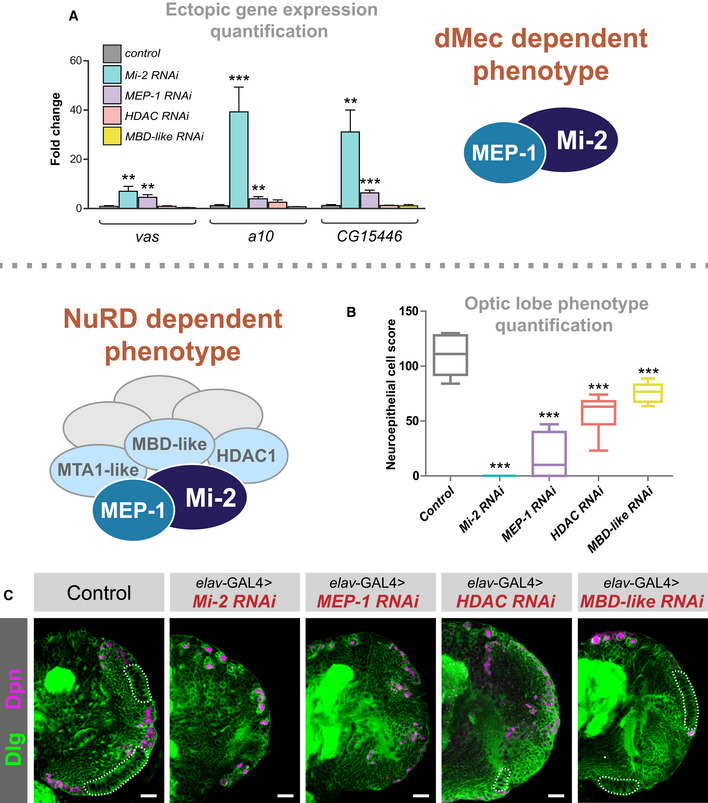
Quantification of candidate gene expression (selected from upregulated genes in RNA‐seq data) in knockdown genotypes (three biological replicates for each group). **P < 0.01 and ***P < 0.001 (one‐tailed student's t‐test or Welch's t‐test against control) Represented as mean ± SEM.
Quantification of optic lobe neuroepithelial cells of genotypes shown in panel C (n >= 9 for each group). ***P < 0.001 (one‐tailed student's t‐test or Welch's t‐test against control). Represented as a box plot.
Representative images of control (elav‐GAL4;; mCherry RNAi ), Mi‐2 knockdown, MEP‐1 knockdown, HDAC1 knockdown and MBD‐like knockdown in the third instar larval CNS (all scale bars = 20 μm). Discs large (Dlg) = green, Deadpan (Dpn) = magenta. Neuroepithelial cells are highlighted by dashed lines.
GO analysis of downregulated genes.
Mi‐2 knockdown does not affect NSC numbers in the VNC. (B) Example images from ventral and dorsal sections of the VNC. Scale bars = 20 μm.
Quantification of Dpn‐positive cells (no significant difference). Six VNCs measured for each genotype. No significant difference (two‐tailed student's t‐test). Represented as a box plot.
MTA1‐like knockdown causes an optic lobe phenotype. (D) Representative images of control (elav‐GAL4;; mCherry RNAi), and MTA1‐like knockdown in the third instar larval CNS (all scale bars = 20 μm). Discs large (Dlg) = green, Deadpan (Dpn) = magenta. Neuroepithelial cells are highlighted by dashed lines.
Quantification of optic lobe neuroepithelial cells of genotypes shown in panel A. At least eight brains measured for each genotype. ***P < 0.001 (one‐tailed student's t‐test). Represented as a box plot.
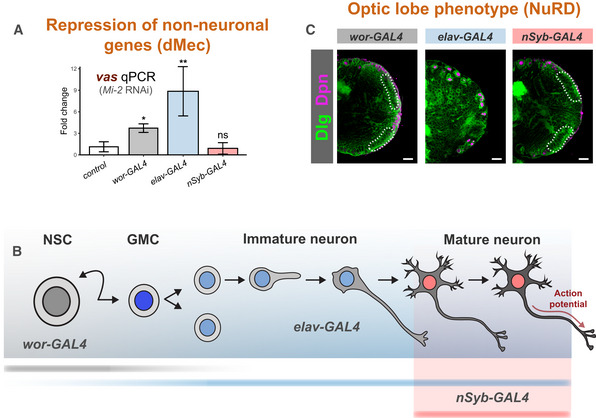
Ectopic expression of vas when Mi‐2 is knocked down at different stages of differentiation (three biological replicates for each group). *P < 0.05 and **P < 0.01 (one‐tailed student's t‐test against control) Represented as mean ± SEM.
Representation of expression of GAL4 drivers used.
Larval brain optic lobe morphology when Mi‐2 is knocked down at different stages of differentiation Elav = green, Dpn = magenta.
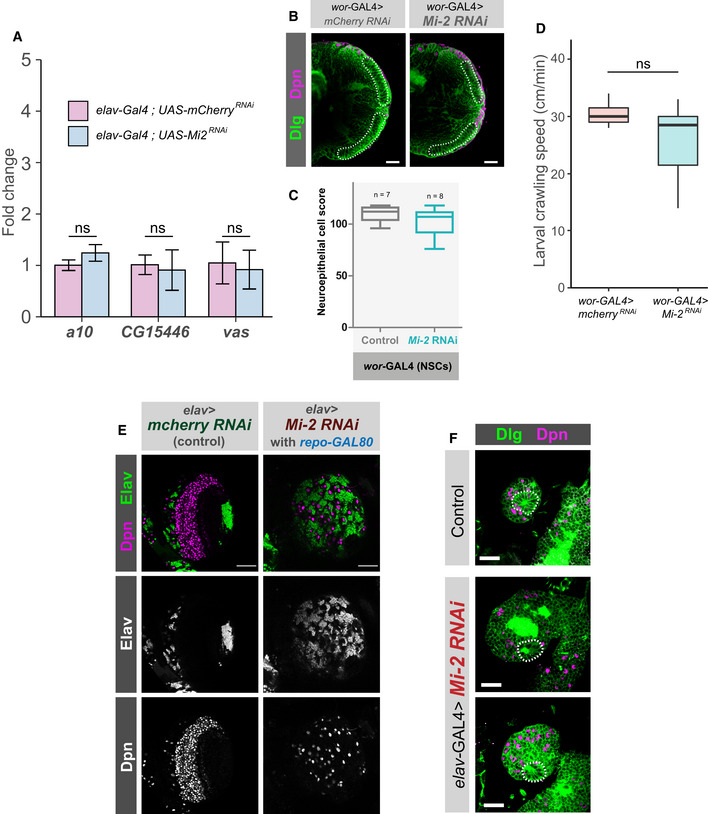
Knockdown of Mi‐2 in adult brain neurons does not cause ectopic expression of genes. qPCR measurement of gene expression in adult heads. Mi‐2 RNAi is induced for 24 h using GAL80ts. No significant changes in expression of either vas, a10 or CG15446 were observed (one‐tailed students t‐test, represented as mean ± SEM.). Three biological replicates per genotype.
Representative images of optic lobes for control and Mi‐2 knockdown in NSCs.
Quantification of optic lobe neuroepithelial cells of genotypes shown in panel B (n >= 7 for each group). Represented as a box plot. No significant difference found (one‐tailed student's t‐test).
Larval crawl speed (cm/min) in wor‐GAL4 × Mi‐2 RNAi and wor‐GAL4 × mCherry RNAi controls. No significant changes in crawl speed were observed (two‐tailed students t‐test, n = 10 animals per genotype). Represented as a box plot.
Optic lobe phenotype is not due to Mi‐2 knockdown in glial cells. Optic lobe of third instar larvae in which repo‐GAL80 represses glial GAL4 expression. Loss of neuroepithelial cells is still observed as in elav‐GAL4; Mi‐2 RNAi brains. Scale bar = 50 μm.
Characteristic rosette structure of the neuroepithelial cells is present in the control first instar optic lobe and in elav‐GAL4; Mi‐2 RNAi 1st instar optic lobes. Scale bar = 20 μm.
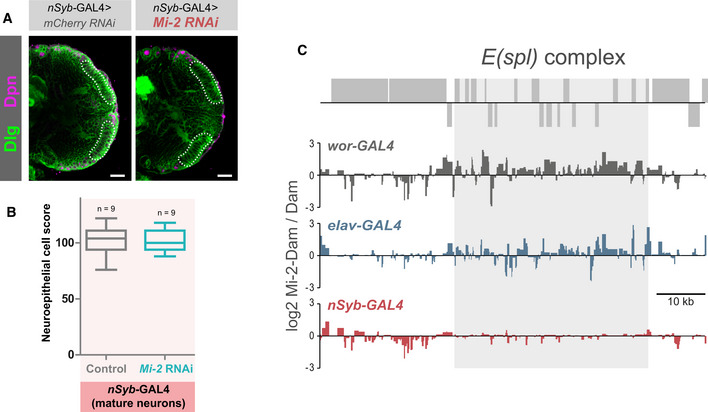
Representative images of optic lobes for control and Mi‐2 knockdown in mature neurons.
Quantification of optic lobe neuroepithelial cells of genotypes shown in panel B (n >= 7 for each group). Represented as a box plot. No significant difference found (one‐tailed student's t‐test).
Mi‐2 binding at the E(spl) complex is lost in mature neurons. Grey boxes represent genes.
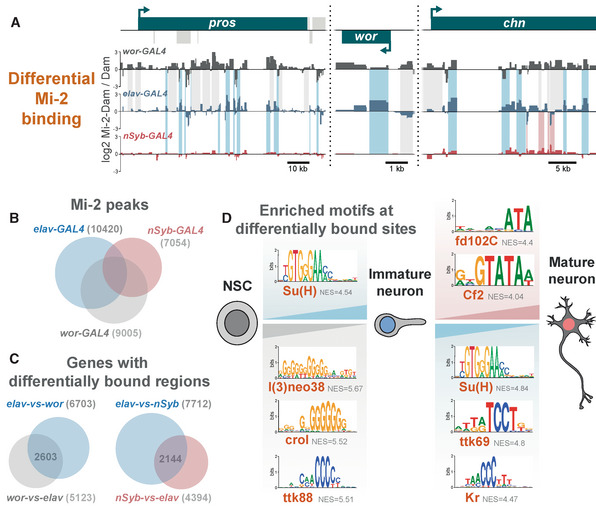
Examples of differential genomic binding of Mi‐2 at neural genes.
Overlap of Mi‐2 binding peaks in NSCs, immature neurons and mature neurons.
Number and overlap of genes with differential Mi‐2 binding.
Motif analysis of differentially bound regions.
References
Publication types
MeSH terms
Substances
Associated data
- Actions
Grants and funding
LinkOut - more resources
Full Text Sources
Molecular Biology Databases
Miscellaneous
