

Predicting microsatellite instability and key biomarkers in colorectal cancer from H&E-stained images: achieving state-of-the-art predictive performance with fewer data using Swin Transformer
- PMID: 36723384
- PMCID: PMC10073932
- DOI: 10.1002/cjp2.312
Predicting microsatellite instability and key biomarkers in colorectal cancer from H&E-stained images: achieving state-of-the-art predictive performance with fewer data using Swin Transformer
Abstract
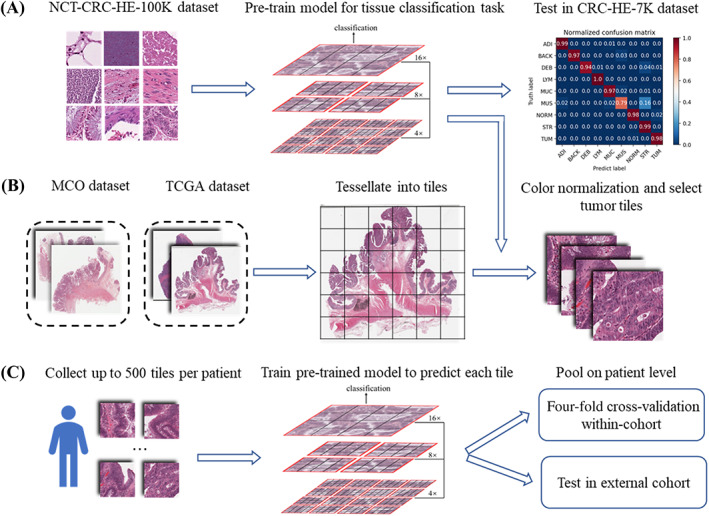
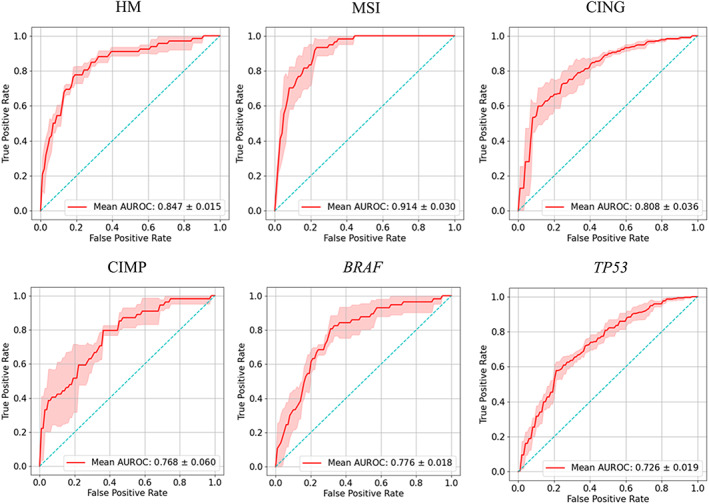
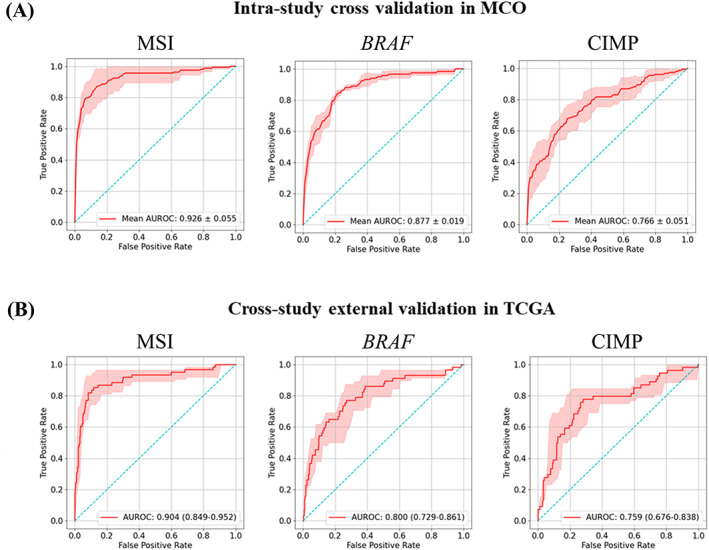
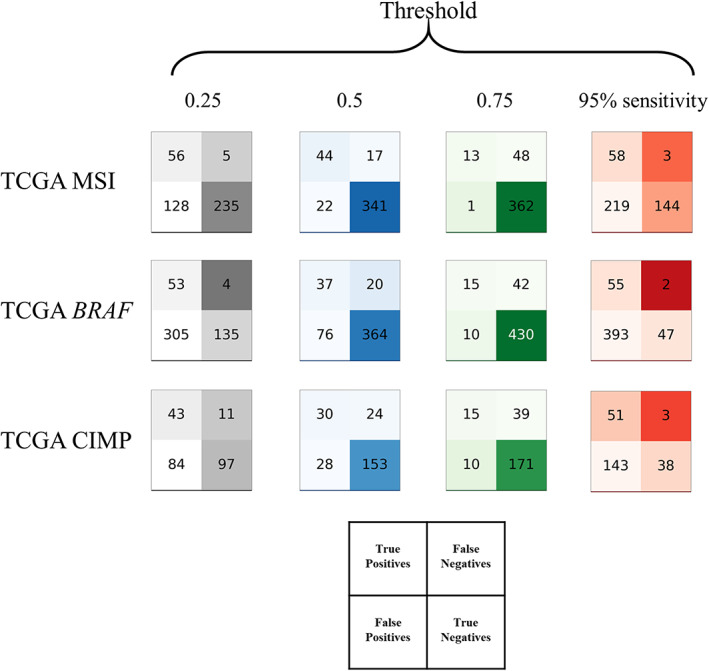
Many artificial intelligence models have been developed to predict clinically relevant biomarkers for colorectal cancer (CRC), including microsatellite instability (MSI). However, existing deep learning networks require large training datasets, which are often hard to obtain. In this study, based on the latest Hierarchical Vision Transformer using Shifted Windows (Swin Transformer [Swin-T]), we developed an efficient workflow to predict biomarkers in CRC (MSI, hypermutation, chromosomal instability, CpG island methylator phenotype, and BRAF and TP53 mutation) that required relatively small datasets. Our Swin-T workflow substantially achieved the state-of-the-art (SOTA) predictive performance in an intra-study cross-validation experiment on the Cancer Genome Atlas colon and rectal cancer dataset (TCGA-CRC-DX). It also demonstrated excellent generalizability in cross-study external validation and delivered a SOTA area under the receiver operating characteristic curve (AUROC) of 0.90 for MSI, using the Molecular and Cellular Oncology dataset for training (N = 1,065) and the TCGA-CRC-DX (N = 462) for testing. A similar performance (AUROC = 0.91) was reported in a recent study, using ~8,000 training samples (ResNet18) on the same testing dataset. Swin-T was extremely efficient when using small training datasets and exhibited robust predictive performance with 200-500 training samples. Our findings indicate that Swin-T could be 5-10 times more efficient than existing algorithms for MSI prediction based on ResNet18 and ShuffleNet. Furthermore, the Swin-T models demonstrated their capability in accurately predicting MSI and BRAF mutation status, which could exclude and therefore reduce samples before subsequent standard testing in a cascading diagnostic workflow, in turn reducing turnaround time and costs.
Keywords: Swin Transformer; biomarkers; colorectal cancer; deep learning; digital pathology.
© 2023 The Authors. The Journal of Pathology: Clinical Research published by The Pathological Society of Great Britain and Ireland and John Wiley & Sons Ltd.
Figures

Similar articles
-
A Novel and Efficient Digital Pathology Classifier for Predicting Cancer Biomarkers Using Sequencer Architecture.Am J Pathol. 2023 Dec;193(12):2122-2132. doi: 10.1016/j.ajpath.2023.09.006. Epub 2023 Sep 27. Am J Pathol. 2023. PMID: 37775043
-
Development and validation of a weakly supervised deep learning framework to predict the status of molecular pathways and key mutations in colorectal cancer from routine histology images: a retrospective study.Lancet Digit Health. 2021 Dec;3(12):e763-e772. doi: 10.1016/S2589-7500(21)00180-1. Epub 2021 Oct 19. Lancet Digit Health. 2021. PMID: 34686474 Free PMC article.
-
Deep learning model for the prediction of microsatellite instability in colorectal cancer: a diagnostic study.Lancet Oncol. 2021 Jan;22(1):132-141. doi: 10.1016/S1470-2045(20)30535-0. Lancet Oncol. 2021. PMID: 33387492
-
Methylator phenotype in colorectal cancer: A prognostic factor or not?Crit Rev Oncol Hematol. 2016 Mar;99:74-80. doi: 10.1016/j.critrevonc.2015.11.001. Epub 2015 Dec 7. Crit Rev Oncol Hematol. 2016. PMID: 26702883 Review.
-
MSI status is associated with distinct clinicopathological features in BRAF mutation colorectal cancer: A systematic review and meta-analysis.Pathol Res Pract. 2020 Jan;216(1):152791. doi: 10.1016/j.prp.2019.152791. Epub 2019 Dec 17. Pathol Res Pract. 2020. PMID: 31866097
Cited by
-
Revolutionizing gastroenterology and hepatology with artificial intelligence: From precision diagnosis to equitable healthcare through interdisciplinary practice.World J Gastroenterol. 2025 Jun 28;31(24):108021. doi: 10.3748/wjg.v31.i24.108021. World J Gastroenterol. 2025. PMID: 40599184 Free PMC article. Review.
-
An interpretable deep learning model for detecting BRCA pathogenic variants of breast cancer from hematoxylin and eosin-stained pathological images.PeerJ. 2024 Oct 28;12:e18098. doi: 10.7717/peerj.18098. eCollection 2024. PeerJ. 2024. PMID: 39484212 Free PMC article.
-
Deep Gaussian process with uncertainty estimation for microsatellite instability and immunotherapy response prediction from histology.NPJ Digit Med. 2025 May 19;8(1):294. doi: 10.1038/s41746-025-01580-8. NPJ Digit Med. 2025. PMID: 40389599 Free PMC article.
-
Development and deployment of a histopathology-based deep learning algorithm for patient prescreening in a clinical trial.Nat Commun. 2024 Jun 1;15(1):4690. doi: 10.1038/s41467-024-49153-9. Nat Commun. 2024. PMID: 38824132 Free PMC article.
-
Pathomics in Gastrointestinal Tumors: Research Progress and Clinical Applications.Cureus. 2025 May 29;17(5):e85060. doi: 10.7759/cureus.85060. eCollection 2025 May. Cureus. 2025. PMID: 40452669 Free PMC article. Review.
References
-
- Yamashita R, Long J, Longacre T, et al. Deep learning model for the prediction of microsatellite instability in colorectal cancer: a diagnostic study. Lancet Oncol 2021; 22: 132–141. - PubMed
-
- Fu Y, Jung AW, Torne RV, et al. Pan‐cancer computational histopathology reveals mutations, tumor composition and prognosis. Nat Cancer 2020; 1: 800–810. - PubMed
Publication types
MeSH terms
Substances
LinkOut - more resources
Full Text Sources
Medical
Research Materials
Miscellaneous
