

Area-level Socioeconomic Disadvantage and Cancer Survival in Metropolitan Detroit
- PMID: 36723416
- PMCID: PMC10071652
- DOI: 10.1158/1055-9965.EPI-22-0738
Area-level Socioeconomic Disadvantage and Cancer Survival in Metropolitan Detroit
Abstract
Background: Racial segregation is linked to poorer neighborhood quality and adverse health conditions among minorities, including worse cancer outcomes. We evaluated relationships between race, neighborhood social disadvantage, and cancer survival.
Methods: We calculated overall and cancer-specific survival for 11,367 non-Hispanic Black (NHB) and 29,481 non-Hispanic White (NHW) individuals with breast, colorectal, lung, or prostate cancer using data from the Metropolitan Detroit Cancer Surveillance System. The area deprivation index (ADI) was used to measure social disadvantage at the census block group level, where higher ADI is associated with poorer neighborhood factors. Associations between ADI and survival were estimated using Cox proportional hazards mixed-effects models accounting for geographic grouping and adjusting for demographic and clinical factors.
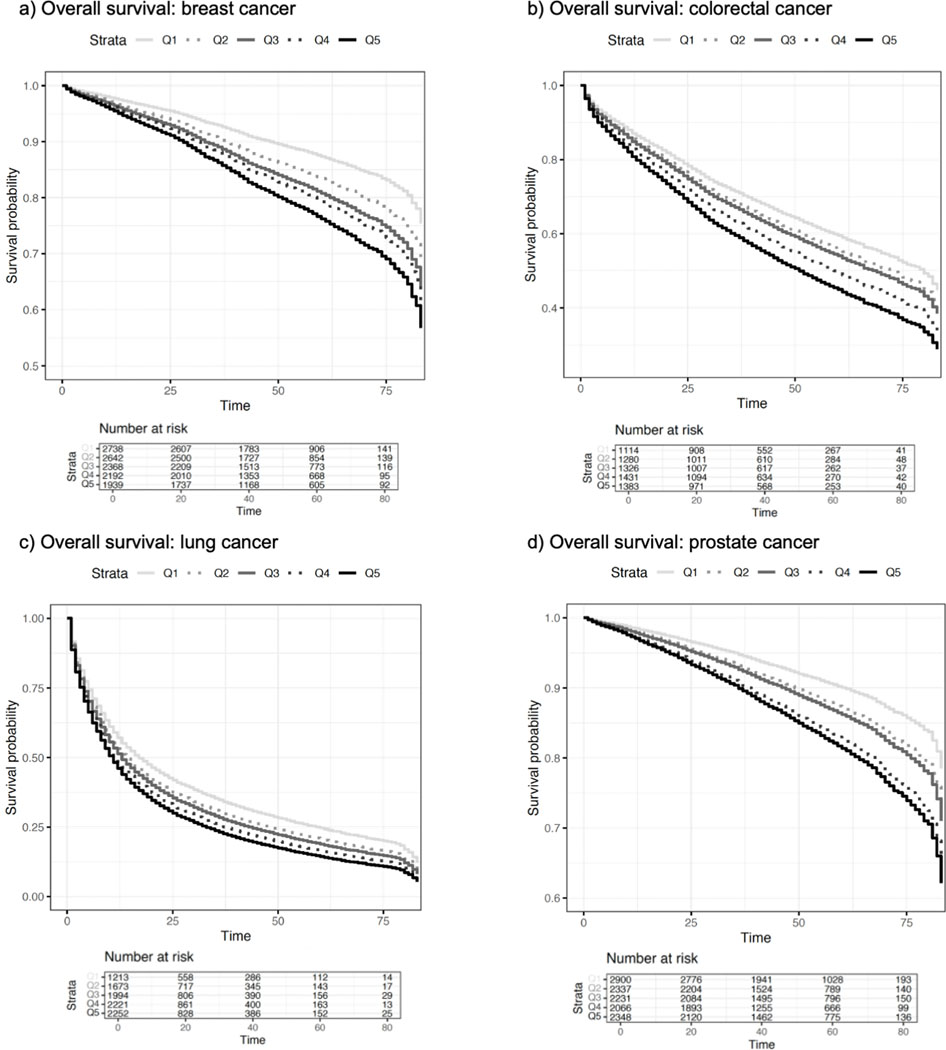
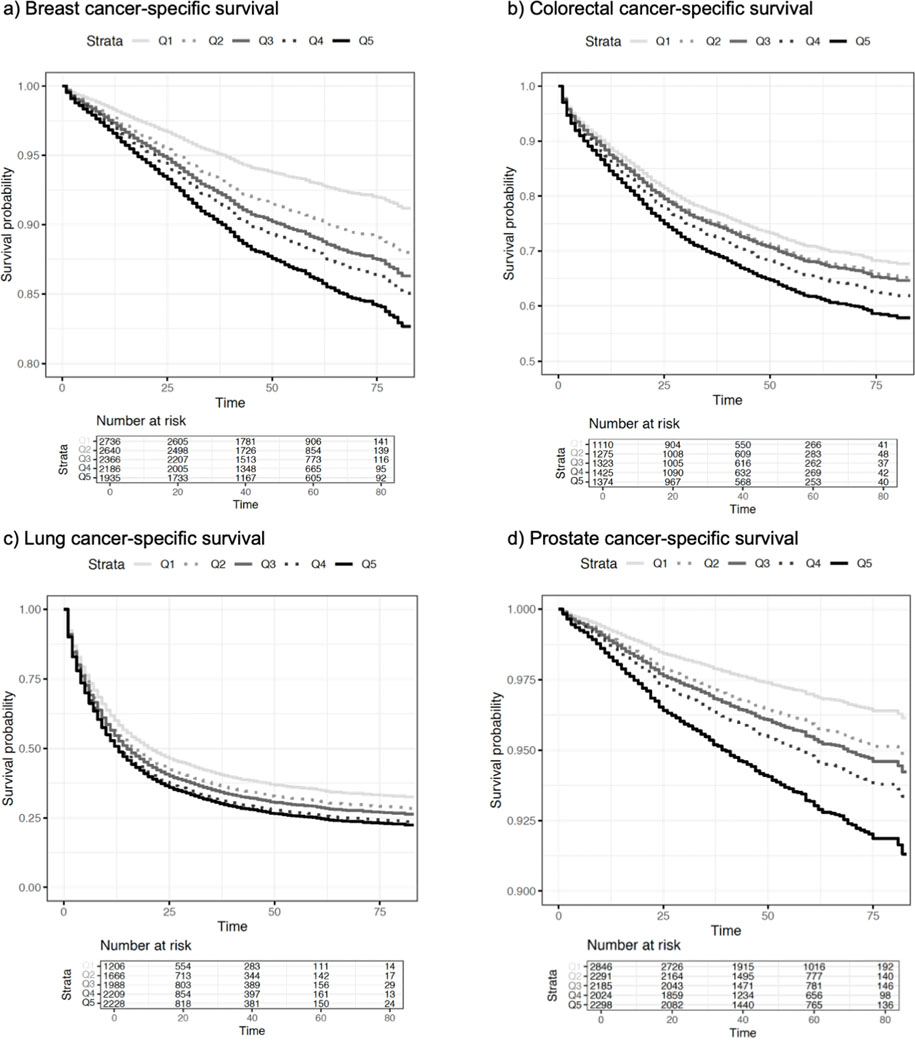
Results: Increasing ADI quintile was associated with increased overall mortality for all four cancer sites in multivariable-adjusted models. Stratified by race, these associations remained among breast (NHW: HR = 1.16, P < 0.0001; NHB: HR = 1.20, P < 0.0001), colorectal (NHW: HR = 1.11, P < 0.0001; NHB: HR = 1.09, P = 0.00378), prostate (NHW: HR = 1.18, P < 0.0001; NHB: HR = 1.18, P < 0.0001), and lung cancers (NHW: HR = 1.06, P < 0.0001; NHB: HR = 1.07, P = 0.00177). Cancer-specific mortality estimates were similar to overall mortality. Adjustment for ADI substantially attenuated the effects of race on mortality for breast [overall proportion attenuated (OPA) = 47%, P < 0.0001; cancer-specific proportion attenuated (CSPA) = 37%, P < 0.0001] prostate cancer (OPA = 51%, P < 0.0001; CSPA = 56%, P < 0.0001), and colorectal cancer (OPA = 69%, P = 0.032; CSPA = 36%, P = 0.018).
Conclusions: Area-level socioeconomic disadvantage is related to cancer mortality in a racially diverse population, impacting racial differences in cancer mortality.
Impact: Understanding the role of neighborhood quality in cancer survivorship could improve community-based intervention practices.
©2023 American Association for Cancer Research.
Conflict of interest statement
Figures
References
-
- Cancer Facts & Figures 2022. | American Cancer Society [Internet]. [cited 2022 Sep 27]. Available from: https://www.cancer.org/research/cancer-facts-statistics/all-cancer-facts...
Publication types
MeSH terms
Grants and funding
LinkOut - more resources
Full Text Sources
Medical
