

Application of radiomics to meningiomas: A systematic review
- PMID: 36723606
- PMCID: PMC10237421
- DOI: 10.1093/neuonc/noad028
Application of radiomics to meningiomas: A systematic review
Abstract
Background: Quantitative imaging analysis through radiomics is a powerful technology to non-invasively assess molecular correlates and guide clinical decision-making. There has been growing interest in image-based phenotyping for meningiomas given the complexities in management.
Methods: We systematically reviewed meningioma radiomics analyses published in PubMed, Embase, and Web of Science until December 20, 2021. We compiled performance data and assessed publication quality using the radiomics quality score (RQS).
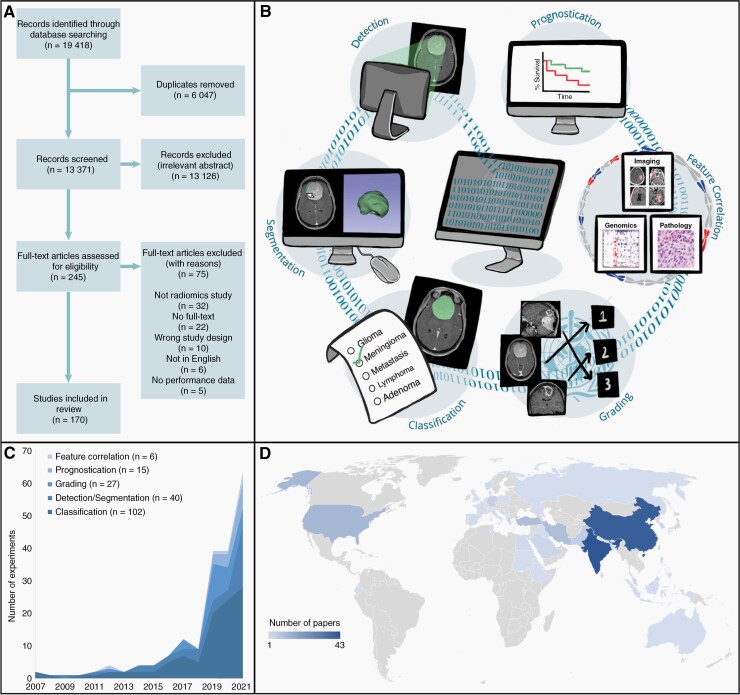
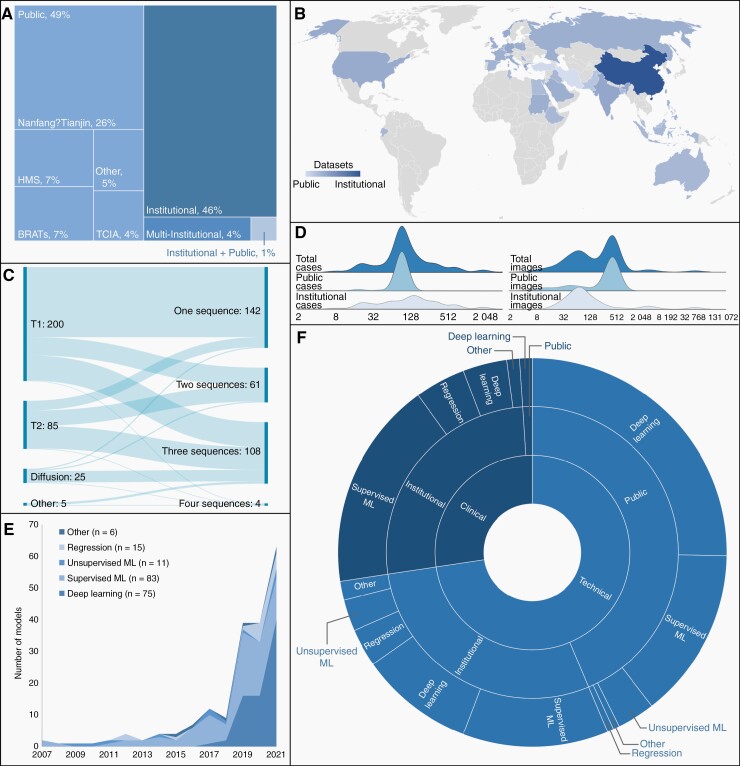
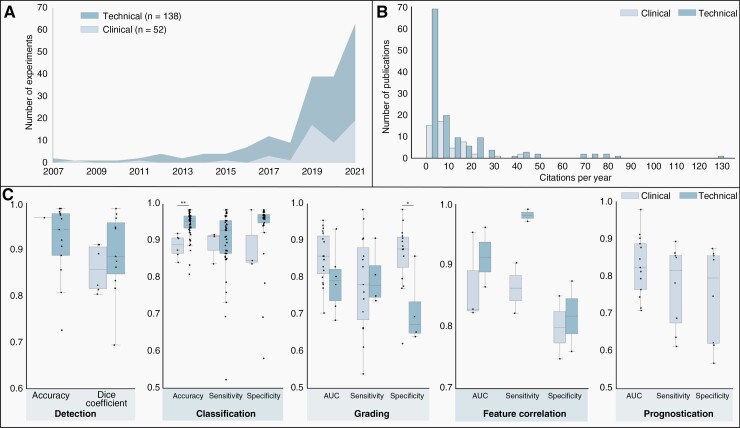
Results: A total of 170 publications were grouped into 5 categories of radiomics applications to meningiomas: Tumor detection and segmentation (21%), classification across neurologic diseases (54%), grading (14%), feature correlation (3%), and prognostication (8%). A majority focused on technical model development (73%) versus clinical applications (27%), with increasing adoption of deep learning. Studies utilized either private institutional (50%) or public (49%) datasets, with only 68% using a validation dataset. For detection and segmentation, radiomic models had a mean accuracy of 93.1 ± 8.1% and a dice coefficient of 88.8 ± 7.9%. Meningioma classification had a mean accuracy of 95.2 ± 4.0%. Tumor grading had a mean area-under-the-curve (AUC) of 0.85 ± 0.08. Correlation with meningioma biological features had a mean AUC of 0.89 ± 0.07. Prognostication of the clinical course had a mean AUC of 0.83 ± 0.08. While clinical studies had a higher mean RQS compared to technical studies, quality was low overall with a mean RQS of 6.7 ± 5.9 (possible range -8 to 36).
Conclusions: There has been global growth in meningioma radiomics, driven by data accessibility and novel computational methodology. Translatability toward complex tasks such as prognostication requires studies that improve quality, develop comprehensive patient datasets, and engage in prospective trials.
Keywords: artificial intelligence; cancer phenotype; genomics; meningioma; radiomics.
© The Author(s) 2023. Published by Oxford University Press on behalf of the Society for Neuro-Oncology. All rights reserved. For permissions, please e-mail: journals.permissions@oup.com.
Conflict of interest statement
The authors declare no conflicts of interest.
Figures

References
-
- Castellano G, Bonilha L, Li LM, Cendes F.. Texture analysis of medical images. Clin Radiol. 2004;59(12):1061–1069. - PubMed
