

Long-term Exposure to Multiple Ambient Air Pollutants and Association With Incident Depression and Anxiety
- PMID: 36723924
- PMCID: PMC10077109
- DOI: 10.1001/jamapsychiatry.2022.4812
Long-term Exposure to Multiple Ambient Air Pollutants and Association With Incident Depression and Anxiety
Abstract
Importance: Air pollution is increasingly recognized as an important environmental risk factor for mental health. However, epidemiologic evidence on long-term exposure to low levels of air pollutants with incident depression and anxiety is still very limited.
Objectives: To investigate the association of long-term joint exposure to multiple air pollutants with incident depression and anxiety.
Design, setting, and participants: This prospective, population-based cohort study used data from the UK Biobank. The participants were recruited between March 13, 2006, and October 1, 2010, and included individuals who had never been diagnosed with depression or anxiety at baseline and had full information on exposure and covariates. Data were analyzed from May 1 to October 10, 2022.
Exposures: Annual mean air pollution concentrations of particulate matter (PM) with aerodynamic diameter of 2.5 μm or less (PM2.5) and PM with aerodynamic diameter between 2.5 μm and 10 μm (PM2.5-10). Nitrogen dioxide (NO2) and nitric oxide (NO) were estimated for each participant's residential address using the land use regression model, and joint exposure to air pollution reflected by air pollution score was calculated by principal components analysis.
Main outcomes and measures: Incidence of diagnosed depression (F32-F33) and anxiety (F40-F48) were ascertained with International Statistical Classification of Diseases and Related Health Problems, Tenth Revision codes.
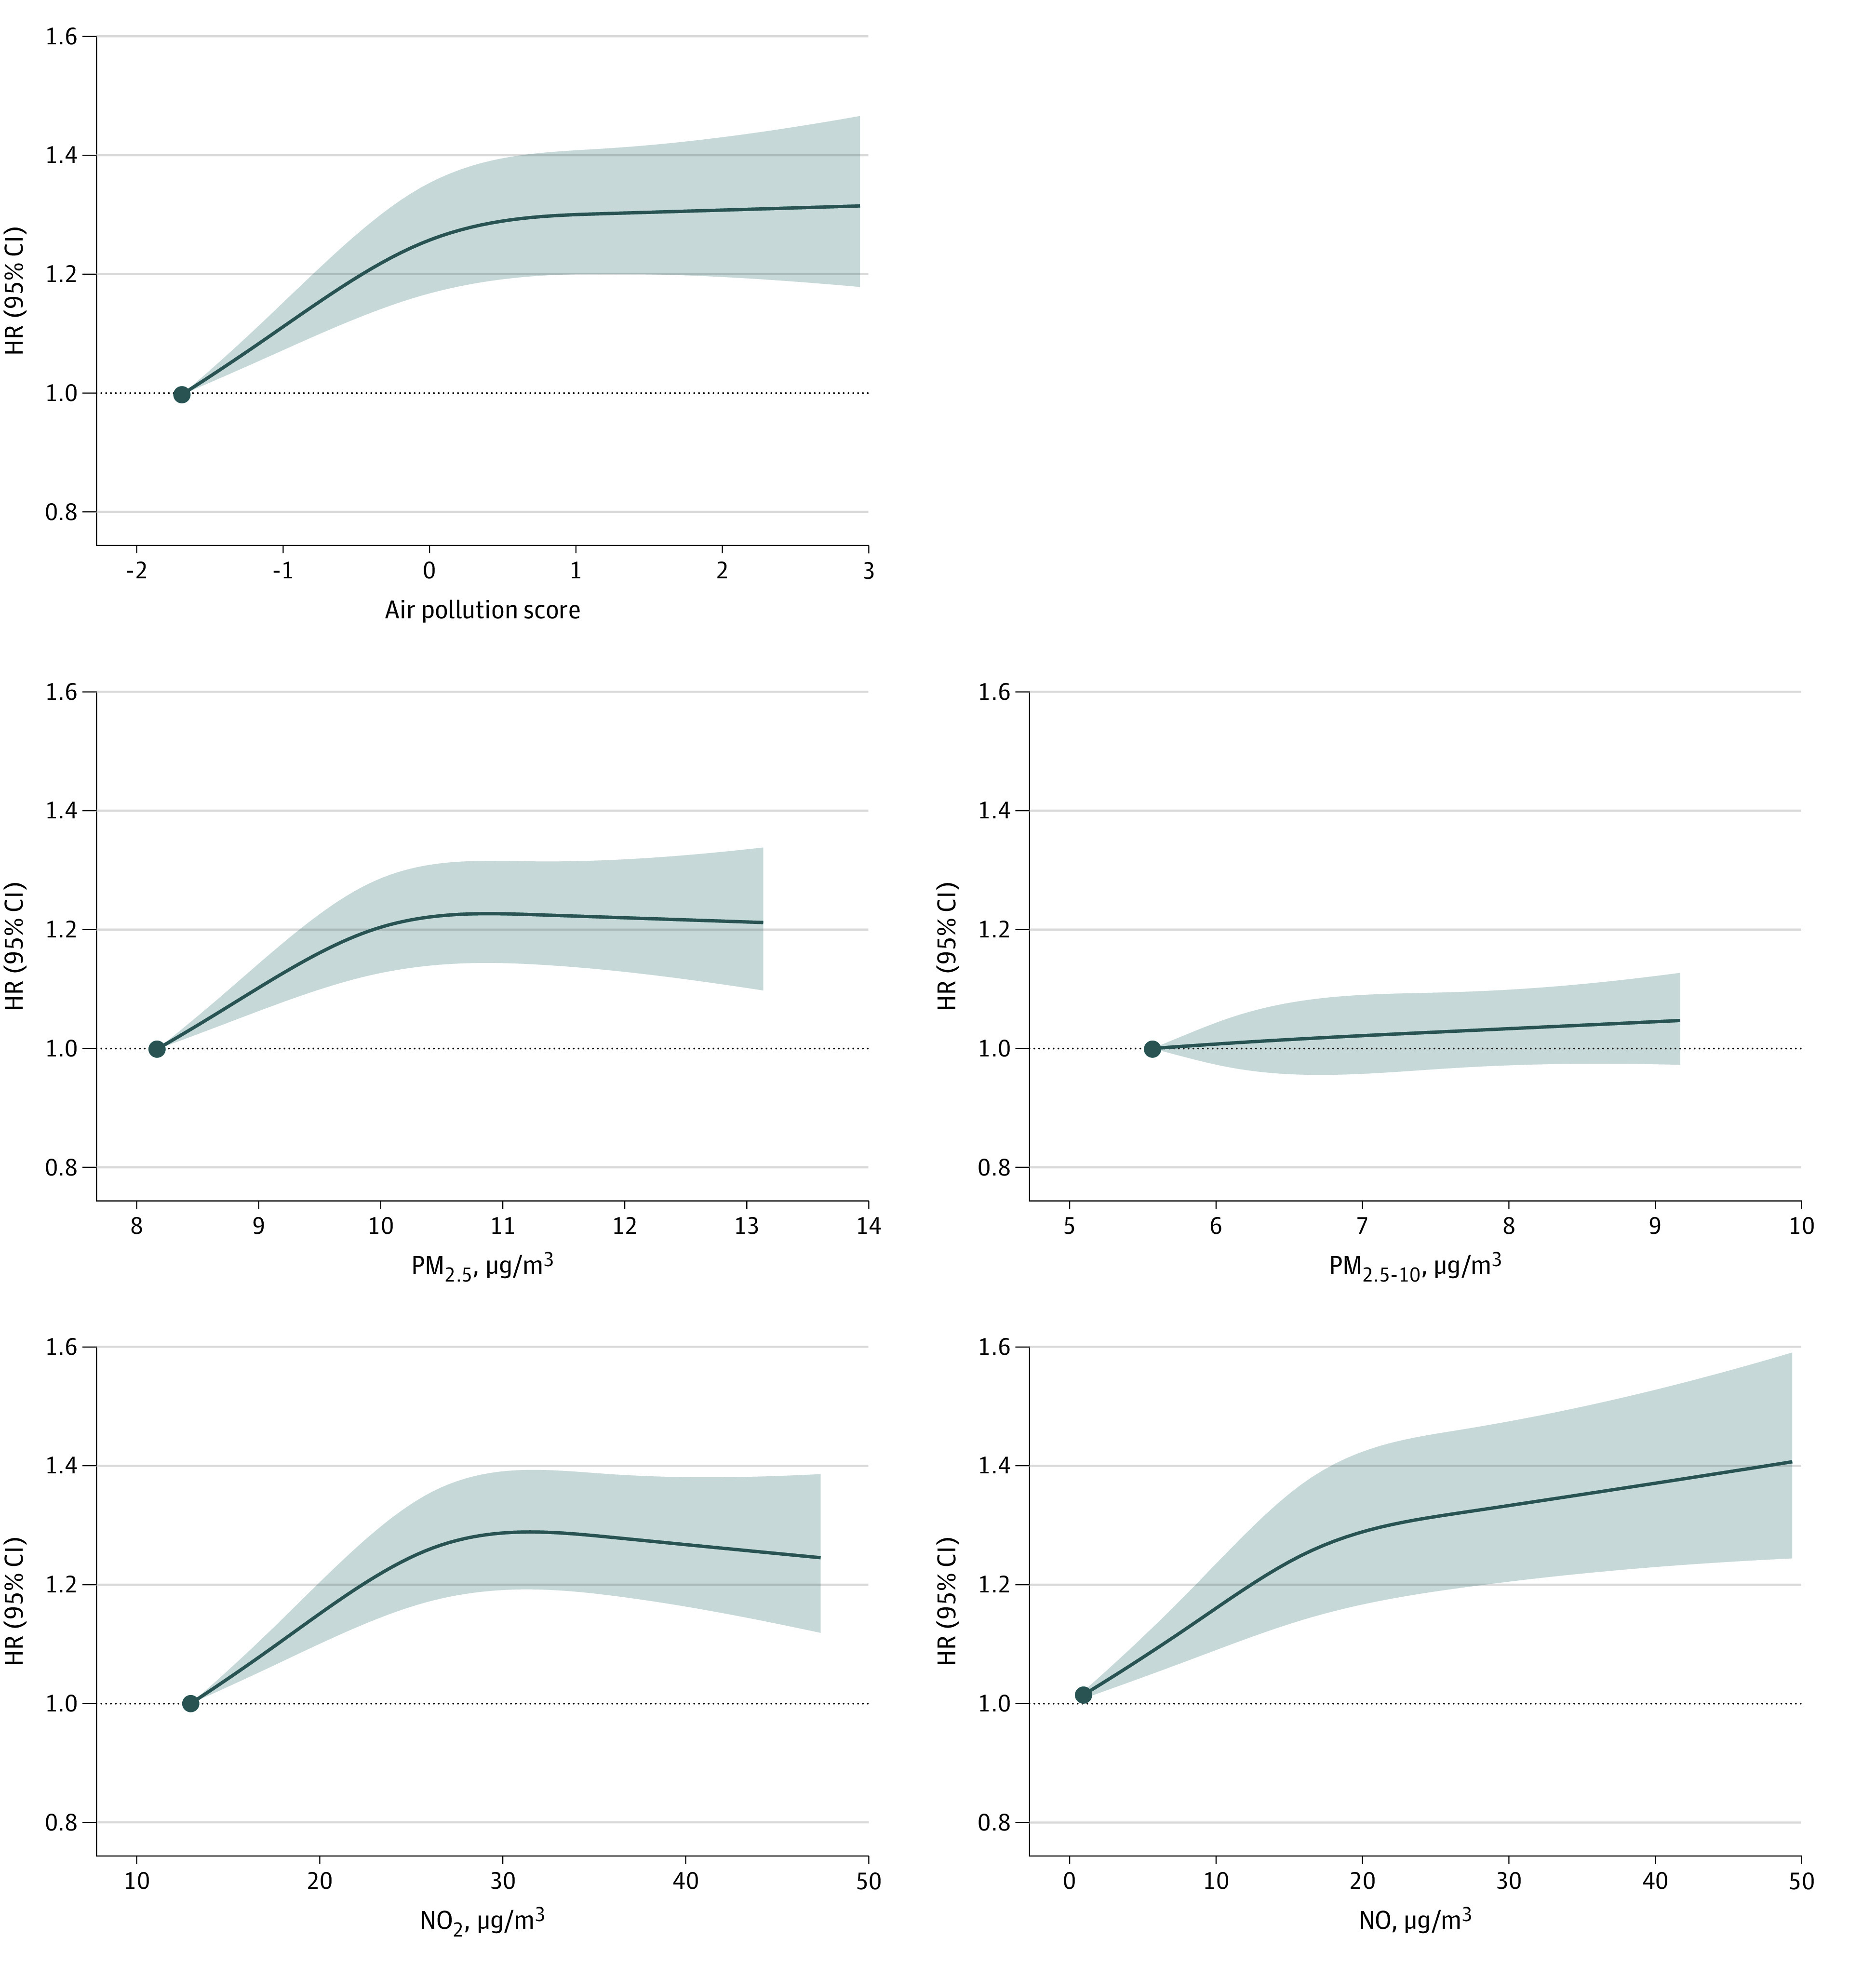
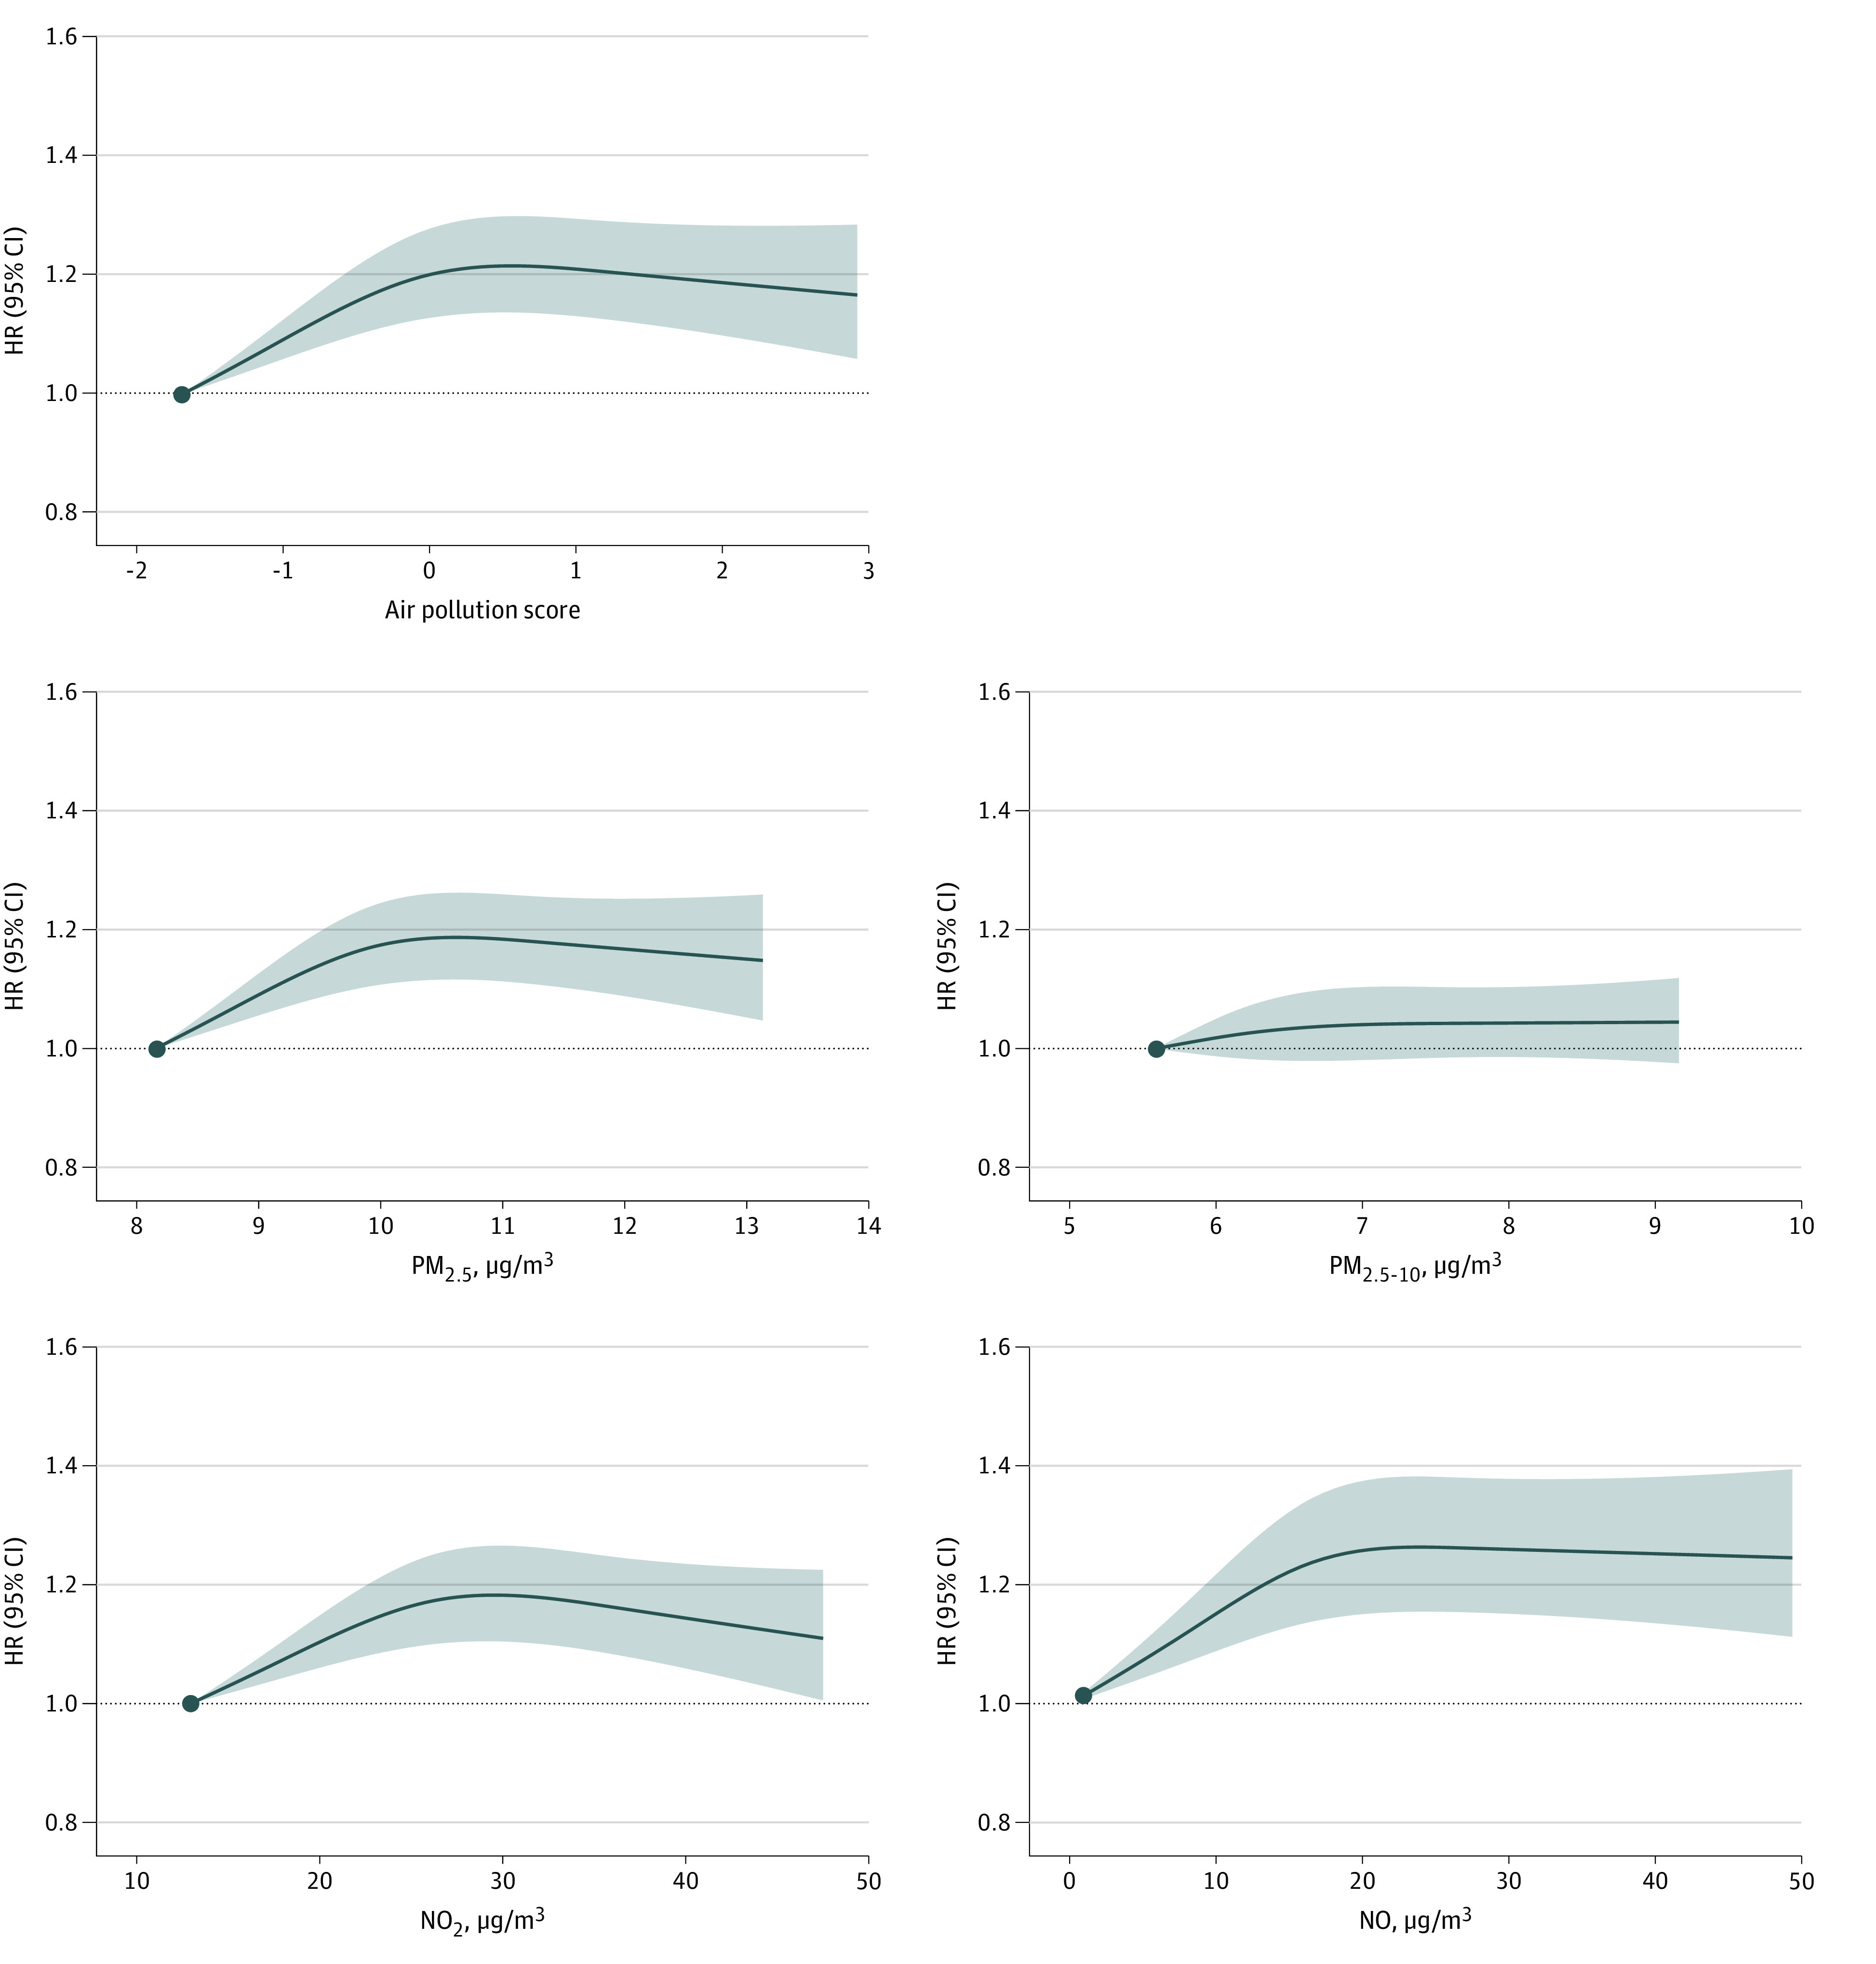
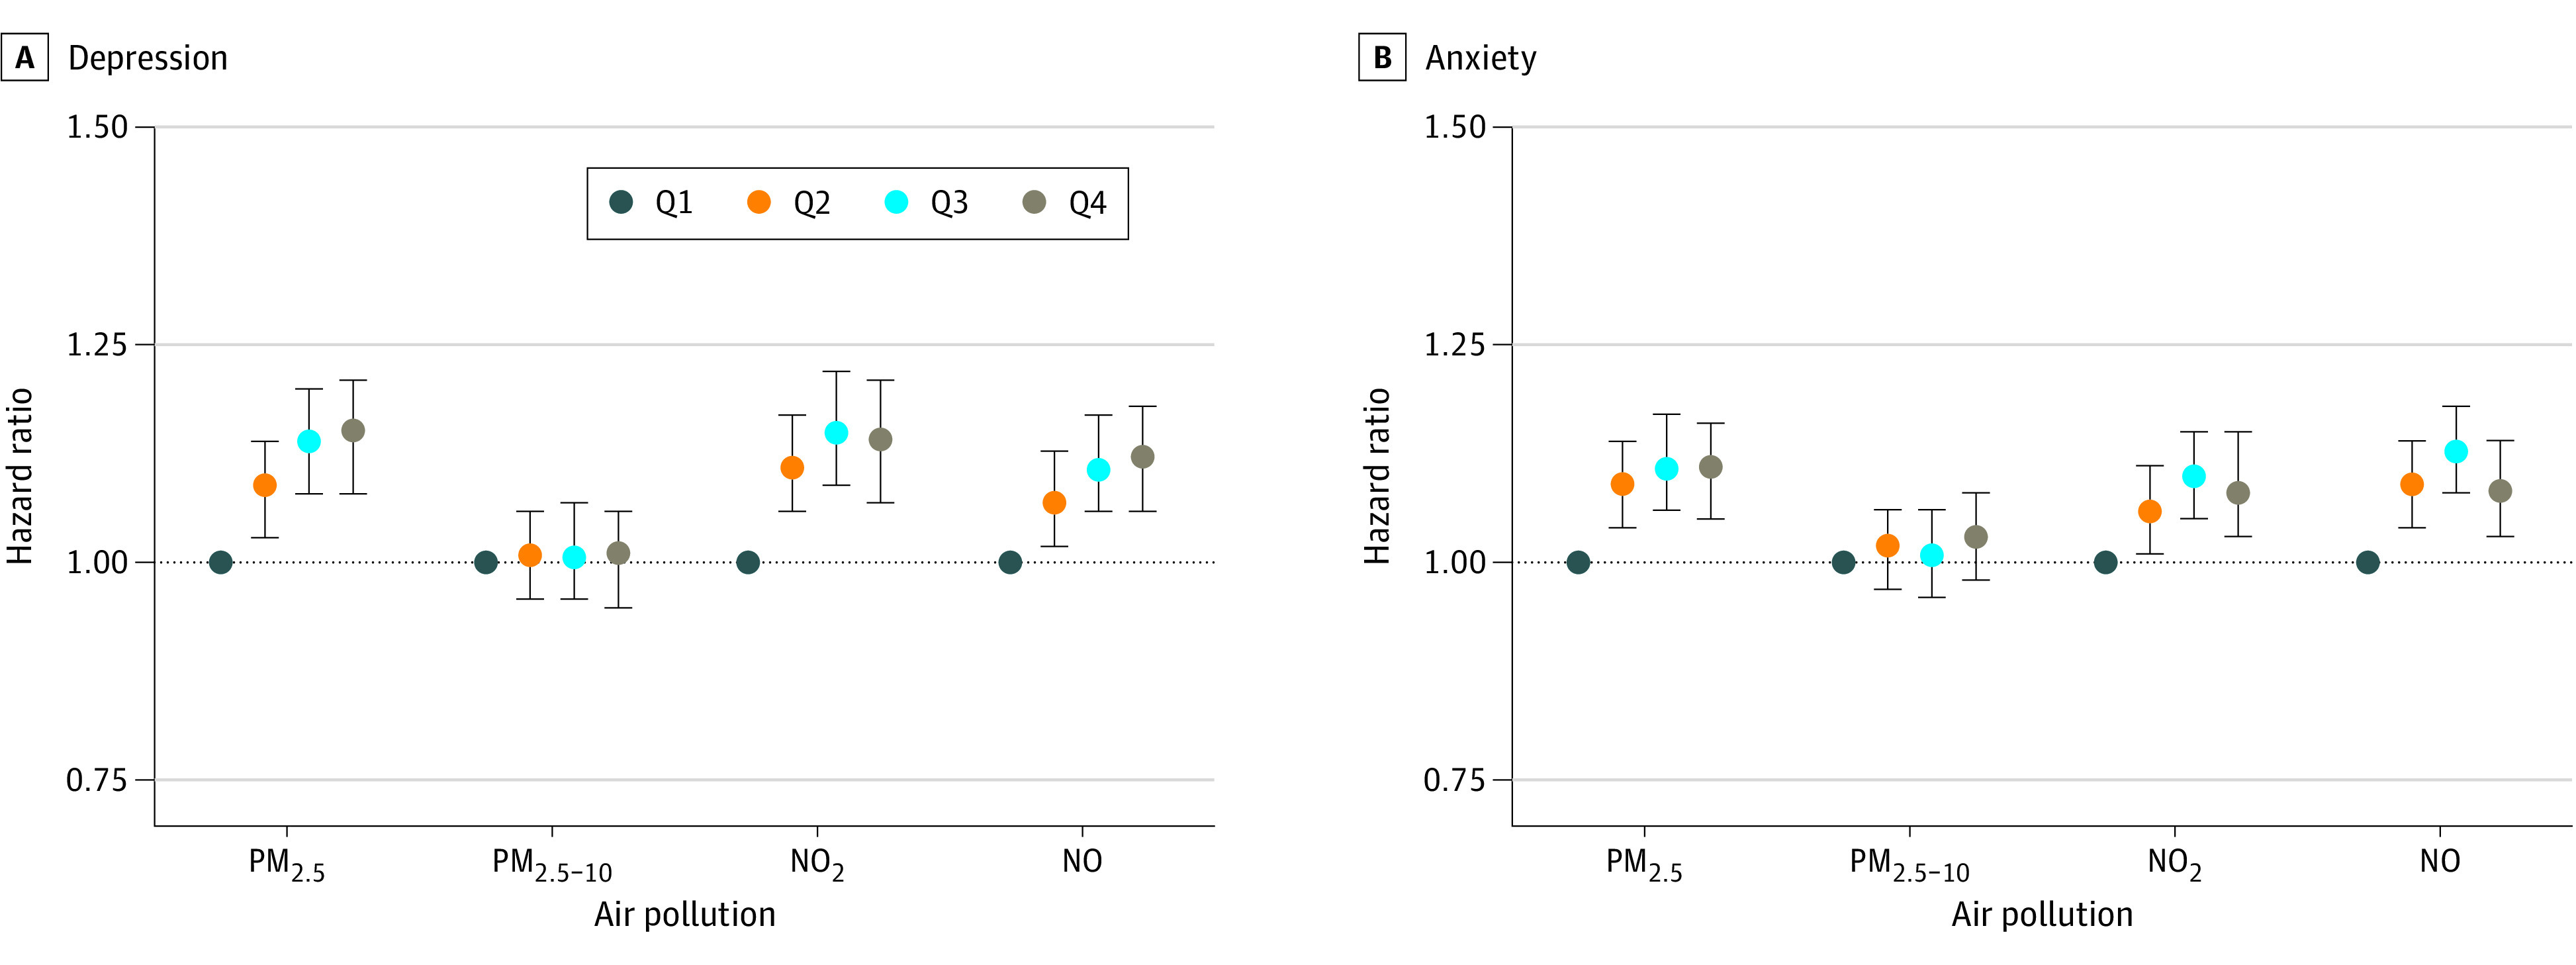
Results: During a median (IQR) follow-up of 10.9 (10.1-11.6) years, among 389 185 participants (mean [SD] age, 56.7 [8.1] years, 205 855 female individuals [52.9%]), a total of 13 131 and 15 835 patients were diagnosed with depression and anxiety, respectively. The median (IQR) concentration of pollutants was as follows: PM2.5, 9.9 (9.3-10.6) μg/m3; PM2.5-10, 6.1 (5.8-6.6) μg/m3; NO2, 26.0 (21.3-31.1) μg/m3; and NO, 15.9 (11.6-20.6) μg/m3. Long-term estimated exposure to multiple air pollutants was associated with increased risk of depression and anxiety, and the exposure-response curves were nonlinear, with steeper slopes at lower concentrations and plateauing trends at higher exposure. The hazard ratios (HRs) and 95% CIs for depression and anxiety were 1.16 (95% CI, 1.09-1.23; P < .001) and 1.11 (95% CI, 1.05-1.17; P < .001) in the highest quartile compared with the lowest quartile of air pollution score, respectively. Similar trends were shown for PM2.5, NO2, and NO. Subgroup analysis showed the association between PM2.5 and anxiety tended to be higher in male individuals than in female individuals (quartile 4: male individuals, 1.18; 95% CI, 1.08-1.29; female individuals, 1.07; 95% CI, 1.00-1.14; P = .009).
Conclusions and relevance: Study results suggest that estimates of long-term exposure to multiple air pollutants was associated with increased risk of depression and anxiety. The nonlinear associations may have important implications for policy making in air pollution control. Reductions in joint exposure to multiple air pollutants may alleviate the disease burden of depression and anxiety.
Conflict of interest statement
Figures
References
-
- GBD 2019 Mental Disorders Collaborators . Global, regional, and national burden of 12 mental disorders in 204 countries and territories, 1990-2019: a systematic analysis for the Global Burden of Disease Study 2019. Lancet Psychiatry. 2022;9(2):137-150. doi:10.1016/S2215-0366(21)00395-3 - DOI - PMC - PubMed
-
- Braithwaite I, Zhang S, Kirkbride JB, Osborn DPJ, Hayes JF. Air pollution (particulate matter) exposure, and associations with depression, anxiety, bipolar, psychosis and suicide risk: a systematic review and meta-analysis. Environ Health Perspect. 2019;127(12):126002. doi:10.1289/EHP4595 - DOI - PMC - PubMed
Publication types
MeSH terms
Substances
Grants and funding
LinkOut - more resources
Full Text Sources
Other Literature Sources
Medical
