. 2023 Feb 1;23(2):1.
doi: 10.1167/jov.23.2.1.

Underestimation of the number of hidden objects

Affiliations

Underestimation of the number of hidden objects

Hui Men et al. J Vis. .

Abstract

The perceptual representation of our environment does not only involve what we actually can see, but also inferences about what is hidden from our sight. For example, in amodal completion, simple contours or surfaces are filled-in behind occluding objects allowing for a complete representation. This is important for many everyday tasks, such as visual search, foraging, and object handling. Although there is support for completion of simple patterns from behavioral and neurophysiological studies, it is unclear if these mechanisms extend to complex, irregular patterns. Here, we show that the number of hidden objects on partially occluded surfaces is underestimated. Observers did not consider accurately the number of visible objects and the proportion of occlusion to infer the number of hidden objects, although these quantities were perceived accurately and reliably. However, visible objects were not simply ignored: estimations of hidden objects increased when the visible objects formed a line across the occluder and decreased when the visible objects formed a line outside of the occluder. Confidence ratings for numerosity estimation were similar for fully visible and partially occluded surfaces. These results suggest that perceptual inferences about what is hidden in our environment can be very inaccurate und underestimate the complexity of the environment.


Figures

Figure 1.
Figure 1.
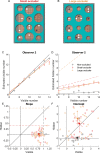
Discrimination of numerosity and visual confidence (experiment 1). (A) Stimulus in the mixed condition, where a non-occluded game board and an occluded game board were displayed simultaneously and had to be compared. (B) Psychometric function for the selection task of one representative observer. Proportion of standard stimulus more numerous is shown as a function of the difference in number between the standard and the comparison stimulus. (C) Psychometric function for the confidence task of one representative observer. Proportion of high confidence responses is shown as a function of the difference in number between the standard and the comparison stimulus. (D) Points of subjective equality (PSE) in the selection and the confidence task. Light colors represent individual observers; saturated colors the mean across observers. Error bars represent 95% confidence intervals. The black diagonal represents values with equal effects in the selection and the confidence task. Black horizontal and vertical lines represent values where occlusion is not taken into account. Dashed red lines represent values where occlusion is completely taken into account according to Equation 4. (E) Histogram of the amplitude modulation of the confidence. Thin vertical lines indicate the mean across observers.
Figure 2.
Figure 2.
Numerosity estimation of visible and hidden objects. (A) Stimulus with a small occluder. (B) Stimulus with a large occluder. (C) Perceived number of visible pieces as a function of actual number of visible pieces for one representative observer. Colored lines represent linear fits of the data; the black line represents accurate estimation. (D) Perceived number of hidden pieces as a function of actual number of visible pieces for one representative observer. Solid lines represent linear fits of the data; dashed lines represent the expected number of hidden pieces obtained from the number of visible pieces and the proportion that the game board was occluded (Equation 4). (E) Slope of the linear fit for the number of visible and hidden pieces. Light colors represent individual observers; saturated colors the mean across observers. Error bars represent 95% confidence intervals. The black diagonal represents values with equal effects for visible and hidden pieces. Colored dashed lines represent expected values for the hidden pieces. The black dashed line represents values of unity, where perceptual estimates of the number of visible pieces is accurate. Black solid lines represent values of zero, where perceptual estimates are independent of the number of visible pieces. (F) Intercept of the linear fit for the number of visible and hidden pieces. Conventions are the same as in E.
Figure 3.
Figure 3.
Bayesian model of the estimation of the number of hidden objects. (A) Likelihood distribution indicating the probability of a certain number of visible pieces given a total number of pieces (Equation 5). (B) Prior distribution with a constant number of total pieces. (C) Posterior distribution, combining the likelihood from A and the prior from B (Equation 6). (D) Average perceived number of hidden pieces for those 11 participants whose data are best explained by the model with a constant prior on the total number of pieces. (E) Prior distribution with a constant number of hidden pieces. (F) Posterior distribution, combining the likelihood from A and the prior from E (Equation 6). (G) Average perceived number of hidden pieces for those 19 participants whose data are best explained by the model with a constant prior on the number of hidden pieces. (H) Model weights for all participants. The horizontal lines indicate the average weight for each of the models. A, B, C, E, and F The grayscale colormap represents probabilities and is normalized for each panel separately to its minimum and maximum to optimize the visibility of individual distributions. In fact, the likelihood distribution is much broader than the prior distribution, such that the posterior is heavily biased towards the prior. D, G Dashed lines represent the ground-truth value according to Equation 4. Solid lines represent model fits.
Figure 4.
Figure 4.
Estimation of occluded area. (A) Stimuli of the original size as in experiments 1 and 2. (B) Stimuli scaled 0.75 times relative to the original size. (C) Estimation of the proportion of the occluded area as a function of the actual occluded area for one representative observer. Solid lines represent linear fits of the data; dashed lines represent values with an accurate match between estimated and actual proportion of the occluded area. (D) Histogram of the slope of the linear fit for the maximum number of hidden pieces. Thin vertical lines indicate the mean across observers. (E) Histogram of the intercept of the linear fit for the maximum number of hidden pieces. Thin vertical lines indicate the mean across observers.
Figure 5.
Figure 5.
Effect of regularity on numerosity estimation of visible and hidden objects. (A, B) Stimuli in the regular-across (left) and regular-outside (right) conditions. (C) Perceived number of visible pieces as a function of actual number of visible pieces for one representative observer. Colored lines represent linear fits of the data; the black line represents accurate estimation. (D) Perceived number of hidden pieces as a function of actual number of visible pieces for one representative observer. Solid lines represent linear fits of the data; dashed lines represent the expected number of hidden pieces obtained from the number of visible pieces and the proportion that the game board was occluded. (E) Slope of the linear fit for the number of visible and hidden pieces. (F) Intercept of the linear fit for the number of visible and hidden pieces. E, F Conventions are the same as in Figure 2E.
Figure 6.
Figure 6.
Numerosity estimation of visible and hidden objects in a naturalistic scene. (A) Stimuli of a night sky with stars and clouds. Observers had to report the number of visible stars, the proportion of the sky covered by clouds and the number of stars hidden by clouds. (B) Perceived number of hidden stars as a function of the objectively expected number of hidden stars for one representative observer. The objectively expected number of hidden stars was obtained from the actual number of visible stars and the actual proportion of the sky covered (Equation 4). The solid line represents the linear fit of the data. (C) Perceived number of hidden stars as a function of subjectively expected number of hidden stars for one representative observer. The subjectively expected number of hidden stars was obtained from the perceived number of visible stars and the perceived proportion of occlusion (Equation 4). The solid line represents the linear fit of the data. (D) Slope of the linear fit for the perceived number of visible stars, the perceived proportion of occlusion, the perceived number of hidden stars as a function of objectively or subjectively expected number of hidden stars. Light colors represent individual observers; saturated colors the mean across observers. Error bars represent 95% confidence intervals. The black solid line represents values of unity, where perceptual estimates are accurate. (E) Intercept of the linear fit for the same quantities as in D. Conventions are the same as in D. (F) Coefficient of determination (R²) of the linear fit for the perceived number of hidden stars (objective and subjective). Error bars represent 95% confidence intervals. The black diagonal represents values with equal effects for objective and subjective expectations.
Figure A1.
Figure A1.
Precision of responses. A) JNDs in the selection and confidence task of Experiment 2. Light colors represent individual observers; saturated colors the mean across observers. Error bars represent 95% confidence intervals. B) Coefficient of variation of the estimation of the number of visible and hidden pieces in Experiment 2. Light colors represent individual observers; saturated colors the mean across observers. Error bars represent 95% confidence intervals. C) Coefficient of variation in the estimation of hidden pieces in the regular-outside and the regular-across conditions of Experiment 4. Light gray represent individual observers; black the mean across observers. Error bars represent 95% confidence intervals. D) Coefficient of variation in the estimation of the number of visible stars and the proportion that the sky was covered. Conventions are the same as in C.

Similar articles

Cited by

References

    1. Anobile, G., Castaldi, E., Moscoso, P. A. M., Burr, D. C., & Arrighi, R. (2020). “Groupitizing”: a strategy for numerosity estimation. Scientific Reports, 10(1), 13436. - PMC - PubMed
    1. Anobile, G., Cicchini, G. M., & Burr, D. C. (2014). Separate mechanisms for perception of numerosity and density. Psychological Science, 25(1), 265–270. - PubMed
    1. Balas, B. (2016). Seeing number using texture: How summary statistics account for reductions in perceived numerosity in the visual periphery. Attention, Perception & Psychophysics, 78(8), 2313–2319. - PMC - PubMed
    1. Binda, P., Morrone, M. C., Ross, J., & Burr, D. C. (2011). Underestimation of perceived number at the time of saccades. Vision Research, 51(1), 34–42. - PubMed
    1. Burnham, K. P., & Anderson, D. R. (Ed.). (2002). Model selection and multimodel inference: A practical information-theoretic approach (2nd ed.). New York, NY: Springer.

Publication types