. 2023 May 1;4(3):208-227.
doi: 10.1158/2643-3230.BCD-22-0128.

Molecular Evolution of Classic Hodgkin Lymphoma Revealed Through Whole-Genome Sequencing of Hodgkin and Reed Sternberg Cells

Affiliations

Molecular Evolution of Classic Hodgkin Lymphoma Revealed Through Whole-Genome Sequencing of Hodgkin and Reed Sternberg Cells

Francesco Maura et al. Blood Cancer Discov. .

Abstract

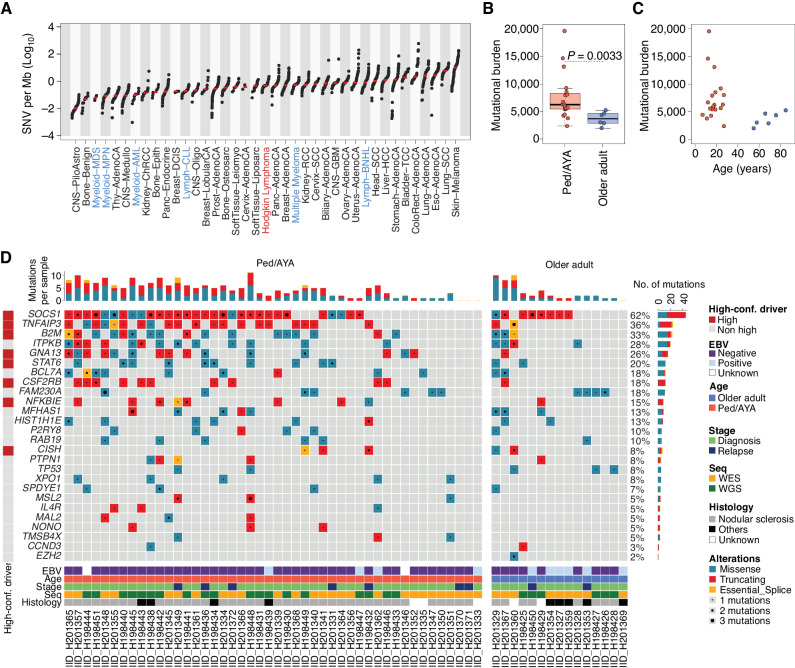
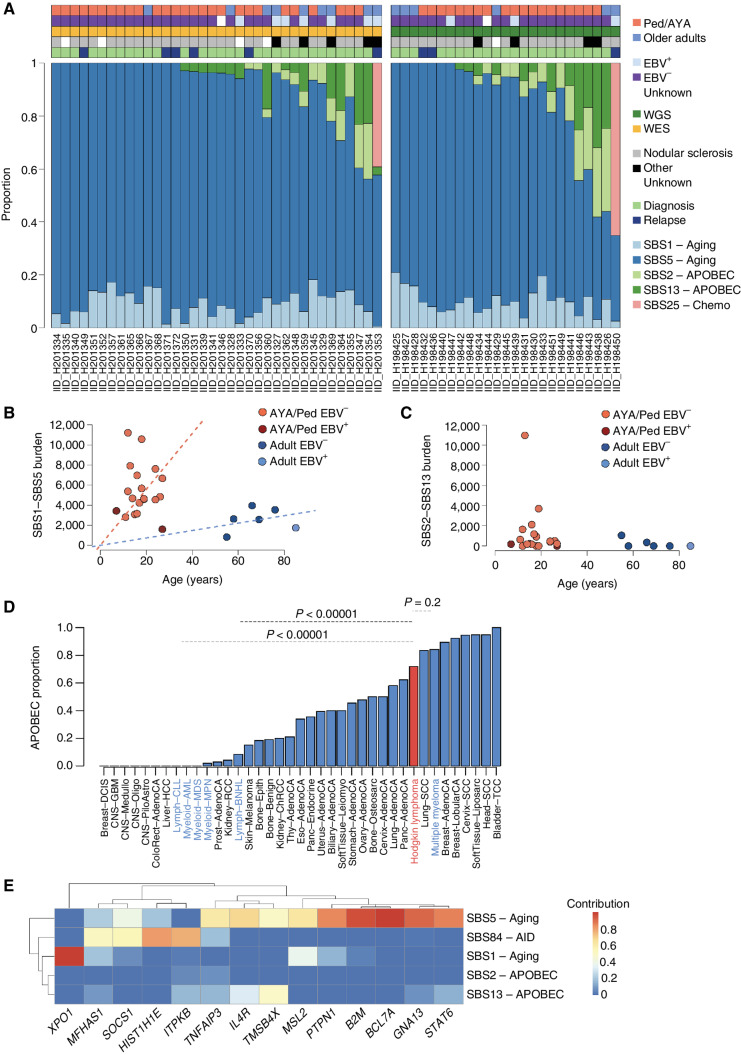
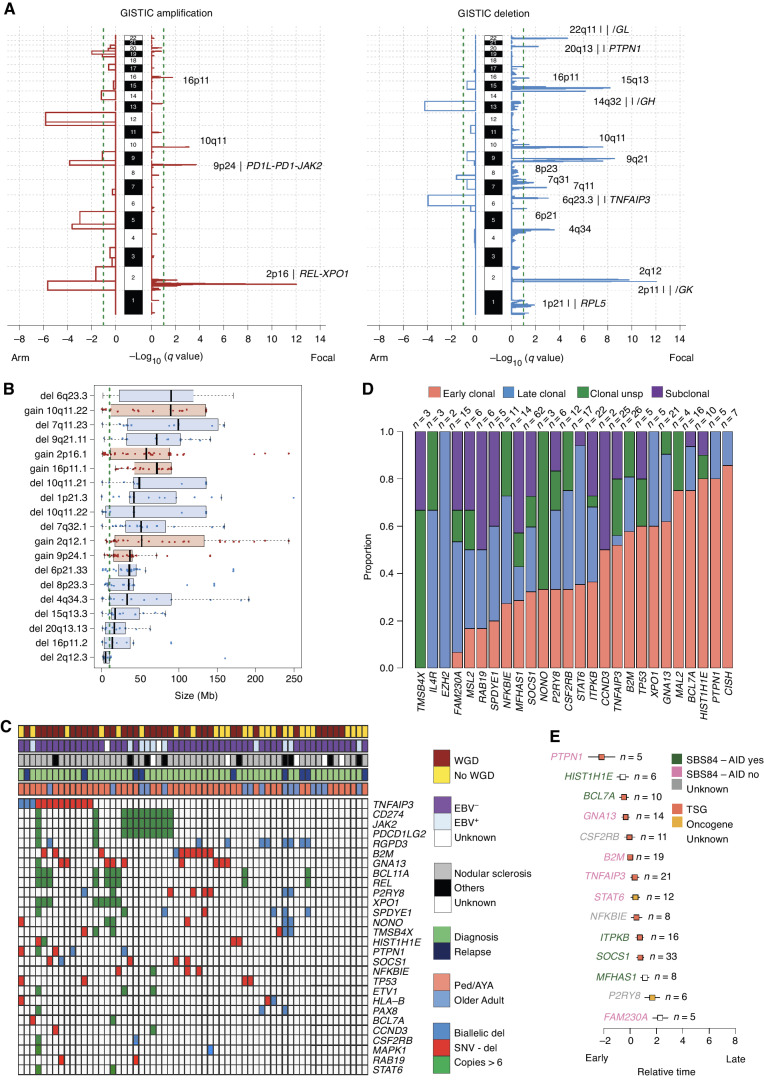
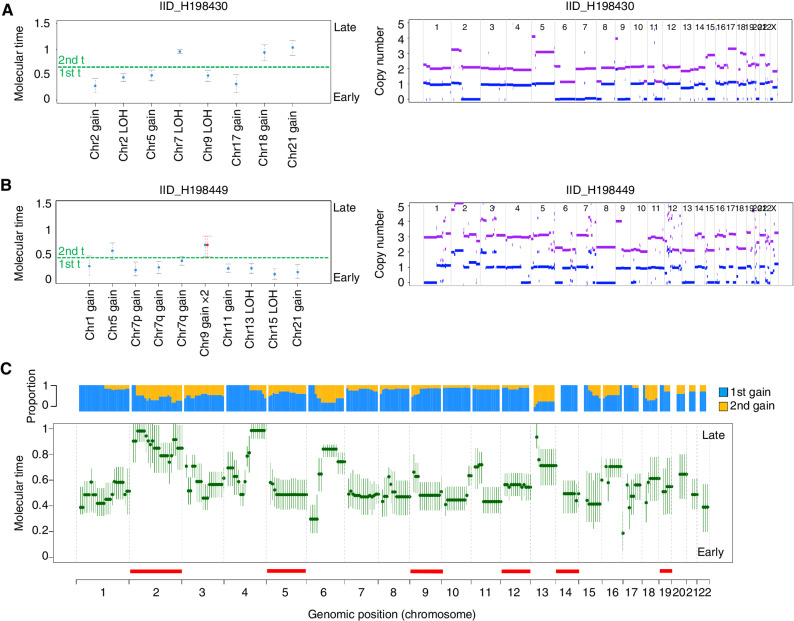
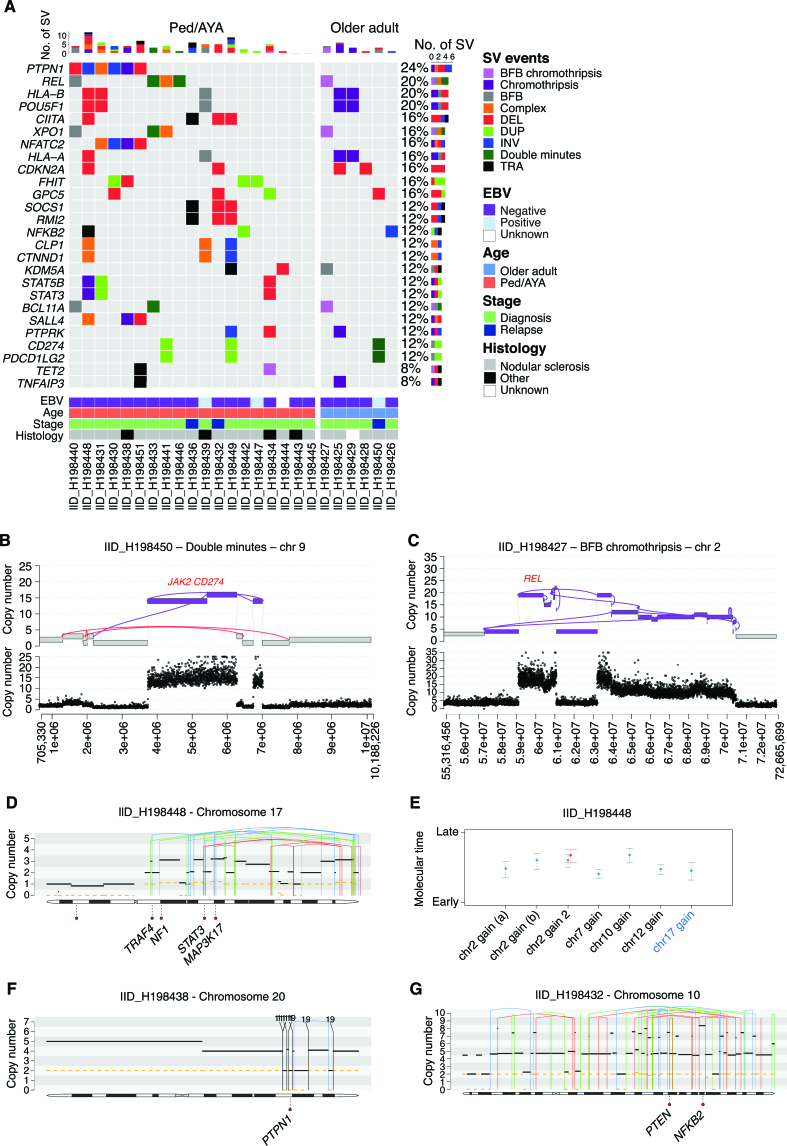
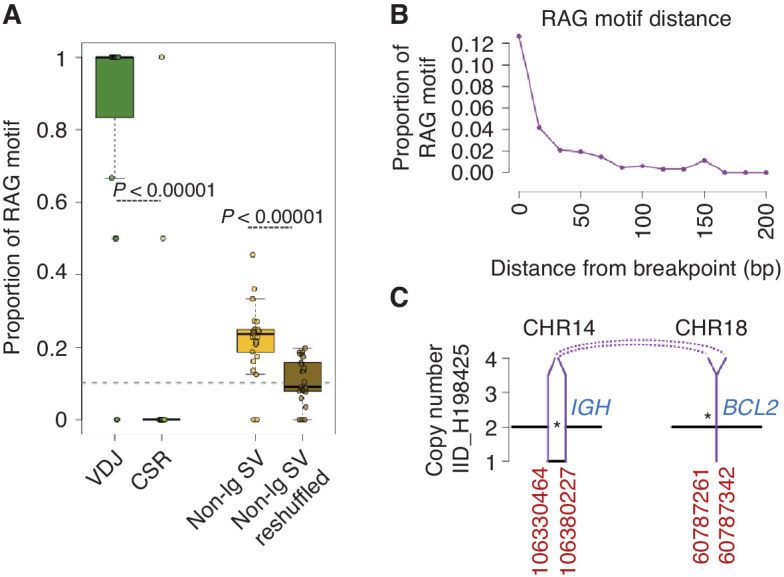
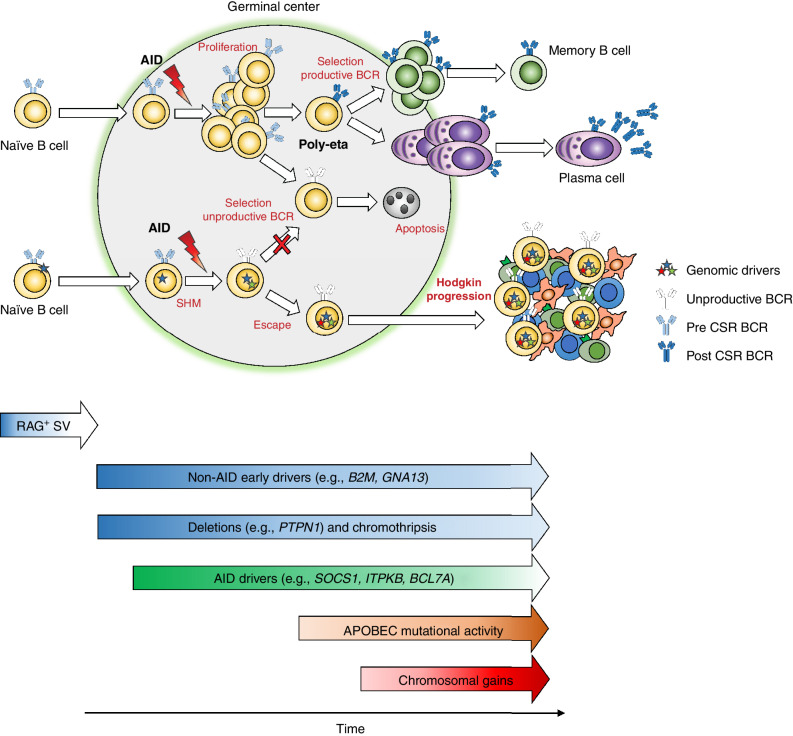
The rarity of malignant Hodgkin and Reed Sternberg (HRS) cells in classic Hodgkin lymphoma (cHL) limits the ability to study the genomics of cHL. To circumvent this, our group has previously optimized fluorescence-activated cell sorting to purify HRS cells. Using this approach, we now report the whole-genome sequencing landscape of HRS cells and reconstruct the chronology and likely etiology of pathogenic events leading to cHL. We identified alterations in driver genes not previously described in cHL, APOBEC mutational activity, and the presence of complex structural variants including chromothripsis. We found that high ploidy in cHL is often acquired through multiple, independent chromosomal gains events including whole-genome duplication. Evolutionary timing analyses revealed that structural variants enriched for RAG motifs, driver mutations in B2M, BCL7A, GNA13, and PTPN1, and the onset of AID-driven mutagenesis usually preceded large chromosomal gains. This study provides a temporal reconstruction of cHL pathogenesis.

Significance: Previous studies in cHL were limited to coding sequences and therefore not able to comprehensively decipher the tumor complexity. Here, leveraging cHL whole-genome characterization, we identify driver events and reconstruct the tumor evolution, finding that structural variants, driver mutations, and AID mutagenesis precede chromosomal gains. This article is highlighted in the In This Issue feature, p. 171.


Figures

Figure 1. cHL mutational landscape. A, WGS mutational burden comparison between cHL (this study) and other cancers included in the PCAWG (n = 2,780) and in MM (n = 71) WGS studies. cHL is highlighted in red, and other hematologic cancers in blue. For each cancer type other than cHL, the total SNV mutational burden was taken from publicly available data (13, 92). The median of each tumor type is annotated with a red line. Tumors are presented in ascending order based on the median mutational burden. B, Whole-genome mutational burden comparison between Ped/AYA (n = 19) and older adults with cHL (n = 6). P value was calculated using the Wilcoxon rank-sum test. Boxplots show the median and interquartile range. C, Correlation between mutational burden and age among Ped/AYA (n = 19, red dot) and older adult (n = 6, blue dot) cases evaluated by WGS. D, Oncoplot summarizing the 26 mutated driver genes/hot spots across 61 cHL patients with available WGS or WES data. A high-confidence driver is defined as a gene that was extracted by at least two of the three driver discovery tools used (OncodriveFML, MutSigCV, and dndscv).
Figure 1.
cHL mutational landscape. A, WGS mutational burden comparison between cHL (this study) and other cancers included in the PCAWG (n = 2,780) and in MM (n = 71) WGS studies. cHL is highlighted in red, and other hematologic cancers in blue. For each cancer type other than cHL, the total SNV mutational burden was taken from publicly available data (13, 93). The median of each tumor type is annotated with a red line. Tumors are presented in ascending order based on the median mutational burden. B, Whole-genome mutational burden comparison between Ped/AYA (n = 19) and older adults with cHL (n = 6). P value was calculated using the Wilcoxon rank-sum test. Box plots show the median and interquartile range. C, Correlation between mutational burden and age among Ped/AYA (n = 19, red dot) and older adult (n = 6, blue dot) cases evaluated by WGS. D, Oncoplot summarizing the 26 mutated driver genes/hot spots across 61 cHL patients with available WGS or WES data. A high-confidence (conf.) driver is defined as a gene that was extracted by at least two of the three driver discovery tools used (OncodriveFML, MutSigCV, and dndscv). EBV, Epstein-Barr Virus; Seq, sequencing.
Figure 2. Mutational signatures in cHL. A, Contribution of mutational signatures across 25 and 36 cHL cases with available WGS and WES data, respectively. B and C, Linear regression showing the association between age and SBS1/SBS5 mutational burden (top) and SBS2/SBS13 (bottom) among the 25 cases evaluated by WGS. D, Proportion of patients with any APOBEC activity across cHL and other cancers included in the PCAWG and MM WGS studies. cHL is highlighted in red, and other hematologic cancers in blue. E, Mutational signatures contribution among all coding mutations occurring within recurrently mutated driver genes with at least 10 SBS (n = 61 cases evaluated by either WGS or WES).
Figure 2.
Mutational signatures in cHL. A, Contribution of mutational signatures across 25 and 36 cHL cases with available WGS and WES data, respectively. B and C, Linear regression showing the association between age and SBS1/SBS5 mutational burden (top) and SBS2/SBS13 (bottom) among the 25 cases evaluated by WGS. D, Proportion of patients with any APOBEC activity across cHL and other cancers included in the PCAWG and MM WGS studies. cHL is highlighted in red, and other hematologic cancers in blue. E, Mutational signatures contribution among all coding mutations occurring within recurrently mutated driver genes with at least 10 SBS (n = 61 cases evaluated by either WGS or WES).
Figure 3. CNA in cHL. A, Significant CNA GISTIC2.0 peaks and involved genes. B, Size of all CNAs involving GISTIC peaks. The gray dashed line represents 10 Mb, and the threshold used to differentiate focal and large events. Black bars represent the standard error of the mean. C, Heat map summarizing biallelic events and high-level gains (>6 copies) involving driver genes extracted by GISTIC (n = 21) and by dndscv (n = 26) in at least two cases. D, Proportion of early clonal (duplicated clonal mutations within duplicated copy number), clonal unsp. (unspecified, clonal mutations within diploid or deleted copy-number segments), late clonal (nonduplicated clonal mutations within duplicated copy-number segment), subclonal mutations in cHL driver genes. E, Chronological order of mutations in 14 cHL driver genes observed in 5 or more patients. Relative order of mutation acquisition is based on pairwise precedence among driver genes and their relative timing (from D) shown in the Bradley–Terry plot. X axis reflects the relative order of acquisition combining all cases. Red dots indicate the point estimate and black lines indicate 95% confidence intervals of gene ordering in time. Genes are positioned along the y-axis on the basis of their relative order. Because this analysis is based on pairwise precedence among driver genes, not all mutations involving driver genes were included. For example, if gene A is earlier than B in one patient, both mutations will be included in the model. In contrast, if in a patient it is impossible to define the chronological order of A and B, these mutations will not be included. Asterisks represent genes involved by SHM (i.e., significant ratio between coding and noncoding mutations; Supplementary Table S11). Genes with less than 10 SBS were not included in the individual driver gene SBS signature analysis and are reported as “unknown.”
Figure 3.
CNA in cHL. A, Significant CNA GISTIC2.0 peaks and involved genes. B, Size of all CNAs involving GISTIC peaks. The gray dashed line represents 10 Mb, and the threshold used to differentiate focal and large events. Black bars represent the standard error of the mean. C, Heat map summarizing biallelic events and high-level gains (>6 copies) involving driver genes extracted by GISTIC (n = 21) and by dndscv (n = 26) in at least two cases. D, Proportion of early clonal (duplicated clonal mutations within duplicated copy number), clonal unsp. (unspecified, clonal mutations within diploid or deleted copy-number segments), late clonal (nonduplicated clonal mutations within duplicated copy-number segment), subclonal mutations in cHL driver genes. E, Chronological order of mutations in 14 cHL driver genes observed in 5 or more patients. Relative order of mutation acquisition is based on pairwise precedence among driver genes and their relative timing (from D) shown in the Bradley–Terry plot. X axis reflects the relative order of acquisition combining all cases. Red dots indicate the point estimate and black lines indicate 95% confidence intervals of gene ordering in time. Genes are positioned along the y axis on the basis of their relative order. Because this analysis is based on pairwise precedence among driver genes, not all mutations involving driver genes were included. For example, if gene A is earlier than B in one patient, both mutations will be included in the model. In contrast, if in a patient it is impossible to define the chronological order of A and B, these mutations will not be included. Asterisks represent genes involved by SHM (i.e., significant ratio between coding and noncoding mutations; Supplementary Table S11). Genes with less than 10 SBS were not included in the individual driver gene SBS signature analysis and are reported as “unknown.” TSG, tumor suppressor gene.
Figure 4. Molecular time and in cHL. A and B, Two examples showing molecular time estimates for two cases with multiple gains. Left, the molecular time (blue dots) was estimated for each clonal gain and copy-neutral LOH with more than 50 clonal SNVs. Red dots represent the molecular time of a second gain occurring on a previous one. The dashed green line divides the two independent time windows in which different chromosomal gains were acquired (first t: first-time window; second t: second-time window. Right, standard copy-number profile of 2 cHL cases. Horizontal purple and blue lines represent the total copy number and minor allele, respectively. C, Median molecular time estimates for chromosomal gains across each chromosome in cHL. Each chromosome was divided into 10-mb bins. Each green dot reflects the median molecular time across different patients with the gained bin. CI were generated using the median of CI molecular time estimate for each bin. Horizontal red line reflects GISTIC large amplifications. The blue/yellow plot represents the distribution of chromosomal gains acquired within either the first- or second-time window for each locus.
Figure 4.
Molecular time and in cHL. A and B, Two examples showing molecular time estimates for two cases with multiple gains. Left, the molecular time (blue dots) was estimated for each clonal gain and copy-neutral LOH with more than 50 clonal SNVs. Red dots represent the molecular time of a second gain occurring on a previous one. The dashed green line divides the two independent time windows in which different chromosomal gains were acquired (first t: first-time window; second t: second-time window. Right, standard copy-number profile of 2 cHL cases. Horizontal purple and blue lines represent the total copy number and minor allele, respectively. C, Median molecular time estimates for chromosomal gains across each chromosome in cHL. Each chromosome was divided into 10-mb bins. Each green dot reflects the median molecular time across different patients with the gained bin. CI were generated using the median of CI molecular time estimate for each bin. Horizontal red line reflects GISTIC large amplifications. The blue/yellow plot represents the distribution of chromosomal gains acquired within either the first- or second-time window for each locus.
Figure 5. SV and complex event in cHL. A, Oncoplot showing cHL driver genes involved by SV and complex events. B and C, Example of complex events involving key cHL drivers. D and E, Example of chromothripsis event in which it was possible to estimate the molecular time. Case IID_H198448 had an intrachromosomal chromothripsis event responsible for multiple large/intermediate chromosomal gain on chromosome 17 (E). The molecular time of this event was similar to other gains acquired in the first/earliest-time window (E). Based on this link, we could estimate that the chromothripsis event was acquired together with the other chromosomal gains (WGD). F and G, Examples of two chromothripsis events that occurred before WGD. The two chromothripsis events were each responsible for a multiple copy-number jump from 2:2 to 2:0. In D, F, and G, the black and dashed yellow horizontal line represent the total number copy number and the minor allele, respectively. The blue, red, green, and black vertical lines represent inversion, deletion, tandem duplication, and translocation, respectively. The partner of each translocation is reported on the top of the vertical black line.
Figure 5.
SV and complex event in cHL. A, Oncoplot showing cHL driver genes involved by SV and complex events. B and C, Example of complex events involving key cHL drivers. D and E, Example of chromothripsis event in which it was possible to estimate the molecular time. Case IID_H198448 had an intrachromosomal chromothripsis event responsible for multiple large/intermediate chromosomal gain on chromosome 17 (E). The molecular time of this event was similar to other gains acquired in the first/earliest-time window (E). Based on this link, we could estimate that the chromothripsis event was acquired together with the other chromosomal gains (WGD). F and G, Examples of two chromothripsis events that occurred before WGD. The two chromothripsis events were each responsible for a multiple copy-number jump from 2:2 to 2:0. In D, F, and G, the black and dashed yellow horizontal line represent the total number copy number and the minor allele, respectively. The blue, red, green, and black vertical lines represent inversion, deletion, tandem duplication, and translocation, respectively. The partner of each translocation is reported on the top of the vertical black line.
Figure 6. cHL SVs are enriched for RAG motifs. A, Proportion of RAG motif-enriched SVs across SVs within the VDJ (VDJ), SVs within the class switch recombination (CSR), SVs outside of the immunoglobulin genes (Non-Ig SV), and reshuffling all the nonimmunoglobulin SVs across the genome (Non-Ig SV reshuffled). The gray dashed line represents the genomic background rate of RAG motifs. Each dot represents the proportion of RAG-positive breakpoints for each patient. B, The proportion of SV with an RSS (RAG) motif as a function of distance from their breakpoint. C, Example of a likely RAG-mediated BCL2::IGH translocation in one HL case.
Figure 6.
cHL SVs are enriched for RAG motifs. A, Proportion of RAG motif-enriched SVs across SVs within the VDJ (VDJ), SVs within the class switch recombination (CSR), SVs outside of the immunoglobulin genes (Non-Ig SV), and reshuffling all the nonimmunoglobulin SVs across the genome (Non-Ig SV reshuffled). The gray dashed line represents the genomic background rate of RAG motifs. Each dot represents the proportion of RAG-positive breakpoints for each patient. B, The proportion of SV with an RSS (RAG) motif as a function of distance from their breakpoint. C, Example of a likely RAG-mediated BCL2::IGH translocation in one HL case.
Figure 7. Proposed model of the molecular timing of events leading to classic Hodgkin lymphoma. Our data suggest that the initiating event in cHL can occur in a naïve B-cell prior to entry in the germinal center as evidenced by potential RAG-mediated SVs. Other early events include alterations in non–AID-mediated drivers such as B2M and GNA13 as well as deletions in PTPN1 and chromothripsis. In the GC, the premalignant cell undergoes somatic hypermutation without finalizing its maturation for unproductive BCR in most cases. Acquisition of AID-mediated events in off-target genes is not limited to early phases of cancer development, and it might be proceeded by other drivers. APOBEC mutational activity and chromosomal gains are both present in cHL and occur as intermediate/late events in cHL pathogenesis.
Figure 7.
Proposed model of the molecular timing of events leading to classic Hodgkin lymphoma. Our data suggest that the initiating event in cHL can occur in a naïve B cell prior to entry in the germinal center as evidenced by potential RAG-mediated SVs. Other early events include alterations in non–AID-mediated drivers such as B2M and GNA13 as well as deletions in PTPN1 and chromothripsis. In the GC, the premalignant cell undergoes somatic hypermutation without finalizing its maturation for unproductive BCR in most cases. Acquisition of AID-mediated events in off-target genes is not limited to early phases of cancer development, and it might be proceeded by other drivers. APOBEC mutational activity and chromosomal gains are both present in cHL and occur as intermediate/late events in cHL pathogenesis.

Comment in

References

    1. Mathas S, Hartmann S, Kuppers R. Hodgkin lymphoma: pathology and biology. Semin Hematol 2016;53:139–47. - PubMed
    1. Reichel J, Chadburn A, Rubinstein PG, Giulino-Roth L, Tam W, Liu Y, et al. Flow sorting and exome sequencing reveal the oncogenome of primary Hodgkin and Reed-Sternberg cells. Blood 2015;125:1061–72. - PubMed
    1. Green MR, Monti S, Rodig SJ, Juszczynski P, Currie T, O'Donnell E, et al. Integrative analysis reveals selective 9p24.1 amplification, increased PD-1 ligand expression, and further induction via JAK2 in nodular sclerosing Hodgkin lymphoma and primary mediastinal large B-cell lymphoma. Blood 2010;116:3268–77. - PMC - PubMed
    1. Joos S, Kupper M, Ohl S, von Bonin F, Mechtersheimer G, Bentz M, et al. Genomic imbalances including amplification of the tyrosine kinase gene JAK2 in CD30+ Hodgkin cells. Cancer Res 2000;60:549–52. - PubMed
    1. Joos S, Menz CK, Wrobel G, Siebert R, Gesk S, Ohl S, et al. Classical Hodgkin lymphoma is characterized by recurrent copy number gains of the short arm of chromosome 2. Blood 2002;99:1381–7. - PubMed

Publication types