

Predicting physician departure with machine learning on EHR use patterns: A longitudinal cohort from a large multi-specialty ambulatory practice
- PMID: 36724149
- PMCID: PMC9891518
- DOI: 10.1371/journal.pone.0280251
Predicting physician departure with machine learning on EHR use patterns: A longitudinal cohort from a large multi-specialty ambulatory practice
Erratum in
-
Correction: Predicting physician departure with machine learning on EHR use patterns: A longitudinal cohort from a large multi-specialty ambulatory practice.PLoS One. 2024 Dec 3;19(12):e0315090. doi: 10.1371/journal.pone.0315090. eCollection 2024. PLoS One. 2024. PMID: 39625911 Free PMC article.
Abstract
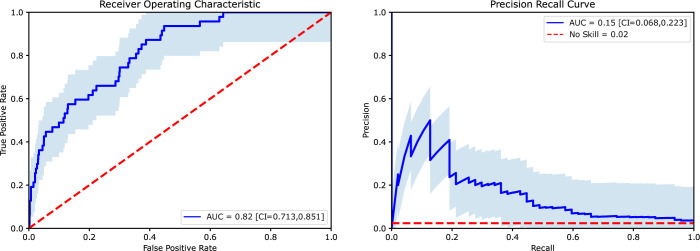
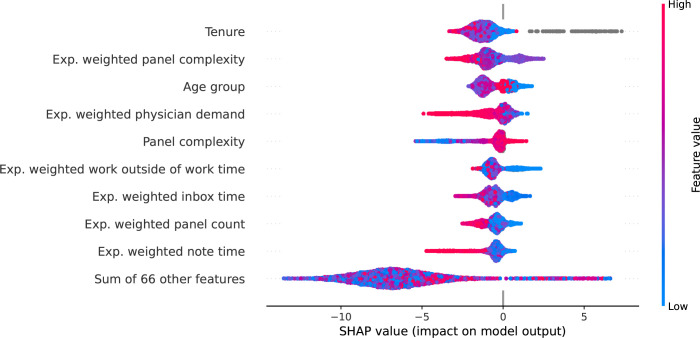
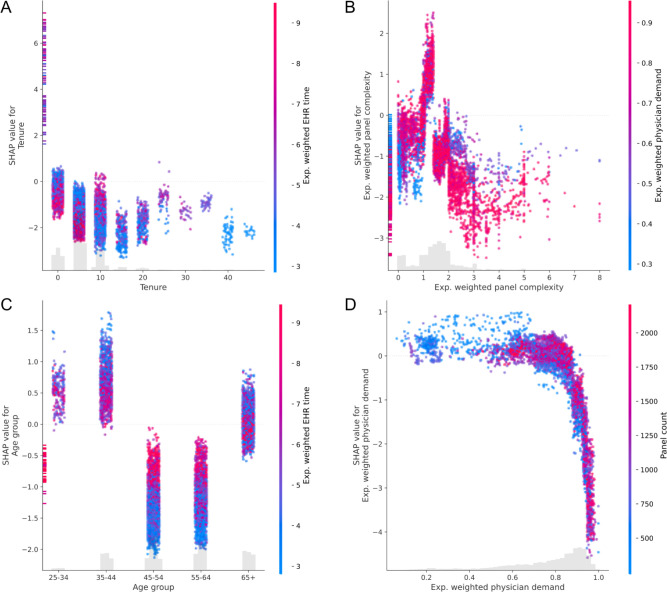
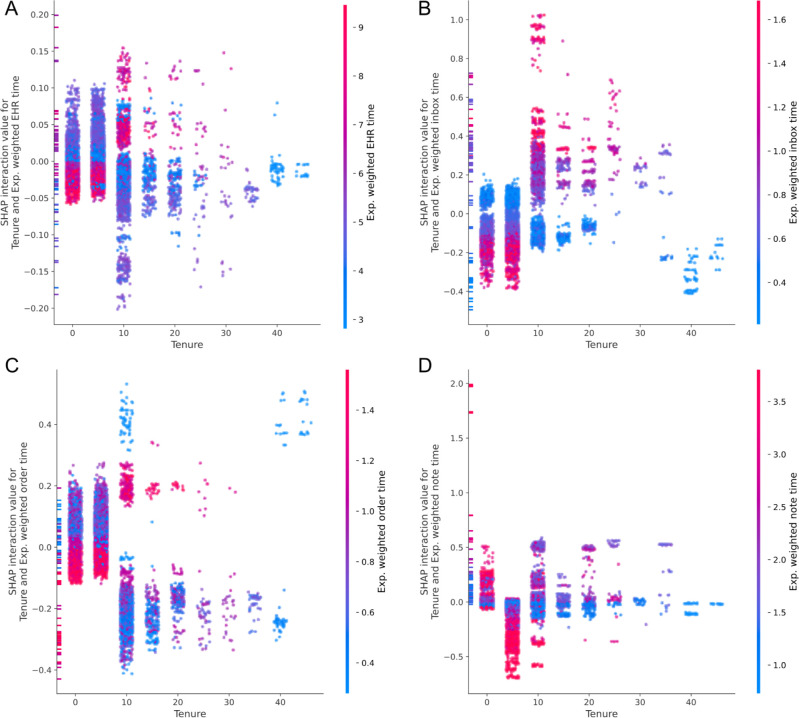
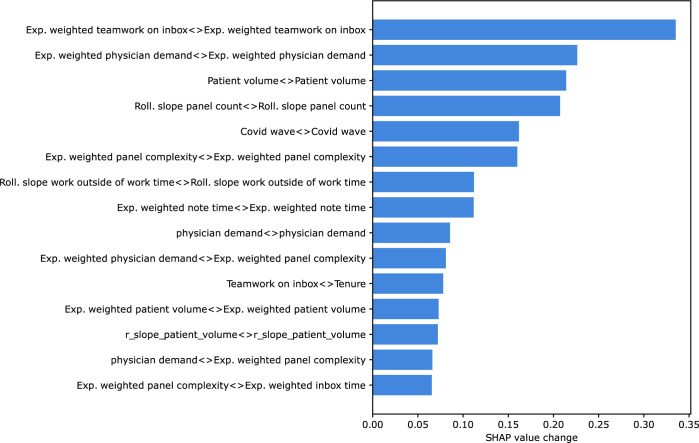
Physician turnover places a heavy burden on the healthcare industry, patients, physicians, and their families. Having a mechanism in place to identify physicians at risk for departure could help target appropriate interventions that prevent departure. We have collected physician characteristics, electronic health record (EHR) use patterns, and clinical productivity data from a large ambulatory based practice of non-teaching physicians to build a predictive model. We use several techniques to identify possible intervenable variables. Specifically, we used gradient boosted trees to predict the probability of a physician departing within an interval of 6 months. Several variables significantly contributed to predicting physician departure including tenure (time since hiring date), panel complexity, physician demand, physician age, inbox, and documentation time. These variables were identified by training, validating, and testing the model followed by computing SHAP (SHapley Additive exPlanation) values to investigate which variables influence the model's prediction the most. We found these top variables to have large interactions with other variables indicating their importance. Since these variables may be predictive of physician departure, they could prove useful to identify at risk physicians such who would benefit from targeted interventions.
Copyright: This is an open access article, free of all copyright, and may be freely reproduced, distributed, transmitted, modified, built upon, or otherwise used by anyone for any lawful purpose. The work is made available under the Creative Commons CC0 public domain dedication.
Conflict of interest statement
The authors have declared that no competing interests exist.
Figures
References
-
- Plomondon ME, Magid DJ, Steiner JF, MaWhinney S, Gifford BD, Shih SC, et al. Primary care provider turnover and quality in managed care organizations. Am J Manag Care. 2007. Aug;13(8):465–72. - PubMed
-
- Fibuch Eugene, MD CPE, CHCQM FACPE, FABQAUR Msph AAB. PHYSICIAN TURNOVER: A COSTLY PROBLEM [Internet]. Vol. 2, Physician Leadership Journal; Tampa volume. United States—US, US Minor Outlying Islands, Tampa: American Association for Physician Leadership; 2015. p. 22–5. Available from: https://www.proquest.com/scholarly-journals/physician-turnover-costly-pr... - PubMed
Publication types
MeSH terms
Grants and funding
LinkOut - more resources
Full Text Sources
