. 2023 Feb 3;9(5):eade9585.
doi: 10.1126/sciadv.ade9585. Epub 2023 Feb 1.

NRF2 controls iron homeostasis and ferroptosis through HERC2 and VAMP8

Affiliations

NRF2 controls iron homeostasis and ferroptosis through HERC2 and VAMP8

Annadurai Anandhan et al. Sci Adv. .

Abstract

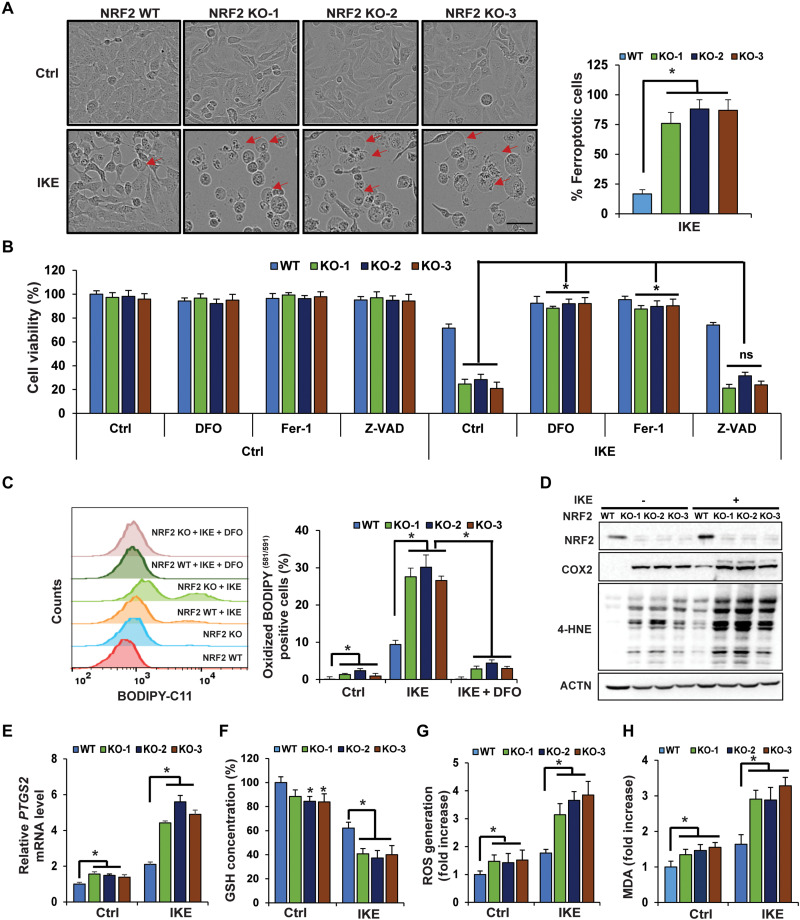
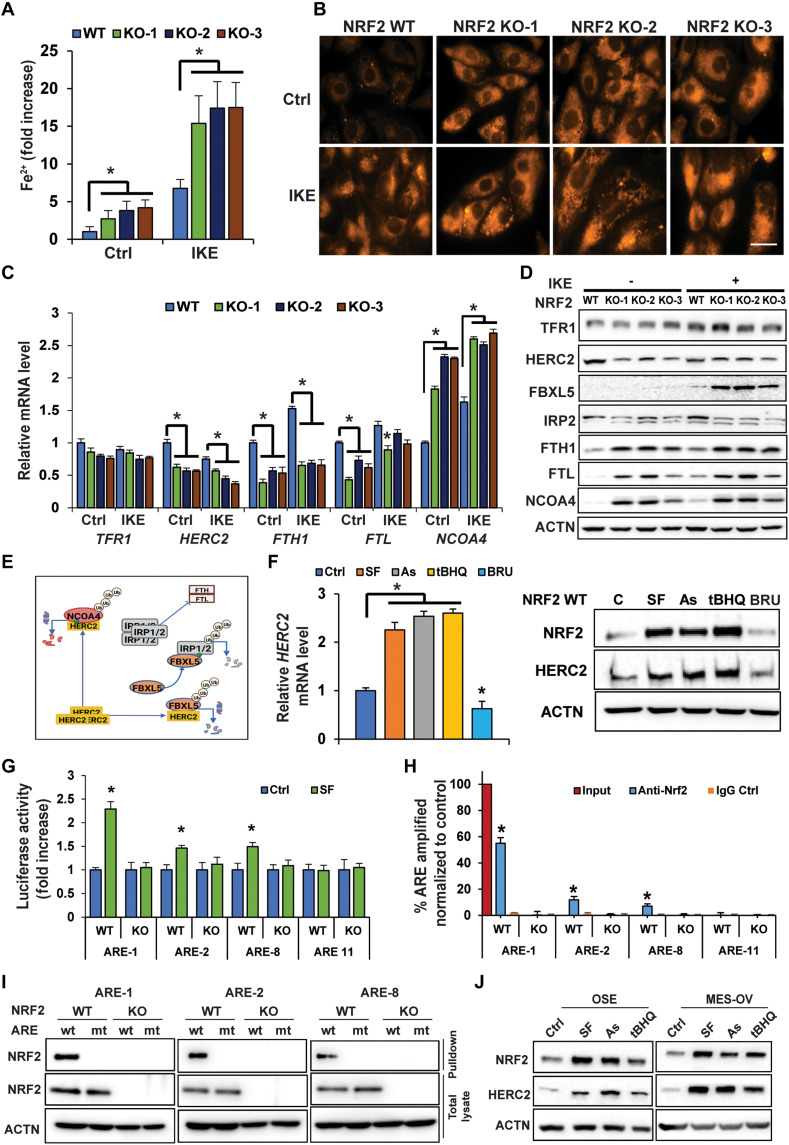
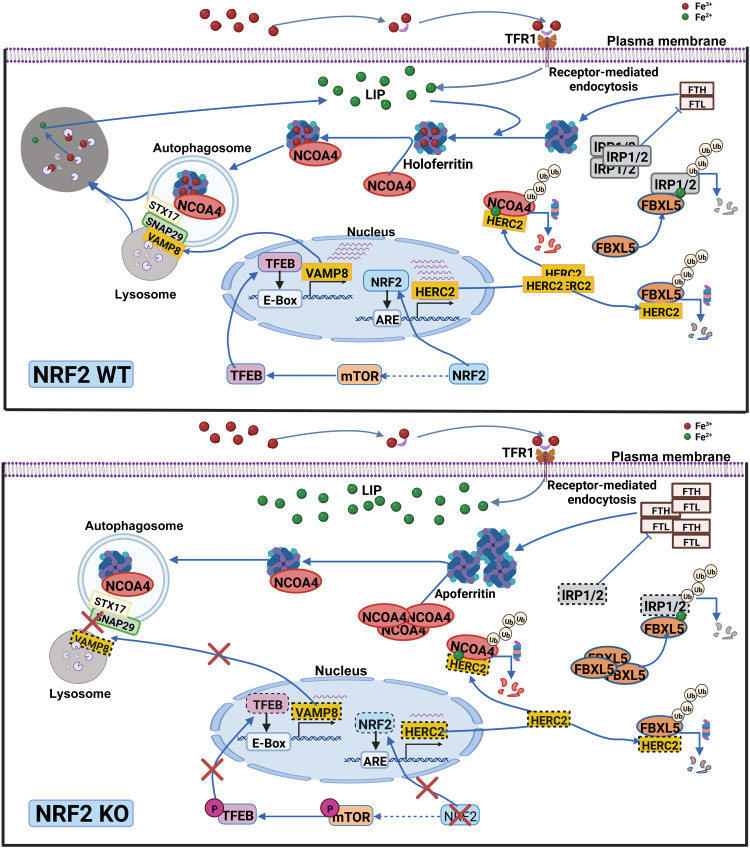
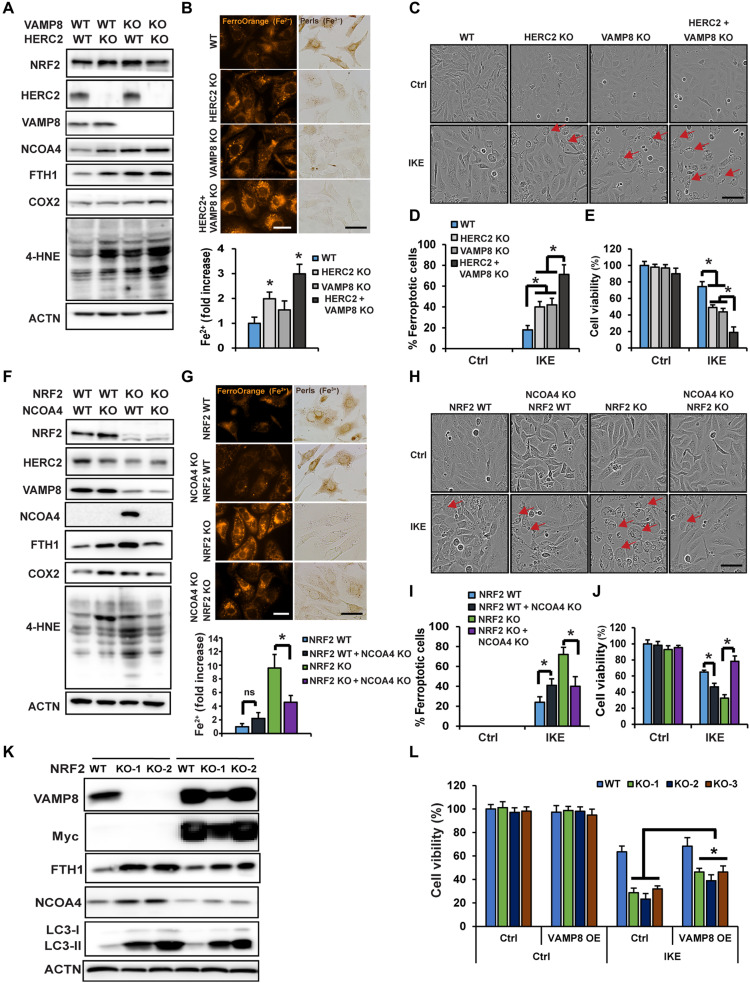
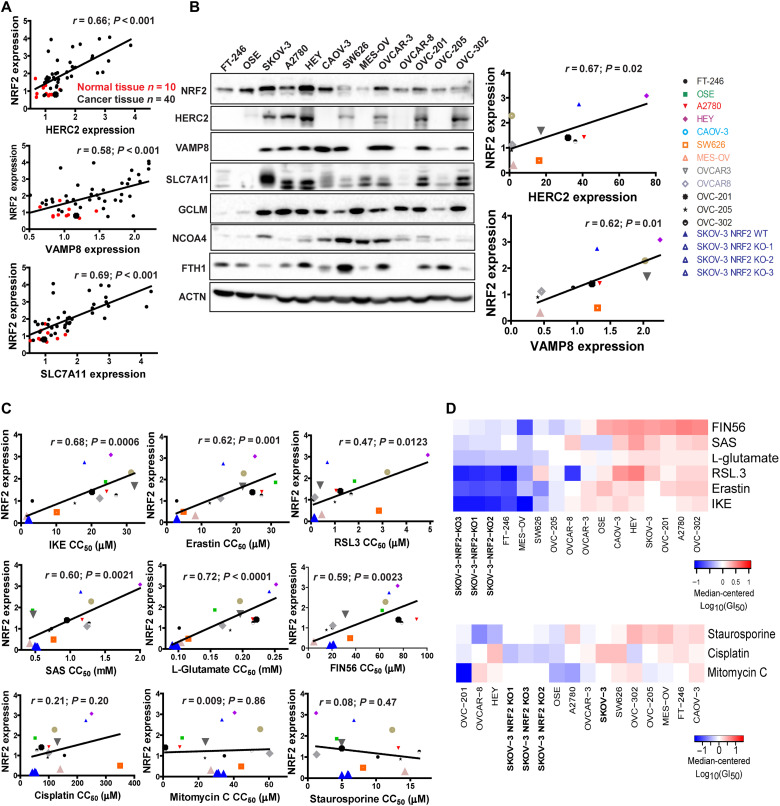
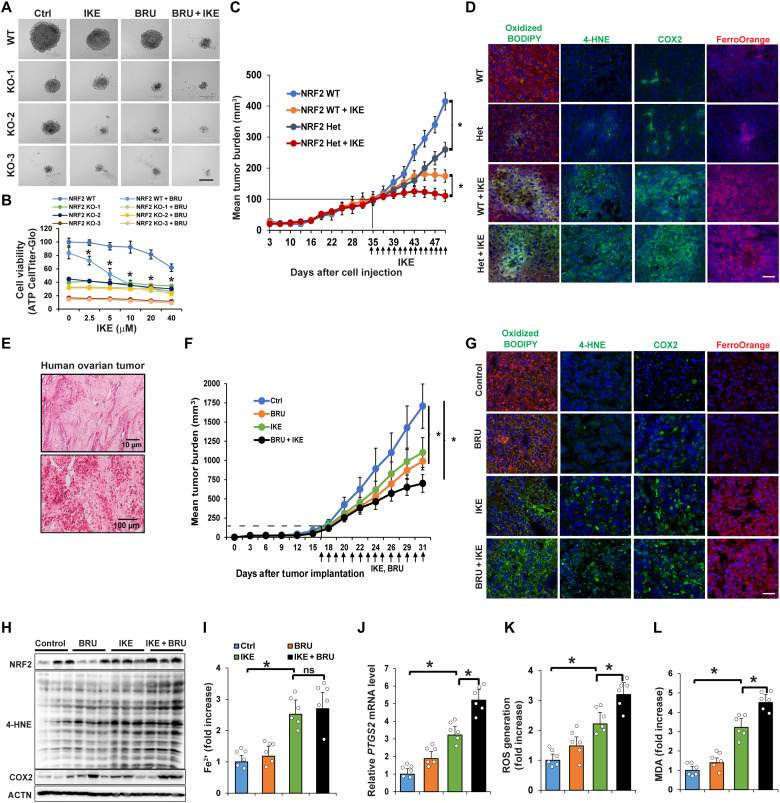
Enhancing the intracellular labile iron pool (LIP) represents a powerful, yet untapped strategy for driving ferroptotic death of cancer cells. Here, we show that NRF2 maintains iron homeostasis by controlling HERC2 (E3 ubiquitin ligase for NCOA4 and FBXL5) and VAMP8 (mediates autophagosome-lysosome fusion). NFE2L2/NRF2 knockout cells have low HERC2 expression, leading to a simultaneous increase in ferritin and NCOA4 and recruitment of apoferritin into the autophagosome. NFE2L2/NRF2 knockout cells also have low VAMP8 expression, which leads to ferritinophagy blockage. Therefore, deletion of NFE2L2/NRF2 results in apoferritin accumulation in the autophagosome, an elevated LIP, and enhanced sensitivity to ferroptosis. Concordantly, NRF2 levels correlate with HERC2 and VAMP8 in human ovarian cancer tissues, as well as ferroptosis resistance in a panel of ovarian cancer cell lines. Last, the feasibility of inhibiting NRF2 to increase the LIP and kill cancer cells via ferroptosis was demonstrated in preclinical models, signifying the impact of NRF2 inhibition in cancer treatment.


Figures

Fig. 1.
Fig. 1.. NFE2L2/NRF2 deletion sensitizes ovarian cancer cells to ferroptosis.
(A) WT or three individual CRISPR NFE2L2/NRF2 KO SKOV-3 ovarian cancer cell lines were left untreated or treated with IKE (10 μM), and cell growth was monitored using the IncuCyte imaging system. Results shown here were at 24 hours after treatment. Ferroptotic cells were identified on the basis of ferroptotic cell morphology (ballooning). More than 1000 cells were counted, and the percentage of ferroptotic cells was plotted. Scale bar, 50 μm. (B) NFE2L2/NRF2 WT and KO cell lines were cotreated with DFO (100 μM), Fer-1 (10 μM), or Z-VAD-fmk (20 μM), alone with DMSO or IKE (10 μM) for 24 hours. Cell viability was measured by MTT assay. ns, not significant. (C to H) NFE2L2/NRF2 WT and KO cell lines were treated with 10 μM IKE for 12 hours before the following end points were measured: (C) Lipid peroxide production was assessed by flow cytometry using C11-BODIPY581/591. DFO cotreatment: 100 μM, 12 hours. (D) 4-Hydroxynonenal (4-HNE) protein adducts and COX2 protein levels were measured by immunoblot analysis. (E) mRNA levels of PTGS2 were measured by quantitative reverse transcription polymerase chain reaction (qRT-PCR). (F) Total intracellular GSH levels were measured by QuantiChrom GSH assay. (G) ROS were measured by electron paramagnetic resonance (EPR) spectroscopy. (H) Malondialdehyde (MDA) formation was detected colorimetrically using the thiobarbituric acid reactive substance (TBARS) assay. Data are represented as means ± SEM of three biological replicates. n = 3; *P < 0.05.
Fig. 2.
Fig. 2.. NFE2L2/NRF2 deletion impairs iron homeostasis and increases the LIP through depletion of its target gene HERC2.
(A and B) NFE2L2/NRF2 WT and KO SKOV-3 cell lines were treated with 10 μM IKE for 12 hours before the LIP was measured by (A) Ferene-S absorbance (*P < 0.05, n = 3) or (B) FerroOrange immunofluorescence. Scale bar, 25 μm. (C and D) mRNA or protein levels of genes involved in iron metabolism/storage were measured in NFE2L2/NRF2 WT and NFE2L2/NRF2 KO SKOV-3 cells treated with IKE (10 μM, 12 hours) by (C) qRT-PCR (*P < 0.05, n = 3) or (D) immunoblot analysis. (E) Model showing HERC2 regulation of ferritin synthesis and NCOA4-mediated ferritin degradation. Green dot = ferrous iron; Ub, ubiquitin. (F) HERC2 mRNA (right; *P < 0.05, n = 3) and protein levels (left) in NFE2L2/NRF2 WT SKOV-3 cells treated with DMSO (Ctrl), sulforaphane (SF; 5 μM), arsenic (As; 1 μM), tert-butylhydroquinone (tBHQ; 25 μM), or brusatol (BRU; 20 nM) for 12 hours. (G) NFE2L2/NRF2 WT SKOV-3 cells were transfected with the indicated antioxidant response element (ARE) firefly and thymidine kinase renilla luciferase vectors and then treated with DMSO or SF (5 μM) for 12 hours, and luciferase activity was measured. *P < 0.05, n = 3. (H) NRF2-ARE binding was determined via ChIP-PCR. *P < 0.05, n = 3. (I) Biotinylated ARE pulldown of three putative HERC2 WT or mutant (mt) AREs using cell lysate from NFE2L2/NRF2 WT or NFE2L2/NRF2 KO SKOV-3 cells. DNA binding proteins were pulled down using streptavidin beads, and NRF2 was detected by immunoblot analysis. (J) NRF2 and HERC2 protein levels in ovarian surface epithelial (OSE) and MES-OV ovarian cell lines following treatment with SF (5 μM), As (1 μM), or tBHQ (25 μM) for 12 hours.
Fig. 3.
Fig. 3.. VAMP8 down-regulation in NFE2L2/NRF2 KO cells results in a defect of ferritinophagy and autophagosomal accumulation of apoferritin/NCOA4.
(A) Illustration of the ferritinophagy pathway. (B) Immunofluorescence analysis of autophagy flux in NFE2L2/NRF2 WT and NFE2L2/NRF2 KO SKOV-3 cells transfected with an mRFP-GFP-LC3 tandem reporter for 24 hours. Yellow puncta, autophagosomes; red puncta, autolysosomes. Scale bar, 10 μm. (C) Representative TEM micrographs of WT and NFE2L2/NRF2 KO cells. Arrows indicate autophagosomes or protein aggregates. (D) Protein levels of three SNARE proteins that direct autophagosome-lysosome fusion. (E) VAMP8 mRNA levels in NFE2L2/NRF2 WT and KO cells. *P < 0.05, n = 3. (F) Total or phosphorylated protein levels of mTOR and TFEB. (G) Nuclear localization of TFEB was detected by indirect immunofluorescence (top); 4′,6-diamidino-2-phenylindole (DAPI) was used for nuclear staining, and the number of TFEB nuclear-positive cells was counted and plotted (bottom). *P < 0.05, n = 3. Scale bar, 50 μm. (H) One functional EBOX in the promoter of VAMP8 was identified. The 41-bp EBOX-containing sequence was shown above. Relative EBOX luciferase activity was measured by dual luciferase assay, following treatment with mTOR inhibitors [torin, 100 nM, 24 hours; rapamycin (Rap), 1 μM, 24 hours; and AICAR, 1 mM, 4 hours] or mTOR activation by amino acids (AA). (I and J) Indirect immunofluorescence of (I) FTH1 and LC3, and (J) FTH1 and LAMP1 in NFE2L2/NRF2 WT or KO SKOV-3 cells. Inset shows magnified puncta. (K) Cells were treated with or without ferric ammonium citrate (FAC; 100 μM, 12 hours). Ferric iron deposits were assessed by Perls Prussian blue staining, followed by indirect immunofluorescence of FTH1/LC3. Scale bars, 10 μm.
Fig. 4.
Fig. 4.. NRF2 regulates iron homeostasis through HERC2, VAMP8, and NCOA4.
NRF2 regulates iron homeostasis by controlling both ferritin synthesis and degradation. First, HERC2, an E3 ubiquitin ligase for FBXL5 and NCOA4, is an NRF2 target gene; deletion of NFE2L2/NRF2 results in reduced HERC2 expression, increased stability of FBXL5 and NCOA4, decreased IRP2 protein stability, and enhanced FTH synthesis. Second, NRF2 indirectly controls VAMP8 through the mTOR-TFEB axis. In NFE2L2/NRF2 KO cells, decreased TFEB-dependent transcription of VAMP8 results in blockage of autophagosome-lysosome fusion and inhibition of ferritinophagy. Third, excessive accumulation of NCOA4 in NFE2L2/NRF2 KO cells causes recruitment of apoferritin into autophagosomes, leading to autophagosomal accumulation of apoferritin/NCOA4, increased LIP, and enhanced sensitivity to ferroptotic cell death. Green dot, ferrous iron; red dot, ferric iron.
Fig. 5.
Fig. 5.. Contribution of the NRF2-HERC2 and NRF2-VAMP8/NCOA4 axes in controlling iron homeostasis and dictating ferroptosis sensitivity.
HERC2 and VAMP8 single or double KO cells were established. (A) Status of HERC2/VAMP8 KO was determined by immunoblot analysis, along with the levels of the other indicated proteins. (B) These four cell lines were used to measure free iron using FerroOrange (upper left) and Ferene-S colorimetic assay (bottom), or ferric iron–ferritin cages by Perls staining after FAC treatment (100 μM, 12 hours) (upper right). Scale bars, 25 μm. (C) These four cell lines were left untreated or treated with IKE (10 μM), and cell growth was monitored using the IncuCyte imaging system. Results shown here were at 24 hours after treatment of IKE. Scale bar, 50 μm. (D) Percentage of ferroptotic cells from (C). (E) Cell viability measured by MTT assay. (F and G) Pooled NCOA4 KO cells in the NFE2L2/NRF2 WT or KO background were established and (F) the levels of the indicated proteins were determined by immunoblot analysis, and (G) free iron was measured using FerroOrange (upper left) or Ferene-S (bottom), or ferric iron–ferritin cages by Perls staining after FAC treatment (100 μM, 12 hours) (upper right). Scale bars, 25 μm. (H) These four cell lines were left untreated or treated with IKE (10 μM), and cell growth was monitored using the IncuCyte imaging system. Images shown were at 24 hours after treatment with IKE. Scale bar, 50 μm. (I) Percentage of ferroptotic cells from (H). *P < 0.05, n = 3. (J) Cell viability measured by MTT assay. *P < 0.05, n = 3. (K) FTH1, NCOA4, and LC3-I/II protein levels in NFE2L2/NRF2 WT or KO cells overexpressing VAMP8 were determined by immunoblot analysis. (L) Cell viability measured by MTT assay.
Fig. 6.
Fig. 6.. NRF2 expression correlates with HERC2 and VAMP8 levels in human cancer tissues, as well as ferroptosis resistance.
(A) Correlation between NRF2 expression and HERC2 or VAMP8 levels in human ovarian tissues was determined by immunohistochemistry analysis. HERC2, VAMP8, and SLC7A11 expression were imaged (see fig. S4A), and average intensity was measured and plotted against NRF2. Normal tissue (n = 10) plotted as red dots; cancer tissue (n = 40) plotted as black dots. (B) NRF2 and ferroptosis-related protein levels in various ovarian cancer cell lines were measured by immunoblot analysis (left). The expression of HERC2, VAMP8, and SLC7A11 was quantified and plotted against NRF2 in each cell line (right). (C) Correlation between NRF2 expression and the GI50 of ferroptosis-inducing compounds (IKE, erastin, RSL3, SAS, l-glutamate, and FIN56) and apoptosis-inducing compounds (cisplatin, mitomycin C, or staurosporine). Each cell line was treated with eight doses of the indicated compound for 24 hours, and cell viability was measured by MTT assay. GI50 values were calculated by log-logistic fitting (Table 3). (D) Heatmap GI50 profiles were created using median-centered z-score analysis of the GI50 values.
Fig. 7.
Fig. 7.. Genetic or pharmacological NRF2 inhibition enhanced sensitivity to ferroptotic cell death in preclinical models.
(A) NFE2L2/NRF2 WT or KO SKOV-3 cell lines were grown for 3 to 5 days until 3D sphere formation. Spheroids were treated with IKE (10 μM), BRU (20 nM), or IKE + BRU for 24 hours. Scale bar, 50 μm. (B) Cell viability of NFE2L2/NRF2 WT and KO cell lines at 24-hour treatment assessed by CellTiter-Glo assay. *P < 0.05, n = 8. (C) NFE2L2/NRF2 WT or heterozygous (Het) SKOV-3 cells were subcutaneously injected; once tumors reached 100 mm3, mice were intraperitoneally injected with IKE (40 mg/kg) or vehicle control for 14 days. Tumor volume was measured and plotted as mean tumor burden (mm3). *P < 0.05, n = 15 per group. (D) Tumor tissues were probed with C11-BODIPY581/591, 4-HNE and COX2 antibodies, or FerroOrange. Scale bar, 50 μm. (E) H&E of human ovarian tissue (P0) used for the PDX model. (F) PDX tissue (P1) was implanted; once tumor size reached ~100 mm3, mice were intraperitoneally injected with vehicle, BRU (0.25 mg/kg), IKE (20 mg/kg), or IKE + BRU for 14 days. Tumor size was measured and plotted same as (C). *P < 0.05, n = 10 per group. (G) Tumor tissues were probed with C11-BODIPY581/591, 4-HNE and COX2 antibodies, or FerroOrange. Scale bar, 50 μm. (H) 4-HNE adduct and COX2 protein levels measured by immunoblot analysis. (I) LIP measured using Ferene-S. (J) PTGS2 mRNA levels measured by RT-PCR. (K) ROS levels measured by EPR spectroscopy. (L) MDA detected by TBARS assay. Data in (I) to (L) are represented as means ± SEM of tumor tissues from six individual mice (n = 6). *P < 0.05.

Comment in

  • Iron regulation in ferroptosis.
    Wang Z. Wang Z. Nat Cell Biol. 2023 Apr;25(4):515. doi: 10.1038/s41556-023-01129-5. Nat Cell Biol. 2023. PMID: 37059879 No abstract available.

References

    1. D. D. Zhang, Mechanistic studies of the Nrf2-Keap1 signaling pathway. Drug Metab. Rev. 38, 769–789 (2006). - PubMed
    1. J. D. Hayes, A. T. Dinkova-Kostova, K. D. Tew, Oxidative stress in cancer. Cancer Cell 38, 167–197 (2020). - PMC - PubMed
    1. M. Rojo de la Vega, E. Chapman, D. D. Zhang, NRF2 and the hallmarks of cancer. Cancer Cell 34, 21–43 (2018). - PMC - PubMed
    1. S. Tao, P. Liu, G. Luo, M. Rojo de la Vega, H. Chen, T. Wu, J. Tillotson, E. Chapman, D. D. Zhang, p97 negatively regulates NRF2 by extracting ubiquitylated NRF2 from the KEAP1-CUL3 E3 complex. Mol. Cell. Biol. 37, e00660-16 (2017). - PMC - PubMed
    1. Y. Mitsuishi, K. Taguchi, Y. Kawatani, T. Shibata, T. Nukiwa, H. Aburatani, M. Yamamoto, H. Motohashi, Nrf2 redirects glucose and glutamine into anabolic pathways in metabolic reprogramming. Cancer Cell 22, 66–79 (2012). - PubMed