. 2023 Feb 3;9(5):eadd6165.
doi: 10.1126/sciadv.add6165. Epub 2023 Feb 1.

RNA binding protein DDX5 restricts RORγt+ Treg suppressor function to promote intestine inflammation

Affiliations

RNA binding protein DDX5 restricts RORγt+ Treg suppressor function to promote intestine inflammation

Shengyun Ma et al. Sci Adv. .

Abstract

Retinoid-related orphan receptor (RAR) gamma (RORγt)-expressing regulatory T cells (RORγt+ Tregs) play pivotal roles in preventing T cell hyperactivation and maintaining tissue homeostasis, in part by secreting the anti-inflammation cytokine interleukin-10 (IL-10). Here, we report that hypoxia-induced factor 1α (HIF1α) is the master transcription factor for Il10 in RORγt+ Tregs. This critical anti-inflammatory pathway is negatively regulated by an RNA binding protein DEAD box helicase 5 (DDX5). As a transcriptional corepressor, DDX5 restricts the expression of HIF1α and its downstream target gene Il10 in RORγt+ Tregs. T cell-specific Ddx5 knockout (DDX5ΔT) mice have augmented RORγt+ Treg suppressor activities and are better protected from intestinal inflammation. Genetic ablation or pharmacologic inhibition of HIF1α restores enteropathy susceptibility in DDX5ΔT mice. The DDX5-HIF1α-IL-10 pathway is conserved in mice and humans. These findings reveal potential therapeutic targets for intestinal inflammatory diseases.


Figures
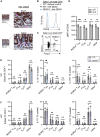
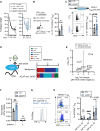
Fig. 1.
Fig. 1.. DDX5 regulates homeostatic CD4+ T cell heterogeneity and cytokine production capacity in the intestine lamina propria.
(A) Representative images from immunohistochemistry analysis of DDX5 in the ileum and colon of wild-type (WT) mice. Enlarged images are shown on the right. White stars: intestinal epithelial cells; magenta arrows: intestinal infiltrated immune cells. IHC, immunohistochemistry. (B) Representative histogram of DDX5 protein expression in CD4+ T cells from the ileal lamina propria (iLP). (C) Representative flow cytometry analysis of total live CD4+ T cells. Gating strategy for RORγt+ Treg (RORγt+Foxp3+), cTreg (RORγtFoxp3+), TH17 (RORγt+Foxp3), and other (RORγtFoxp3) cells in the iLP from wild-type mice under steady state. (D) Geometric mean fluorescence intensity (gMFI) of DDX5 in RORγt+ Treg, cTreg, and TH17 from iLP and colonic lamina propria (cLP). Each dot represents the result from one mouse. *P < 0.05 and **P < 0.01; ns, not significant (multiple paired t test, n = 4). (E) Proportions of the indicated subsets among CD4+ T cells and their IL-10 and IL-17A production potential in iLP from steady-state CTL and DDX5ΔT littermates. Each dot represents the result from one mouse. (F) Proportions of the indicated subsets among CD4+ T cells and their IL-10 and IL-17A production potential in cLP from steady-state CTL and DDX5ΔT littermates. Each dot represents the result from one mouse. *P < 0.05 (multiple paired t test, n = 8).
Fig. 2.
Fig. 2.. DDX5 in T cells promotes intestinal inflammation.
(A) gMFI of DDX5 in the indicated T cell subsets from iLP and cLP of steady-state or anti-CD3ε–challenged wild-type mice. Each dot represents the result from one mouse. *P < 0.05 and **P < 0.01 (paired multiple t test, n = 4). (B) Weight changes of CTL and DDX5ΔT gender-matched cohoused littermates intraperitoneally challenged with anti-CD3ε monoclonal antibodies (mAb) on days 0, 2, and 4 as indicated. **P < 0.01, ***P < 0.001, and ****P < 0.0001 (paired multiple t test, n = 14, combined from three independent experiments). (C) Proportions of the indicated subsets among CD4+ T cells and their IL-10 and IL-17A production potential in iLP from inflamed CTL and DDX5ΔT littermates. *P < 0.05 (paired multiple t test, n = 5). (D) Representative flow cytometry analysis of IL-10 in ileal CD4+ T cell subsets from CTL and DDX5ΔT mice administrated with anti-CD3ε. SSC, side scatter as an index of cell granularity. (E) Proportions of the indicated subsets among CD4+ T cells and their IL-10 and IL-17A production potential in cLP from inflamed CTL and DDX5ΔT littermates. *P < 0.05 (paired multiple t test, n = 5).
Fig. 3.
Fig. 3.. DDX5 negatively regulates RORγt+ Treg suppressor function in vitro and in vivo.
(A) Gating strategy for FACS sorting the CCR6CD25+ (enriched with 65 to 75% cTregs) and CCR6+CTLA4+ (enriched with 45 to 50% RORγt+ Tregs) populations. (B) Proliferation index of wild-type naïve cells (CD4+CDD62LhiCD44lo) cocultured with CCR6CD25+ and CCR6+CTLA4+ cells from CTL or DDX5ΔT mice in the indicated ratio for 72 hours. Average and SD from three replicates are shown. **P < 0.01 and ***P < 0.005 (multiple t tests). (C) Left: Experiment scheme. Right: Weight changes of RAG1−/− recipients of wild-type naïve CD4+ T cells (white circles, n = 2), naïve cells together with CTL CCR6+CTLA4+ (black circles, n = 4), or naïve cells together with DDX5ΔT CCR6+CTLA4+ cells (blue circles, n = 4). *P <0.05 and **P < 0.01 (multiple t tests). (D) Total cLP mononuclear cell counts and CD4+ T effector (Teff) cell counts derived from the wild-type naïve donor on day 36 after T cell transfer in mice described in (C). (E) Normalized mRNA expression of the indicated cytokine genes in cLP mononuclear cell lysates from mice described in (C). *P < 0.05 (multiple t tests). (F) Proportions of IL-10 production potential in transferred Treg (CD90.1) and T effector (CD90.1+) populations on day 36 after T cell transfer in mice described in (C). Each dot represents the result from one mouse. *P <0.05 and ***P < 0.005 (multiple t tests).
Fig. 4.
Fig. 4.. Identifying DDX5 targets in T cells.
(A) Weight changes of cohoused CTL and DDX5ΔT littermates administered with anti-CD3ε and anti-rat IgG (isotype control) or anti–IL-10R intraperitoneally on days 0, 2, and 4. *P < 0.05 (paired multiple t tests, n = 4). (B) CD90.1+ CTL or tdTomato+ DDX5ΔT naïve CD4+ T cells cotransfer into wild-type mice. iLP T cell cytokine levels were analyzed 5 days after anti-CD3ε challenge. *P < 0.05 (t test). (C) IL-10 levels in cultured RORγt+ Treg-like cells (n = 6). (D) Distribution of DDX5-bound RNA regions in cultured T cells. 5′-UTR, 5′ untranslated region. (E) Expression of select mRNAs. Log2 fold changes were defined by qRT-PCR results normalized to Gapdh from T cells cultured in the TGFβ (5 ng/ml, high) over those under the TGFβ (0.1 ng/ml, low) condition (multiple t tests, n = 4). Black dot: Enriched with DDX5 eCLIP-seq signal; gray dot: DDX5 eCLIP-seq signal absent. (F) Normalized mRNA levels of two Hif1a isoforms in cultured RORγt+ Treg-like cells. Each dot represents the result from one mouse. **P < 0.01 (paired multiple t test, n = 6). (G) Representative histogram of isotype or HIF1α in cultured RORγt+ Treg-like cells. (H) Representative flow plots (left) and proportions (right, each dot represents the result from one mouse) of HIF1α and IL-10 expression in cultured RORγt+ Treg-like cells. ***P < 0.001 (paired multiple t test, n = 6).
Fig. 5.
Fig. 5.. HIF1α regulates RORγt+ Treg suppressor function.
(A) gMFI of HIF1α in the indicated iLP subsets from steady-state CTL and DDX5Δ mice. Each dot represents the result from one mouse. *P < 0.05 (paired multiple t test, n = 8). (B) HIF1α+IL-10+ proportions among the indicated iLP subsets from steady-state mice. Each dot represents the result from one mouse. *P < 0.05 (paired multiple t test, n = 8). (C) HIF1α+IL-10+ proportions among the indicated iLP subsets from anti-CD3ε–challenged mice. Each dot represents the result from one mouse. *P < 0.05 (paired multiple t tests, n = 5). (D) Left: Workflow for Cas9-sgRNA–mediated knockdown of HIF1α. Right: gMFI of HIF1α in transduced cultured Cas9+ T cells normalized to results from sgEmpty. MSCV, Murine Stem Cell Virus. Each dot represents the result from one mouse. **P < 0.01 (t test, n = 4). (E) RORγt+ Treg-like cells proportions among transduced cells from (D) normalized to results from sgEmpty. ns, not significant (t test, n = 4). (F) IL-10+ proportion among the transduced RORγt+ Treg-like cells normalized to results from sgEmpty. Each dot represents the result from one mouse. ***P < 0.005 and ****P < 0.001 (t test, n = 4). (G) HIF1α occupancy on the Il10 locus in cultured RORγt+ Treg-like cells. mIgG, mouse immunoglobulin G. Each dot represents the result from one mouse. **P < 0.01 (paired multiple t tests, n = 4). (H) Weight changes of indicated mice after anti-CD3ε mAb challenge. **P < 0.01 (paired multiple t tests, n = 6). (I) Proportion of IL-10–expressing RORγt+ Tregs from steady-state or anti-CD3ε–challenged mice. FSC, forward scatter as an index of cell granularity. *P < 0.05 (paired multiple t test).
Fig. 6.
Fig. 6.. Genetic ablation of HIF1α or inhibition of HIF1α DNA binding restores enteropathy susceptibility in DDX5ΔT mice.
(A) Weight changes of three pairs of CTL, DDX5ΔT, and DDX5ΔHIF1αΔT mice administered with anti-CD3ε mAb. *P < 0.05 (multiple t tests, n = 3). (B) Proportions (left) and number (right) of ileal CD4+ T cell in the mice as shown in (A). *P < 0.05 (t test, n = 3). (C) Proportions of IL-10+ ileal CD4+ T cell subsets from (B). Each dot represents the result from one mouse. *P < 0.05 (t test). (D) Representative flow cytometry analysis of IL-10 in ileal CD4+ T cell subsets from indicated mice administrated with anti-CD3ε. (E) Weight changes of five pairs of CTL and DDX5ΔT mice administered with anti-CD3ε mAb or anti-CD3ε mAb and echinomycin (100 μg/kg) or echinomycin alone (100 μg/kg). **P < 0.01, ***P < 0.005, and ****P < 0.001 (multiple t tests). (F) Disease score of ileal sections from (E). (G) Ileal CD4+ T cell count from (E). Each dot represents the result from one mouse. *P < 0.05 (t test). (H) Proportions of IL-10+ ileal CD4+ T cell subsets from (E). Each dot represents results from one mouse. *P < 0.05 (t test). (I) Working model: DDX5 inhibits HIF1α-mediated IL-10 expression and contact-dependent suppressor function in RORγt+ Treg and promotes T cell–mediated inflammation in the intestine.
Fig. 7.
Fig. 7.. DDX5 promotes R loop disassembly and restricts RNA Pol2 recruitment to repress Hif1a transcription.
(A) DDX5-bound regions on the Hif1a transcript. (B) HIF1α+IL-10+ proportions in cultured Cas9+ RORγt+ Treg-like cells transduced with the indicated retroviruses. Each dot represents the result from one mouse. *P < 0.05 (t test). (C) DRIP-qRT detection of RNA-DNA hybrid structures in cultured RORγt+ Treg-like cells. TSS, Transcription Start Site; TTS, Transcription Termination Site. Each dot represents the result from one mouse. *P < 0.05 (paired multiple t tests, n = 4). RNaseH1, ribonuclease H1. (D) RNA Pol2 and H3K4me3 ChIP-qPCR analysis at the Hif1a locus in cultured RORγt+ Treg-like cells. Each dot represents the result from one mouse. *P < 0.05 (paired multiple t test, n = 3). (E) Working model: DDX5 resolves the R loop to block RNA Pol2 loading and inhibit Hif1a transcription. (F) HIF1α+IL-10+ proportions in cultured RORγt+ Treg-like cells treated with vehicle [dimethyl sulfoxide (DMSO)] or the DDX5 inhibitor (RX-5902) for 72 hours. Each dot represents the result from an independent experiment. *P < 0.05 (t test). (G) HIF1α+IL-10+ proportions in human Jurkat T cells treated with vehicle (DMSO) or the DDX5 inhibitor (RX-5902) for 72 hours. Each dot represents the result of an independent experiment. ***P < 0.001 (t test, n = 4). (H) Representative staining of HIF1α, IL-10, DDX5, and isotype (negative) in human Jurkat T cells. h, human. (I) HIF1A and IL10 expressions in human ileal RORγt+ Tregs as determined by single-cell RNA sequencing [GSE134809 (53) and GSE162335 (54)]. Each dot represents the average expression of these genes from one donor.

References

    1. E. M. Shevach, Mechanisms of foxp3+ T regulatory cell-mediated suppression. Immunity 30, 636–645 (2009). - PubMed
    1. K. Pham, K. Parikh, E. C. Heinrich, Hypoxia and inflammation: Insights from high-altitude physiology. Front. Physiol. 12, 676782 (2021). - PMC - PubMed
    1. C. T. Taylor, S. P. Colgan, Regulation of immunity and inflammation by hypoxia in immunological niches. Nat. Rev. Immunol. 17, 774–785 (2017). - PMC - PubMed
    1. E. T. Clambey, E. McNamee, J. A. Westrich, L. E. Glover, E. L. Campbell, P. Jedlicka, E. F. de Zoeten, J. C. Cambier, K. R. Stenmark, S. P. Colgan, H. K. Eltzschig, Hypoxia-inducible factor-1α-dependent induction of FoxP3 drives regulatory T-cell abundance and function during inflammatory hypoxia of the mucosa. Proc. Natl. Acad. Sci. U.S.A. 109, E2784–E2793 (2012). - PMC - PubMed
    1. E. V. Dang, J. Barbi, H.-Y. Yang, D. Jinasena, H. Yu, Y. Zheng, Z. Bordman, J. Fu, Y. Kim, H.-R. Yen, W. Luo, K. Zeller, L. Shimoda, S. L. Topalian, G. L. Semenza, C. V. Dang, D. M. Pardoll, F. Pan, Control of TH17/Treg balance by hypoxia-inducible factor 1. Cell 146, 772–784 (2011). - PMC - PubMed

MeSH terms