. 2023 Feb 3;9(5):eadf8156.
doi: 10.1126/sciadv.adf8156. Epub 2023 Feb 1.

The ion transporter Na+-K+-ATPase enables pathological B cell survival in the kidney microenvironment of lupus nephritis

Affiliations

The ion transporter Na+-K+-ATPase enables pathological B cell survival in the kidney microenvironment of lupus nephritis

Irene Chernova et al. Sci Adv. .

Abstract

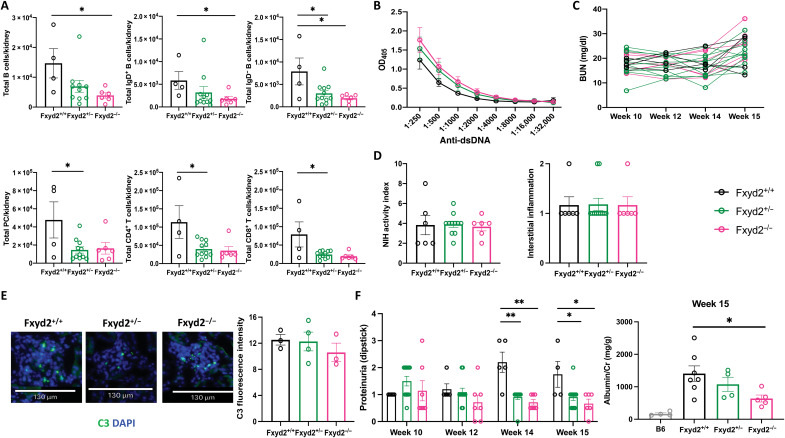
The kidney is a comparatively hostile microenvironment characterized by highsodium concentrations; however, lymphocytes infiltrate and survive therein in autoimmune diseases such as lupus. The effects of sodium-lymphocyte interactions on tissue injury in autoimmune diseases and the mechanisms used by infiltrating lymphocytes to survive the highsodium environment of the kidney are not known. Here, we show that kidney-infiltrating B cells in lupus adapt to elevated sodium concentrations and that expression of sodium potassium adenosine triphosphatase (Na+-K+-ATPase) correlates with the ability of infiltrating cells to survive. Pharmacological inhibition of Na+-K+-ATPase and genetic knockout of Na+-K+-ATPase γ subunit resulted in reduced B cell infiltration into kidneys and amelioration of proteinuria. B cells in human lupus nephritis biopsies also had high expression of Na+-K+-ATPase. Our study reveals that kidney-infiltrating B cells in lupus initiate a tissue adaption program in response to sodium stress and identifies Na+-K+-ATPase as an organ-specific therapeutic target.


Figures

Fig. 1.
Fig. 1.. B cells from lupus-prone mice exhibit enhanced survival under hypernatremic conditions compared to wild-type lymphocytes but are unable to sustain the advantage at very high [Na+].
(A) Tissue-resident B cells from kidneys from B6 and MRLlpr mice were quantified via flow cytometry. (B) MRLlpr kidneys were separated into cortex, outer and inner medulla, and B cells quantified as in (A); combined from four independent experiments. Representative histology is shown. (C) Splenic B cells from B6 and MRLlpr mice were cultured in NaCl-supplemented medium with lipopolysaccharide (5 μg/ml) in quadruplicate; representative of >3 independent experiments. (D) B cells from MRL+/+ and MRLlpr mice were cultured as in (C). (E) Study design for high-salt diet in MRLlpr mice; created with BioRender.com. (F) Kidney B cells of control and high salt–treated MRLlpr mice were quantified as in (A); combined from two independent experiments. (G) Serum [Na+] (in milliequivalents/liter) on a subset of mice shown in (F). (H) Semiquantitative dipstick proteinuria for mice in (F). (I) Serum creatinine (Cr; in milligrams per deciliter) on a subset of mice shown in (F). (J) Study design for water deprivation in MRLlpr mice; created with BioRender.com. “Pre” and “post” measurements were obtained at t = 0 and t = 48 hours, respectively. (K) Kidney B cells quantified as in (A); representative of >2 independent experiments. (L) Serum [Na+] (in milliequivalents per liter) for mice shown in (K). (M) Semiquantitative dipstick proteinuria for mice in (K). (N) Serum creatinine (in milligrams per deciliter) for mice shown in (K). *P < 0.05, **P < 0.01, and ***P < 0.001; results are not significant unless indicated.
Fig. 2.
Fig. 2.. Na+-K+-ATPase is up-regulated on B cells in lupus-prone kidneys and mediates the enhanced survival under highNaCl conditions.
Lymphocytes isolated from spleens and kidneys of the indicated mouse strains were assayed by flow cytometry. Gating strategy in fig. S1. (A) Structure of Na+-K+-ATPase; oua, ouabain (small-molecule inhibitor of Na+-K+-ATPase); created with BioRender.com. (B) αNa+-K+-ATPase quantified on MRLlpr B cells cultured under highNaCl conditions as determined by flow cytometry. (C) B6 and MRLlpr B cells were cultured with +40 mM NaCl, +100 μM ouabain, or both. Left panel shows MRLlpr data and right panel shows comparison B6 data. Fold change compared to control normal medium is shown; representative of three independent experiments. Asterisks indicate comparison to normal medium condition. (D) Representative flow cytometric staining of αNa+-K+-ATPase in B6 and MRLlpr mice. (E) αNa+-K+-ATPase expression quantified on spleens and kidneys of MRLlpr mice; combined from three independent experiments. (F) Representative immunofluorescence microscopy of αNa+-K+-ATPase on renal B cells of MRLlpr mice; representative of three mice. (G) αNa+-K+-ATPase expression across different kidney compartments; combined from three independent experiments. (H) αNa+-K+-ATPase expression in the spleen and kidney of lupus-prone strains compared to B6 controls: B6lpr, MRL+/+, MRLlpr, and NZBWF1. (I) Splenic B cells from NZBWF1 mice were cultured as in Fig. 1C; representative of three independent experiments. *P < 0.05, **P < 0.01, and ***P < 0.001; results are not significant unless otherwise indicated. MFI, mean fluorescence intensity
Fig. 3.
Fig. 3.. Pharmacological blockade of Na+-K+-ATPase ablates kidney B cells and improves proteinuria.
MRLlpr female mice were treated with phosphate-buffered saline (PBS; control) or ouabain (Na+-K+-ATPase inhibitor) daily for 16 days and then euthanized at 19 to 22 weeks of age. Data from two combined experiments are shown, of five total experiments. (A) Kidney interstitial B cells were quantified using flow cytometry, gating strategy as in fig. S1. (B) Representative histology from control and treated mice and quantitated pathological scores based on the National Institutes of Health (NIH) activity scale. (C) Sera anti-dsDNA antibodies as measured by enzyme-linked immunosorbent assay (ELISA) from control and ouabain-treated mice at day 17 after treatment. OD405, optical density at 405 nm. (D) C3 (green) and 4′,6-diamidino-2-phenylindole (DAPI; blue) immunofluorescent staining in glomeruli of control and ouabain-treated mice, fluorescence intensity quantified across multiple glomeruli and multiple animals using ImageJ software. (E) Semiquantitative urine dipstick analysis for proteinuria and colorimetric urine albumin/creatinine measurement. (F) BUN in milligrams per deciliter. *P < 0.05, **P < 0.01, and ***P < 0.001; results are not significant unless otherwise indicated.
Fig. 4.
Fig. 4.. Hypertonicity-responsive γNa+-K+-ATPase is up-regulated on kidney B cells in lupus-prone mice and partially mediates B cell survival in high salinity.
(A) Structure of γ-containing Na+-K+-ATPase; created with BioRender.com. (B) Fxyd2 expression from MRLlpr B cells cultured as in Fig. 1C; representative of three independent experiments. (C) Splenic B cells from MRLlpr-Cas9+ mice were transduced with green fluorescent protein–positive (GFP+) virus containing guide RNA against γNa+-K+-ATPase versus control guide RNA and then switched to highsalt medium 48 hours later (see Materials and Methods). GFP+ B cells were then analyzed at day 6 of culture for survival via flow cytometry; each condition was done in triplicate, and combined data from two independent experiments are shown. (D) B cell and T cell subsets were sorted from spleens and kidneys of MRLlpr mice and queried for Fxyd2 (γNa+-K+-ATPase gene) expression via real-time polymerase chain reaction (RT-PCR) in quadruplicate; data from four independent animals are shown. (E) Immunofluorescence microscopy of γNa+-K+-ATPase on renal tubules (scale bars, 40 μM) and B cells (scale bars, 5 μM) of MRLlpr.Fxyd2+/+ and MRLlpr.Fxyd2−/− mice; representative of three mice per group. Fluorescence intensity of individual cells was determined using ImageJ software. *P < 0.05, **P < 0.01, ***P < 0.001, and ****P < 0.0001; results are not significant unless otherwise indicated.
Fig. 5.
Fig. 5.. Lupus-prone mice lacking the γNa+-K+-ATPase have fewer kidney B cells and have decreased proteinuria compared to wild-type littermates.
MRLlpr.Fxyd2+/+, MRLlpr.Fxyd2+/−, and MRLlpr.Fxyd2−/− littermate control mice were analyzed longitudinally and euthanized at 15 weeks of age. Combined data from two experiments are shown, of four total experiments. (A) Kidney interstitial lymphocytes were quantified using flow cytometry, gating strategy as in fig. S1. (B) Sera anti-dsDNA antibodies as measured by ELISA at week 15. (C) BUN in milligrams per deciliter. (D) Quantitated pathological scores based on the NIH activity scale. (E) C3 (green) and DAPI (blue) immunofluorescent staining in glomeruli of indicated mice; fluorescence intensity quantified across multiple glomeruli and multiple animals using ImageJ software. (F) Semiquantitative urine dipstick analysis for proteinuria and colorimetric urine albumin/creatinine measurement. *P < 0.05 and **P < 0.01; results are not significant unless otherwise indicated.
Fig. 6.
Fig. 6.. γNa+-K+-ATPase modulates intrarenal B cell numbers and proteinuria via its function in the hematopoietic lineage.
MRLlpr.Fxyd2+/+ and MRLlpr.Fxyd2−/− BM chimeras were generated as described in Materials and Methods and analyzed longitudinally until 18 to 21 weeks of age. Combined data from two experiments are shown. (A) Kidney interstitial lymphocytes were quantified using flow cytometry, gating strategy as in fig. S1. (B) Semiquantitative urine dipstick analysis for proteinuria. (C) BUN in milligrams per deciliter for a subset of the mice. (D) Sera anti-dsDNA antibodies as measured by ELISA at time of euthanasia (weeks 18 to 21). (E) Quantitated pathological scores based on the NIH activity scale for a subset of the same mice. *P < 0.05, **P < 0.01; results are not significant unless otherwise indicated.
Fig. 7.
Fig. 7.. αNa+-K+-ATPase and γNa+-K+-ATPase are highly expressed on B cells in human lupus nephritis.
Representative sections from human lupus kidney. Merged immunofluorescence staining images of DAPI, αNa+-K+-ATPase (A), or γNa+-K+-ATPase (B) with either CD19/CD20, CD4, or CD8. Arrows point to the same B cells and CD4+ or CD8+ T cells in each serial image. Fluorescence intensity of individual cells was determined using ImageJ software. Arrows point to some representative cells in each image. Scale bars, 10 μm (A) and 20 μm (B). Representative of three to four sections; *P < 0.05, ***P < 0.001, and ****P < 0.0001. ns = not statistically significant.

Comment in

References

    1. S. Almaani, A. Meara, B. H. Rovin, Update on lupus nephritis. Clin. J. Am. Soc. Nephro 12, 825–835 (2017). - PMC - PubMed
    1. L. Couzi, P. Merville, C. Deminière, J.-F. Moreau, C. Combe, J.-L. Pellegrin, J.-F. Viallard, P. Blanco, Predominance of CD8+ T lymphocytes among periglomerular infiltrating cells and link to the prognosis of class III and class IV lupus nephritis. Arthritis Rheum. 56, 2362–2370 (2007). - PubMed
    1. A. Arazi, D. A. Rao, C. C. Berthier, A. Davidson, Y. Liu, P. J. Hoover, A. Chicoine, T. M. Eisenhaure, A. H. Jonsson, S. Li, D. J. Lieb, F. Zhang, K. Slowikowski, E. P. Browne, A. Noma, D. Sutherby, S. Steelman, D. E. Smilek, P. Tosta, W. Apruzzese, E. Massarotti, M. Dall’Era, M. Park, D. L. Kamen, R. A. Furie, F. Payan-Schober, W. F. Pendergraft III, E. A. McInnis, J. P. Buyon, M. A. Petri, C. Putterman, K. C. Kalunian, E. S. Woodle, J. A. Lederer, D. A. Hildeman, C. Nusbaum, S. Raychaudhuri, M. Kretzler, J. H. Anolik, M. B. Brenner, D. Wofsy, N. Hacohen, B. Diamond; Accelerating Medicines Partnership in SLE network , The immune cell landscape in kidneys of patients with lupus nephritis. Nat. Immunol. 20, 902–914 (2019). - PMC - PubMed
    1. O. T. Chan, L. G. Hannum, A. M. Haberman, M. P. Madaio, M. J. Shlomchik, A novel mouse with B cells but lacking serum antibody reveals an antibody-independent role for B cells in murine lupus. J. Exp. Med. 189, 1639–1648 (1999). - PMC - PubMed
    1. M. J. Shlomchik, M. P. Madaio, D. Ni, M. Trounstein, D. Huszar, The role of B cells in lpr/lpr-induced autoimmunity. J. Exp. Med. 180, 1295–1306 (1994). - PMC - PubMed

MeSH terms