. 2023 Feb 3;9(5):eadd6995.
doi: 10.1126/sciadv.add6995. Epub 2023 Feb 1.

Tumor-associated nonmyelinating Schwann cell-expressed PVT1 promotes pancreatic cancer kynurenine pathway and tumor immune exclusion

Affiliations

Tumor-associated nonmyelinating Schwann cell-expressed PVT1 promotes pancreatic cancer kynurenine pathway and tumor immune exclusion

Chengcao Sun et al. Sci Adv. .

Abstract

One of the major obstacles to treating pancreatic ductal adenocarcinoma (PDAC) is its immunoresistant microenvironment. The functional importance and molecular mechanisms of Schwann cells in PDAC remains largely elusive. We characterized the gene signature of tumor-associated nonmyelinating Schwann cells (TASc) in PDAC and indicated that the abundance of TASc was correlated with immune suppressive tumor microenvironment and the unfavorable outcome of patients with PDAC. Depletion of pancreatic-specific TASc promoted the tumorigenesis of PDAC tumors. TASc-expressed long noncoding RNA (lncRNA) plasmacytoma variant translocation 1 (PVT1) was triggered by the tumor cell-produced interleukin-6. Mechanistically, PVT1 modulated RAF proto-oncogene serine/threonine protein kinase-mediated phosphorylation of tryptophan 2,3-dioxygenase in TASc, facilitating its enzymatic activities in catalysis of tryptophan to kynurenine. Depletion of TASc-expressed PVT1 suppressed PDAC tumor growth. Furthermore, depletion of TASc using a small-molecule inhibitor effectively sensitized PDAC to immunotherapy, signifying the important roles of TASc in PDAC immune resistance.


Figures
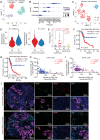
Fig. 1.
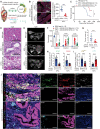
Fig. 1.. The abundance of TASc correlates with immune-resistant tumor microenvironments.
(A) UMAP of the composition of stroma subtypes in adjacent normal and tumor tissues, including endothelial cell, fibroblast cell, stellate cell, and Schwann cell. (B) Average expression of known markers in indicated cell clusters. The dot size represents percent of cells expressing the genes in each cluster, and the dot color denotes the expression intensity of markers. (C) UMAP of the composition of stroma subsets in adjacent normal and tumor tissues. (D) Signature score of myelinating (left) and nonmyelinating (right) Schwann cells (SCs) at the single-cell level for each of the two SC subsets. Statistical analysis was performed by Wilcoxon rank sum test. (E) Comparison of percentage of myelinating and nonmyelinating SCs of stroma cells in adjacent normal tissues (N) (n = 11) and tumor tissues (T) (n = 24) in single-cell RNA sequencing (RNA-seq) dataset. Statistical analysis was performed by Wilcoxon rank sum test. (F and G) Kaplan-Meier curves indicated the abundance of nonmyelinating SCs and overall survival time (F) and progression-free survival time (G) in TCGA PDAC cohort. A two-sided log-rank test P < 0.05 is considered as a statistically significant difference. (H and I) Pearson correlation between S100 and CD8 (H) or GFAP and CD8 (I) staining intensity in pancreatic cancer tissues. Six fields per tissue sample were measured (n = 92). Fisher’s exact test. (J) Representative fluorescent mIHC image of human PDAC tissues, stained with S100, GFAP, CK19, and CD8 antibodies. Areas of high– and low–Schwann cell abundance are shown. Scale bars, 200 μm (left) and 50 μm (right).
Fig. 2.
Fig. 2.. Depletion of TASc attenuates pancreatic cancer tumorigenesis.
(A) Graphic illustration of tissue-specific depletion of mouse Schwann-like cells in C57BL/6J and KPC mice. (B) mIHC staining images (left) and statistical analysis (right) of S100-positive Schwann cells in the pancreases from AAV8-GFAP-Blank– and AAV8-GFAP-DTA–administered KPC mice (n = 8 mice per group). Error bars, SDs; scale bars, 200 μm; unpaired Student’s t test. (C) Kaplan-Meier survival plots of WT, AAV8-GFAP-Blank–administered, or AAV8-GFAP-DTA–administered KPC mice after tamoxifen administration. Log-rank test; n = 8, 12, and 13 mice, respectively. (D) Representative hematoxylin and eosin (H&E) staining images of pancreatic tissues from 12-week-old WT, AAV8-GFAP-Blank, and AAV8-GFAP-DTA administered KPC mice. Scale bars, 100 μm. (E) Representative magnetic resonance imaging (MRI) scans of 22-week-old WT, AAV8-GFAP-Blank–administered, and AAV8-GFAP-DTA–administered KPC mice. (F) Morphometric analysis of pancreatic tissues from 12-week-old WT, AAV8-GFAP-Blank–administered, and AAV8-GFAP-DTA–administered KPC mice. Error bars, SDs; n = 8, 12, and 13 mice, respectively; one-way analysis of variance (ANOVA) followed by multiple comparisons (Dunnett’s test) against percentage in WT mice. (G) Tumor volumes of 22-week-old WT, AAV8-GFAP-Blank–administered, and AAV8-GFAP-DTA–administered KPC mice. Error bars, SDs; n = 12 and 13 animals, respectively; Student’s t test. (H and I) Statistical analysis of S100-positive [(H), left], GFAP-positive [(H), right], p75NTR-positive [(I), left], and CD8-positive [(I), right] cells in pancreatic tumors from AAV8-GFAP-Blank– and AAV8-GFAP-DTA–administered KPC mice. Error bars: SDs; n = 12 and 13 animals, respectively; unpaired Student’s t test. (J) Representative fluorescent mIHC images of mouse pancreatic tumors from AAV8-GFAP-Blank– or AAV8-GFAP-DTA–administrated KPC mice, stained with the indicated antibodies. Scale bars, 100 μm. Student’s t test, **P < 0.01, ***P < 0.001, and ****P < 1 × 10−4.
Fig. 3.
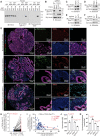
Fig. 3.. PVT1 is associated with RAF1 and TDO2.
(A) Graphic illustration (left) and heatmap result (right) of the RNA-seq experiment in TASc isolated from KPC mice with or without tamoxifen induction. (B) The heatmap (left) and the top Pvt1-associated proteins (right) in mouse Schwann-like cells isolated from KPC pancreatic tumors identified via RNA pull-down and mass spectrometry. R, biological repeat. (C) Immunoblotting (IB) detection of indicated proteins retrieved via in vitro pull-down with biotinylated PVT1. Strep–horseradish peroxidase (HRP) blot serves as an input control for biotinylated PVT1. (D) RNA immunoprecipitation (RIP) assay using indicated antibodies followed by quantitative reverse transcription polymerase chain reaction detection of PVT1 or LINK-A. Error bars, SDs; n = 3 independent experiments; one-way ANOVA. (E and F) TDO2 cross-linking and immunoprecipitation (CLIP) assay in human (E) or mouse (F) Schwann cells were visualized by IB (left) and autoradiography (right). (G) Summary of RNAs bound with human or mouse TDO2 identified from CLIP assay. (H) Pearson correlation between PVT1/Pvt1 and TDO2 (left) or PVT1/Pvt1 and RAF1 (right) in human or mouse Schwann cells performed with immuno-RNA fluorescence in situ hybridization (FISH). Twelve fields per experimeental condition were measured. one-way ANOVA, not significant (n.s.), P > 0.05 and ***P < 1 × 10−4. (I and J) Immuno-RNA FISH detecting the subcellular localization and colocalization of PVT1/Pvt1 with TDO2 (I) or PVT1/Pvt1 with RAF1 (J) in human or mouse Schwann cells. Scale bars, 10 μm.
Fig. 4.
Fig. 4.. Characterization of PVT1-TDO2 and PVT1-RAF1 interactions.
(A) In vitro RNA protein binding followed by dot blot assays using in vitro–transcribed biotinylated PVT1 sense (sen.) and antisense (a.s.) in the presence of the indicated recombinant proteins. Glutathione S-transferase (GST) was included as a negative control. Bottom: Annotations for each dot. (B) RNA–electrophoretic mobility shift assay using the indicated recombinant proteins in the presence of biotinylated (Bio)– and unlabeled-PVT1 nucleotides 1200 to 1260 and 480 to 540, respectively. (C and D) IB detection of TDO2 (C) or RAF1 (D) retrieved by in vitro–transcribed biotinylated PVT1 full-length (FL) or indicated deletion mutants. Strep-HRP blot serves as an input control for biotinylated RNA as indicated. (E and F) Predicted RNA three-dimensional structure models of the human PVT1 (nucleotides 1196 to 1222) (E) or mouse Pvt1 (nucleotides 1794 to 1820) (F). (G) Left: Overview of interaction between human PVT1 and TDO2. Right: Zoom-in view of the detailed interaction between the stem-loop of PVT1 and TDO2 via multiple hydrogen bonds. Brown cartoon, human PVT1; cyan cartoon, human TDO2; green sticks, residues form polar interactions with PVT1. (H) Left: Overview of interaction between mouse Pvt1 and TDO2. Right: Zoom-in view of detailed interaction between the stem-loop of Pvt1 and TDO2 via multiple hydrogen bonds. Brown cartoon: Mouse Pvt1; cyan cartoon, human TDO2; green sticks, residues form polar interactions with Pvt1.
Fig. 5.
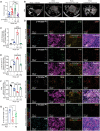
Fig. 5.. TASc-expressed PVT1 modulates TDO2 phosphorylation and enzymatic activity.
(A) In vitro kinase assay using the indicated recombinant proteins in the presence of GST-tagged TDO2, TDO2 WT, or TDO2 S151A mutation, followed by IB detection of the indicated proteins. (B) IB detection of the indicated proteins in TDO2-proficient and TDO2-deficient human Schwann cells harboring TDO2 WT or S151A expression vector. (C and D) IB detection of TDO2 and p-TDO2 (Ser151) in human Schwann cells harboring the expression vector of PVT1 (C) and RAF1 (D). (E and F) IB detection of TDO2 and p-TDO2 (Ser151) in human Schwann cells harboring the single-guide RNA (sgRNA)–targeting PVT1 (E) and RAF1 (F). (G) Representative mIHC images of adjacent normal tissues, p-TDO2 (Ser151)–high, and p-TDO2 (Ser151)–low PDAC tumor tissues, stained with the indicated antibodies. Scale bars, 200 μm (left) and 50 μm (right). (H) Statistical analysis of p-TDO2 (Ser151) staining intensities normalized by total TDO2 intensities in adjacent normal or PDAC tumor tissues, n = 75 adjacent normal and 75 PDAC tissues respectively, paired Student’s t test. (I) Pearson correlation between p-TDO2 (Ser151) and CD8 in human PDAC tumors. n = 92 tissues; Fisher’s exact test. (J and K) Kynurenine (J) and kynurenine/tryptophan ratio (K) in cell culture supernatant of human Schwann cells harboring indicated expression constructs/sgRNAs. Error bars, SDs; n = 3 independent experiments; one-way ANOVA. **P < 0.01 and ***P < 1 × 10−4.
Fig. 6.
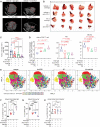
Fig. 6.. TASc-expressed PVT1 facilitates PDAC progression.
(A) Tumor volumes of WT mice subjected to orthotopic injection of iKras mouse KPC cells alone or in combination with mouse Schwann cells harboring exogenous Pvt1 or sgRNAs targeting Pvt1. Error bars, SDs; n = 10 animals per group; one-way ANOVA. (B) MRI scans of WT mice subjected to orthotopic injection of iKras mouse KPC cells alone or in combination with mouse Schwann cells harboring exogenous Pvt1 or sgRNAs targeting Pvt1. The tumor masses were indicated by red circles. (C) Statistical analysis of RNAscope Pvt1 staining intensities in tumor samples isolated from WT mice subjected to orthotopic injection of iKras mouse KPC cells alone or in combination with mouse Schwann cells harboring exogenous Pvt1 or sgRNAs targeting Pvt1. Error bars, SDs; n = 5 animals per group; one-way ANOVA. (D) Representative mIHC images of tumor samples isolated from WT mice subjected to orthotopic injection of iKras mouse KPC cells alone or in combination with mouse Schwann cells harboring exogenous Pvt1 or sgRNAs targeting Pvt1, stained by indicated antibodies. Scale bars, 100 μm. (E and F) Statistical analysis of mIHC staining intensities of p-TDO2 (Ser151) (E) and CD8 (F) in tumor samples isolated from WT mice subjected to orthotopic injection of iKras mouse KPC cells alone or in combination with mouse Schwann cells harboring exogenous Pvt1 or sgRNAs targeting Pvt1; one-way ANOVA. (G) Percentage of CD45+CD3+CD8+Granzyme B+ cells in tumor samples isolated from WT mice subjected to orthotopic injection of iKras mouse KPC cells alone or in combination with mouse Schwann cells harboring sgRNAs targeting Pvt1. Error bars, SDs; n = 5 animals per group; one-way ANOVA, n.s., P > 0.05; *P < 0.05; **P < 0.01; ***P < 0.001; and ****P < 1 × 10−4.
Fig. 7.
Fig. 7.. TASc inhibition sensitizes PDAC to immunotherapy.
(A to C) MRI images (A), tumor virtualization (B), and tumor volume (C) of mice subjected to orthotopic coinjection of iKras mouse KPC tumor cells with mouse Schwann cells, treated with Fc alone or in combination with control immunoglobulin G (IgG) or anti–PD-1 antibodies. Error bars, SDs; n = 10 animals per group; one-way ANOVA. (D and E) CyTOF determination of cell populations in tumors isolated from mice subjected to orthotopic coinjection of iKras mouse KPC tumor cells with mouse Schwann cells, treated with FC alone or in combination with control IgG or anti–PD-1 antibodies. t-SNE plot based on the arcsinh-transformed expression of 10 lineage markers in cells from the PBMC dataset. Ten thousand cells were randomly selected from each of the five samples. Cells were colored according to 45 cell populations obtained using FlowSOM after a metaclustering step using ConsensusClusterPlus. Statistical analysis of active CD8+ T cell (D, left), M2 macrophage (D, middle), and MDSC (D, right) infiltration identified by CyTOF in mice subjected to orthotopic coinjection of iKras mouse KPC tumor cells with mouse Schwann cells, treated with FC alone or in combination with control IgG or anti–PD-1 antibodies. Median ± quantile; n = 5 animals per group; one-way ANOVA. (F to H) Flow cytometric analysis of CD45+CD3+CD8+GB+ (F), CD45+CD11b+Gr+ (G), and CD45+CD3+CD4+FOXP3+ (H) cell infiltration in mice subjected to orthotopic coinjection of iKras mouse KPC tumor cells with mouse Schwann cells, treated with FC alone or in combination with control IgG or anti–PD-1 antibodies. Error bars, SDs; n = 5 animals per group; one-way ANOVA. *P < 0.05, **P < 0.01, ***P < 0.001, and ****P < 1 × 10−4.

References

    1. Oberstein P. E., Olive K. P., Pancreatic cancer: Why is it so hard to treat? Therap. Adv. Gastroenterol. 6, 321–337 (2013). - PMC - PubMed
    1. Waters A. M., Der C. J., KRAS: The critical driver and therapeutic target for pancreatic cancer. Cold Spring Harb. Perspect. Med. 8, (2018). - PMC - PubMed
    1. Foley K., Kim V., Jaffee E., Zheng L., Current progress in immunotherapy for pancreatic cancer. Cancer Lett. 381, 244–251 (2016). - PMC - PubMed
    1. Dey P., Li J., Zhang J., Chaurasiya S., Strom A., Wang H., Liao W. T., Cavallaro F., Denz P., Bernard V., Yen E. Y., Genovese G., Gulhati P., Liu J., Chakravarti D., Deng P., Zhang T., Carbone F., Chang Q., Ying H., Shang X., Spring D. J., Ghosh B., Putluri N., Maitra A., Wang Y. A., DePinho R. A., Oncogenic KRAS-driven metabolic reprogramming in pancreatic cancer cells utilizes cytokines from the tumor microenvironment. Cancer Discov. 10, 608–625 (2020). - PMC - PubMed
    1. Demir I. E., Friess H., Ceyhan G. O., Neural plasticity in pancreatitis and pancreatic cancer. Nat. Rev. Gastroenterol. Hepatol. 12, 649–659 (2015). - PubMed

MeSH terms