. 2023 Apr 15;207(8):998-1011.
doi: 10.1164/rccm.202203-0482OC.

NRF2 Activation Reprograms Defects in Oxidative Metabolism to Restore Macrophage Function in Chronic Obstructive Pulmonary Disease

Affiliations

NRF2 Activation Reprograms Defects in Oxidative Metabolism to Restore Macrophage Function in Chronic Obstructive Pulmonary Disease

Eilise M Ryan et al. Am J Respir Crit Care Med. .

Abstract

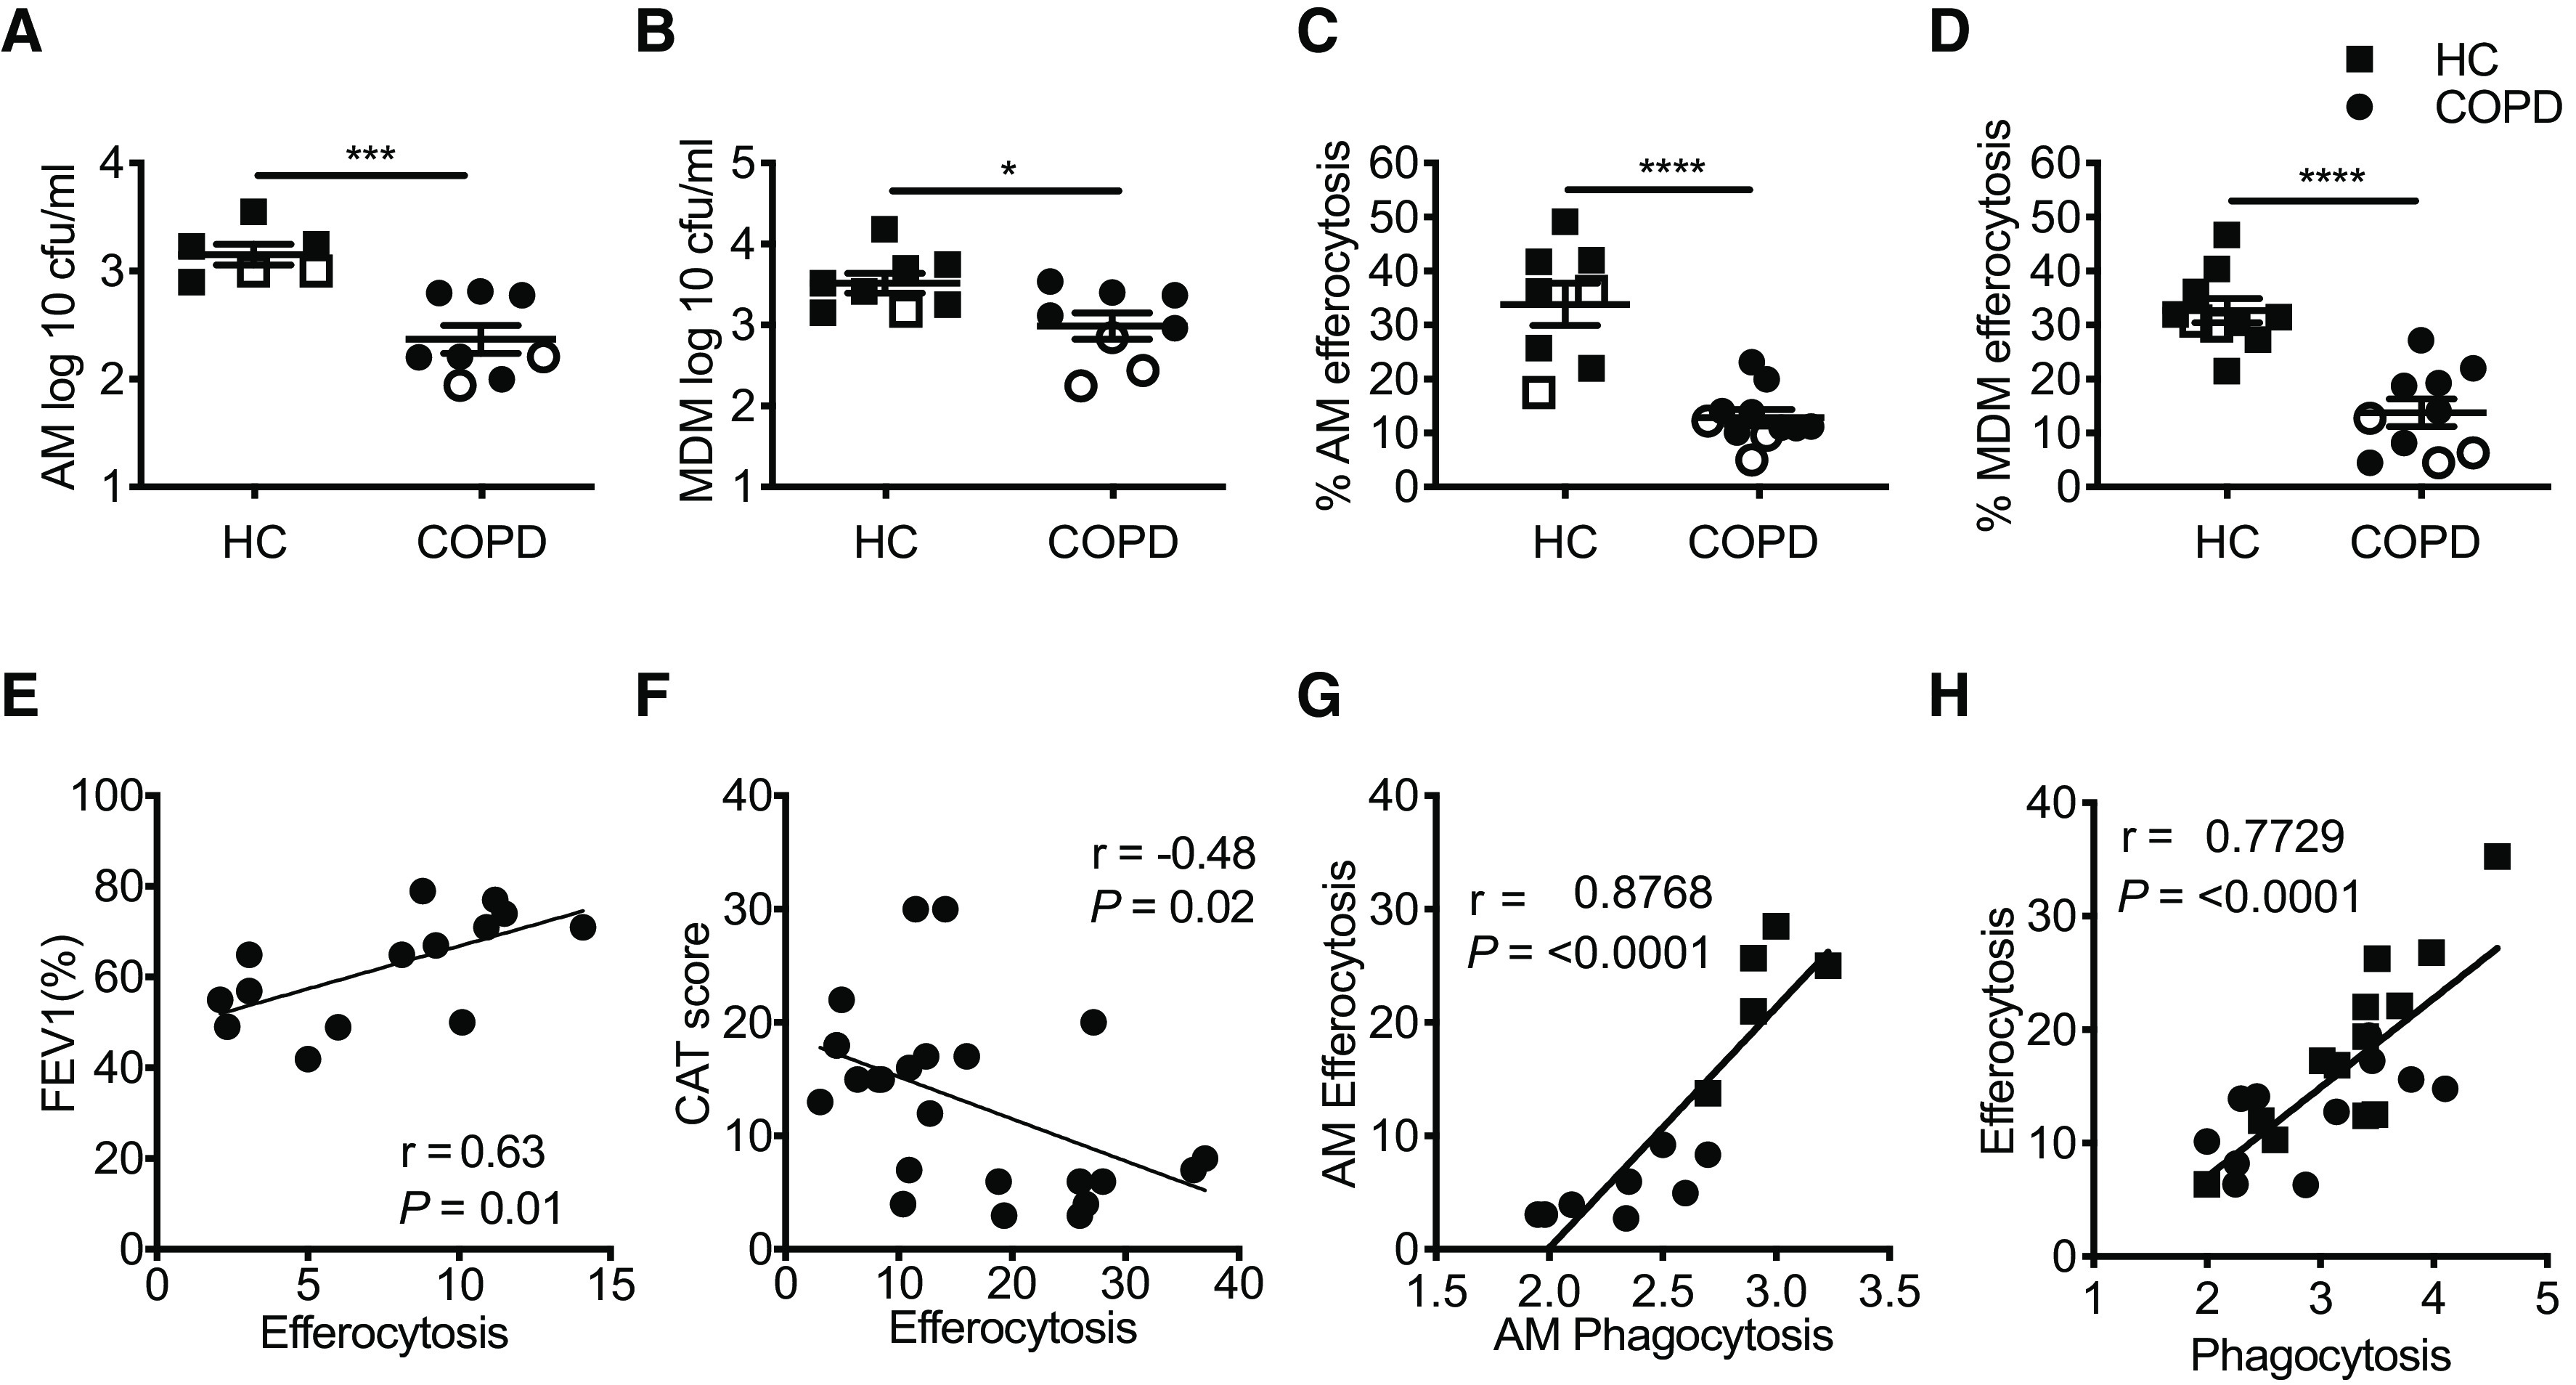
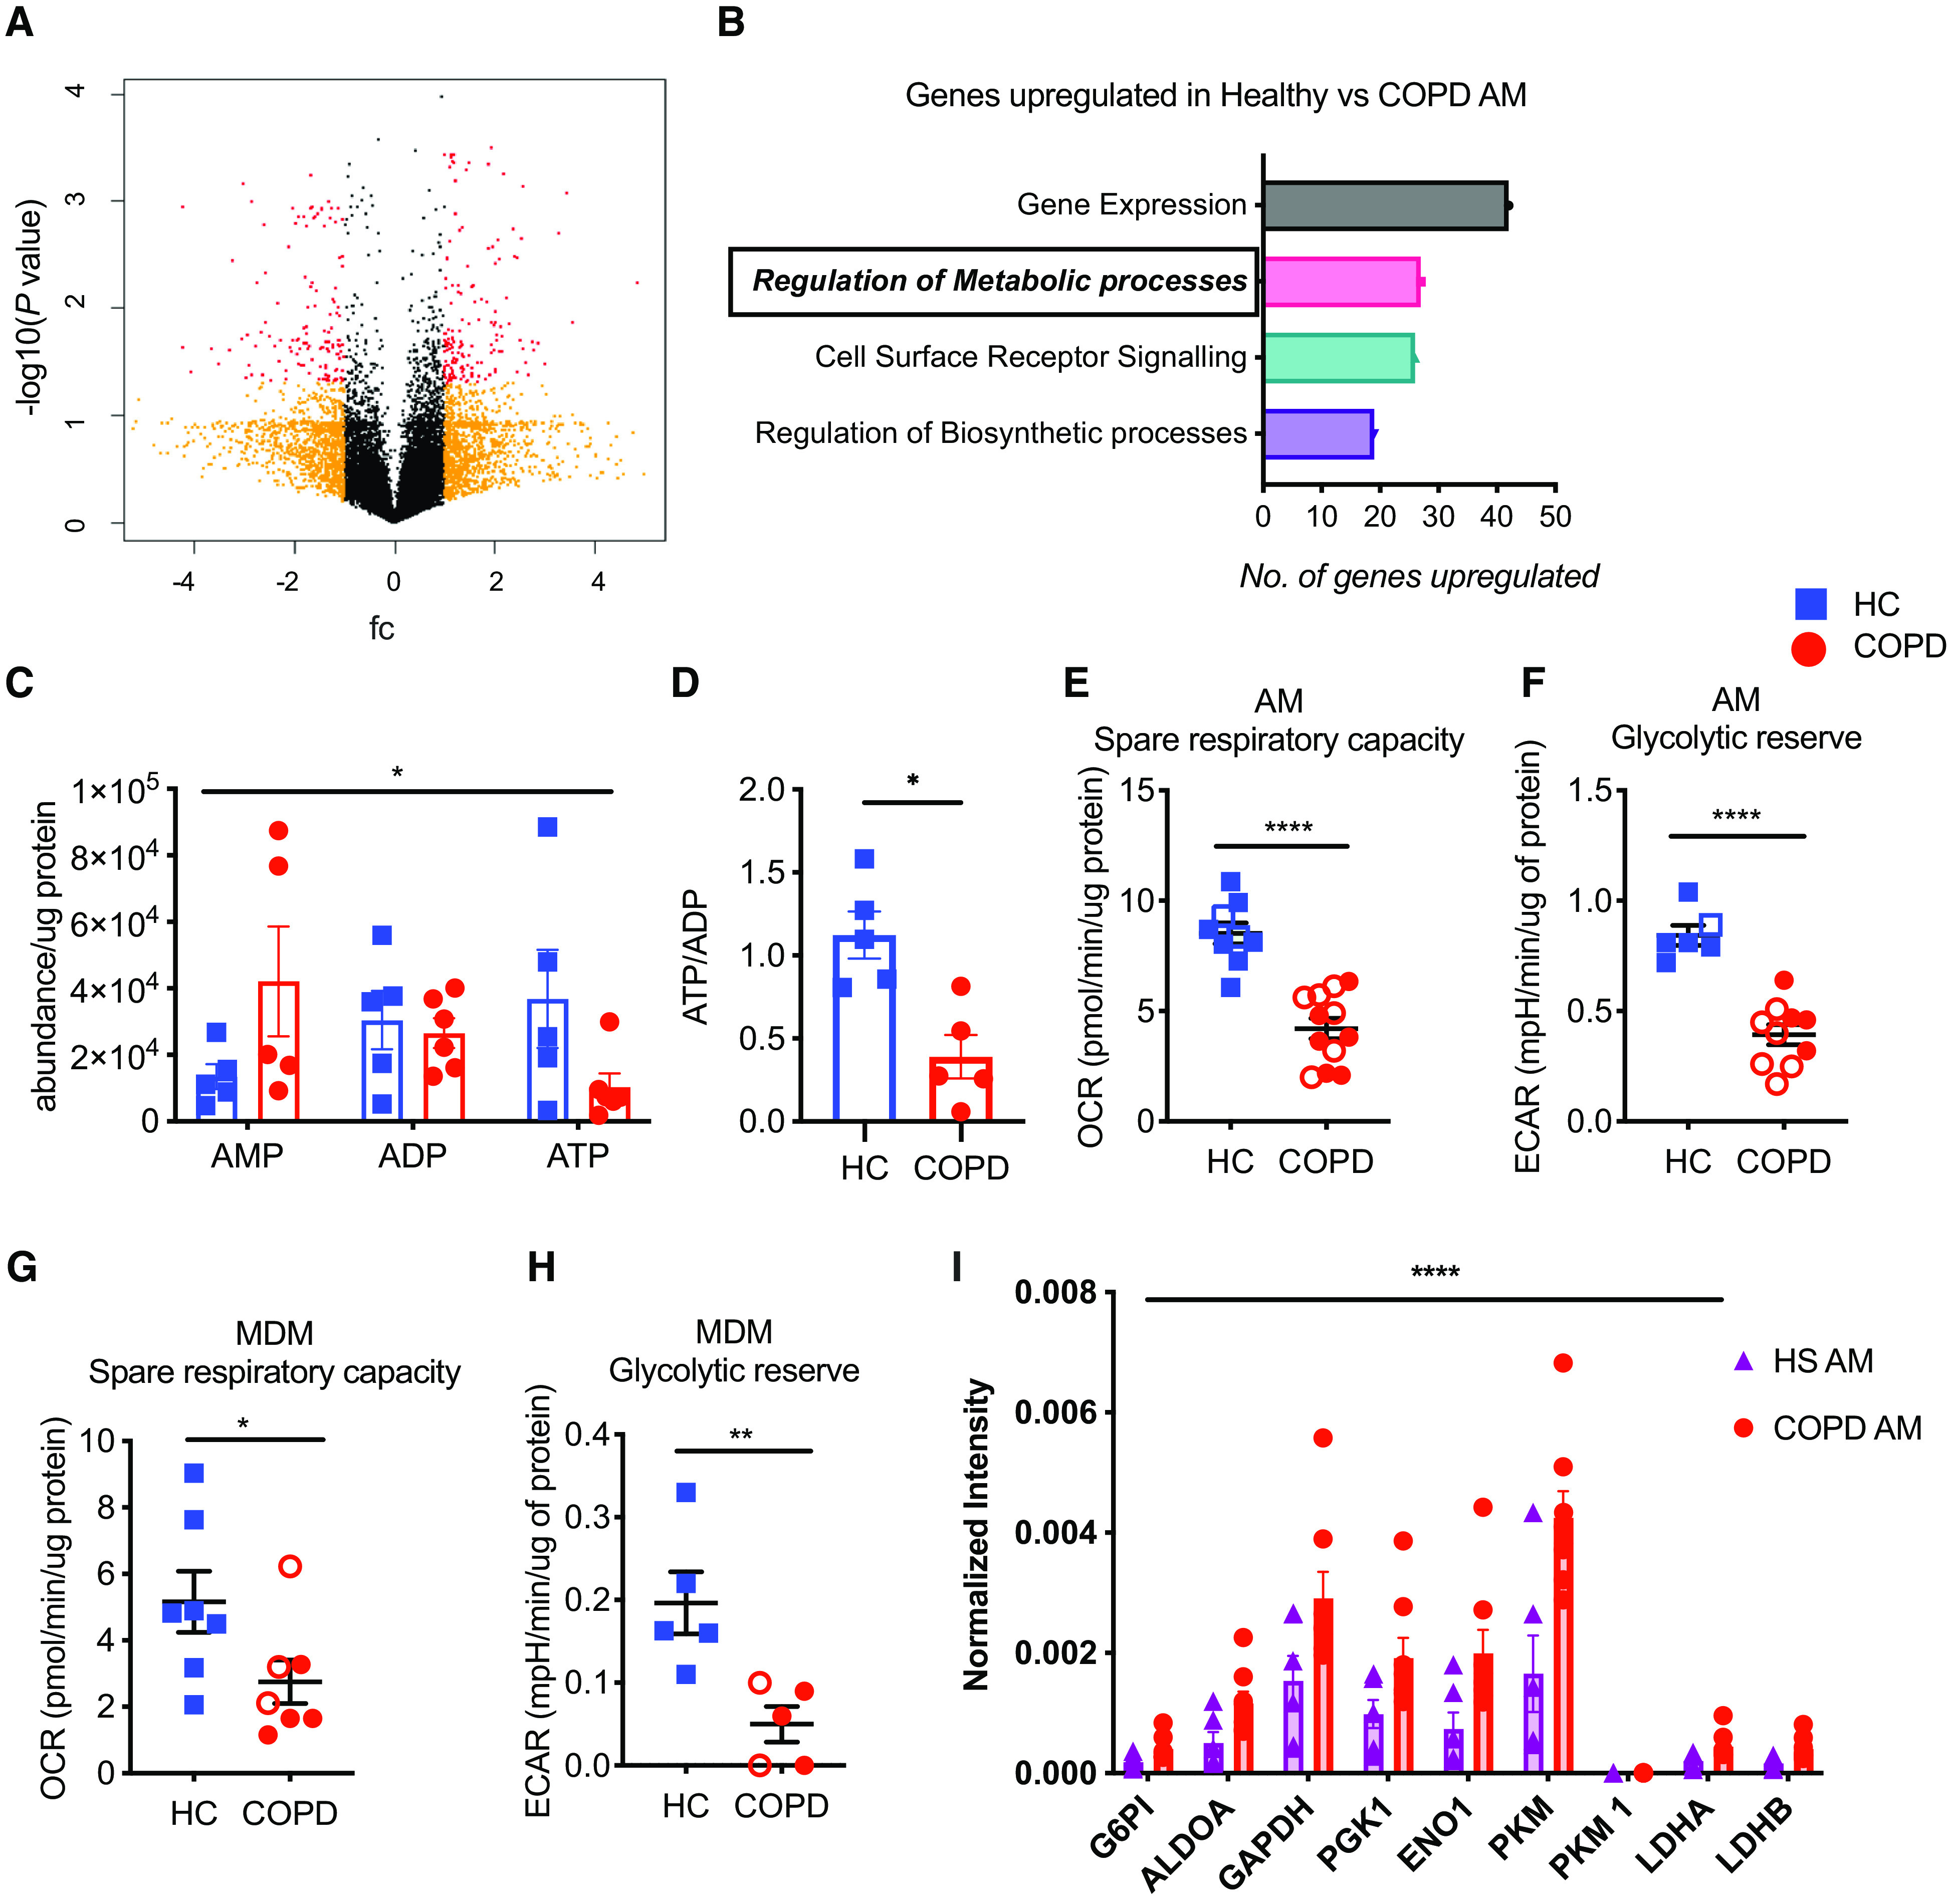
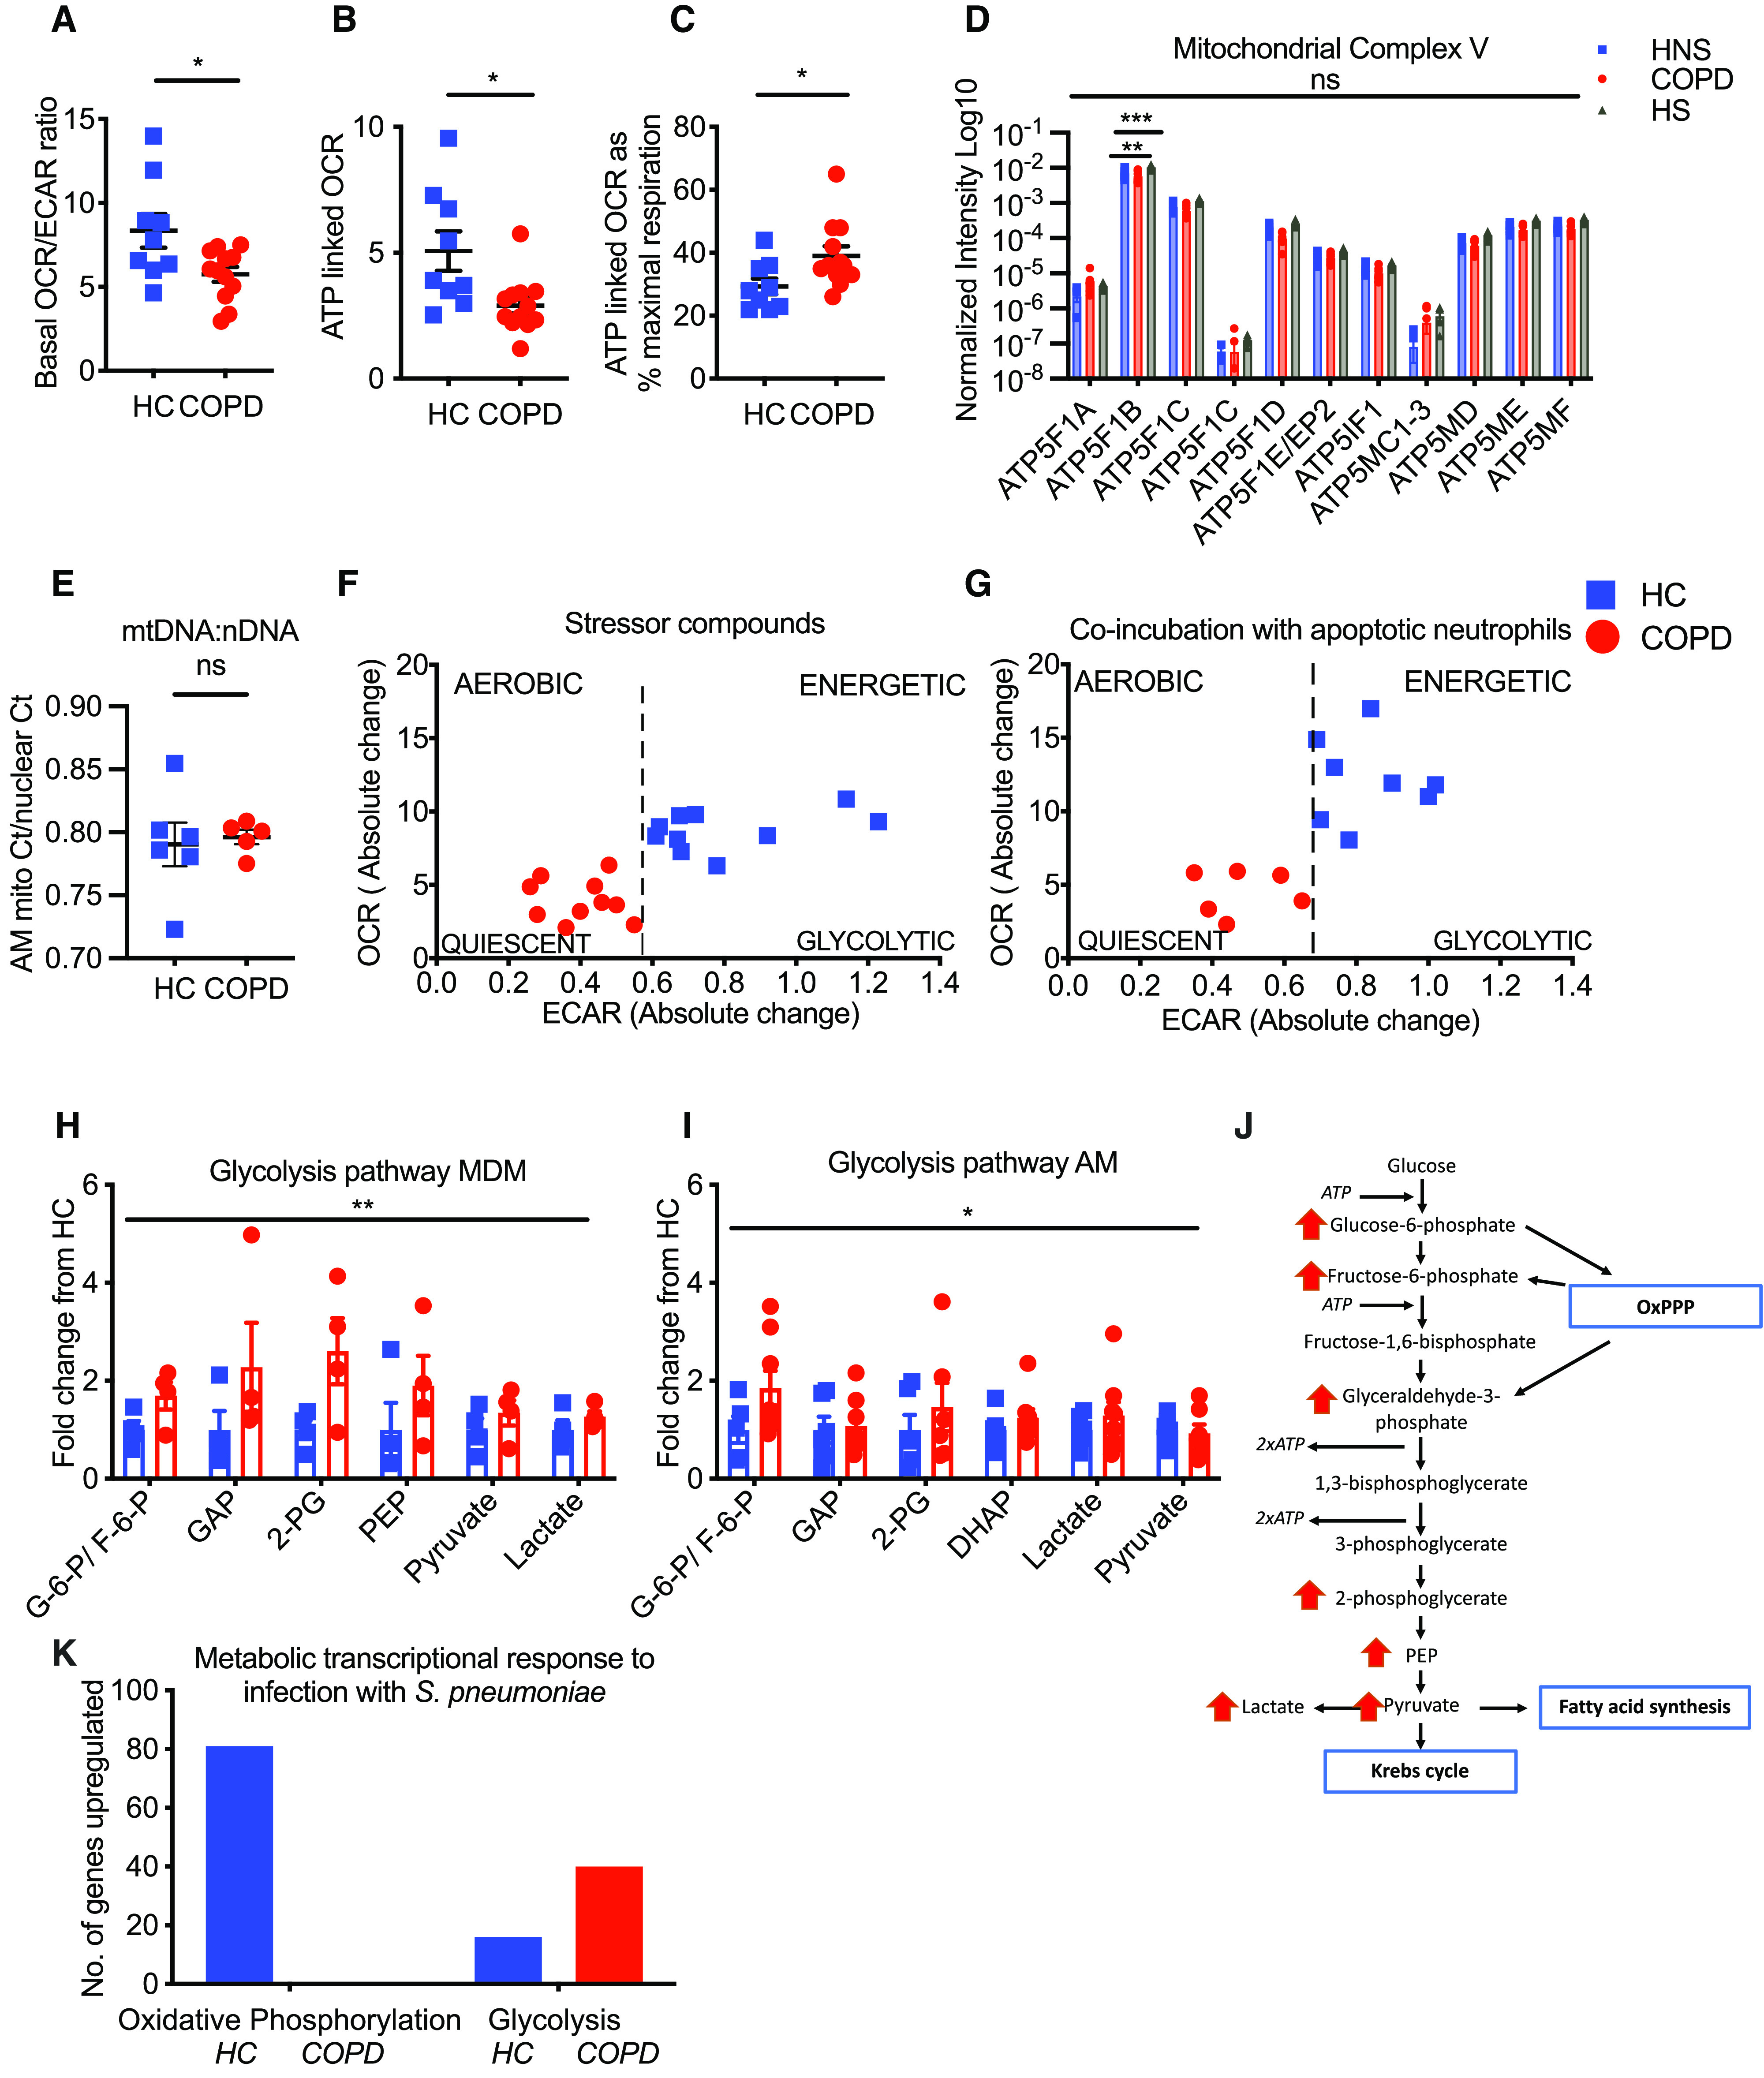
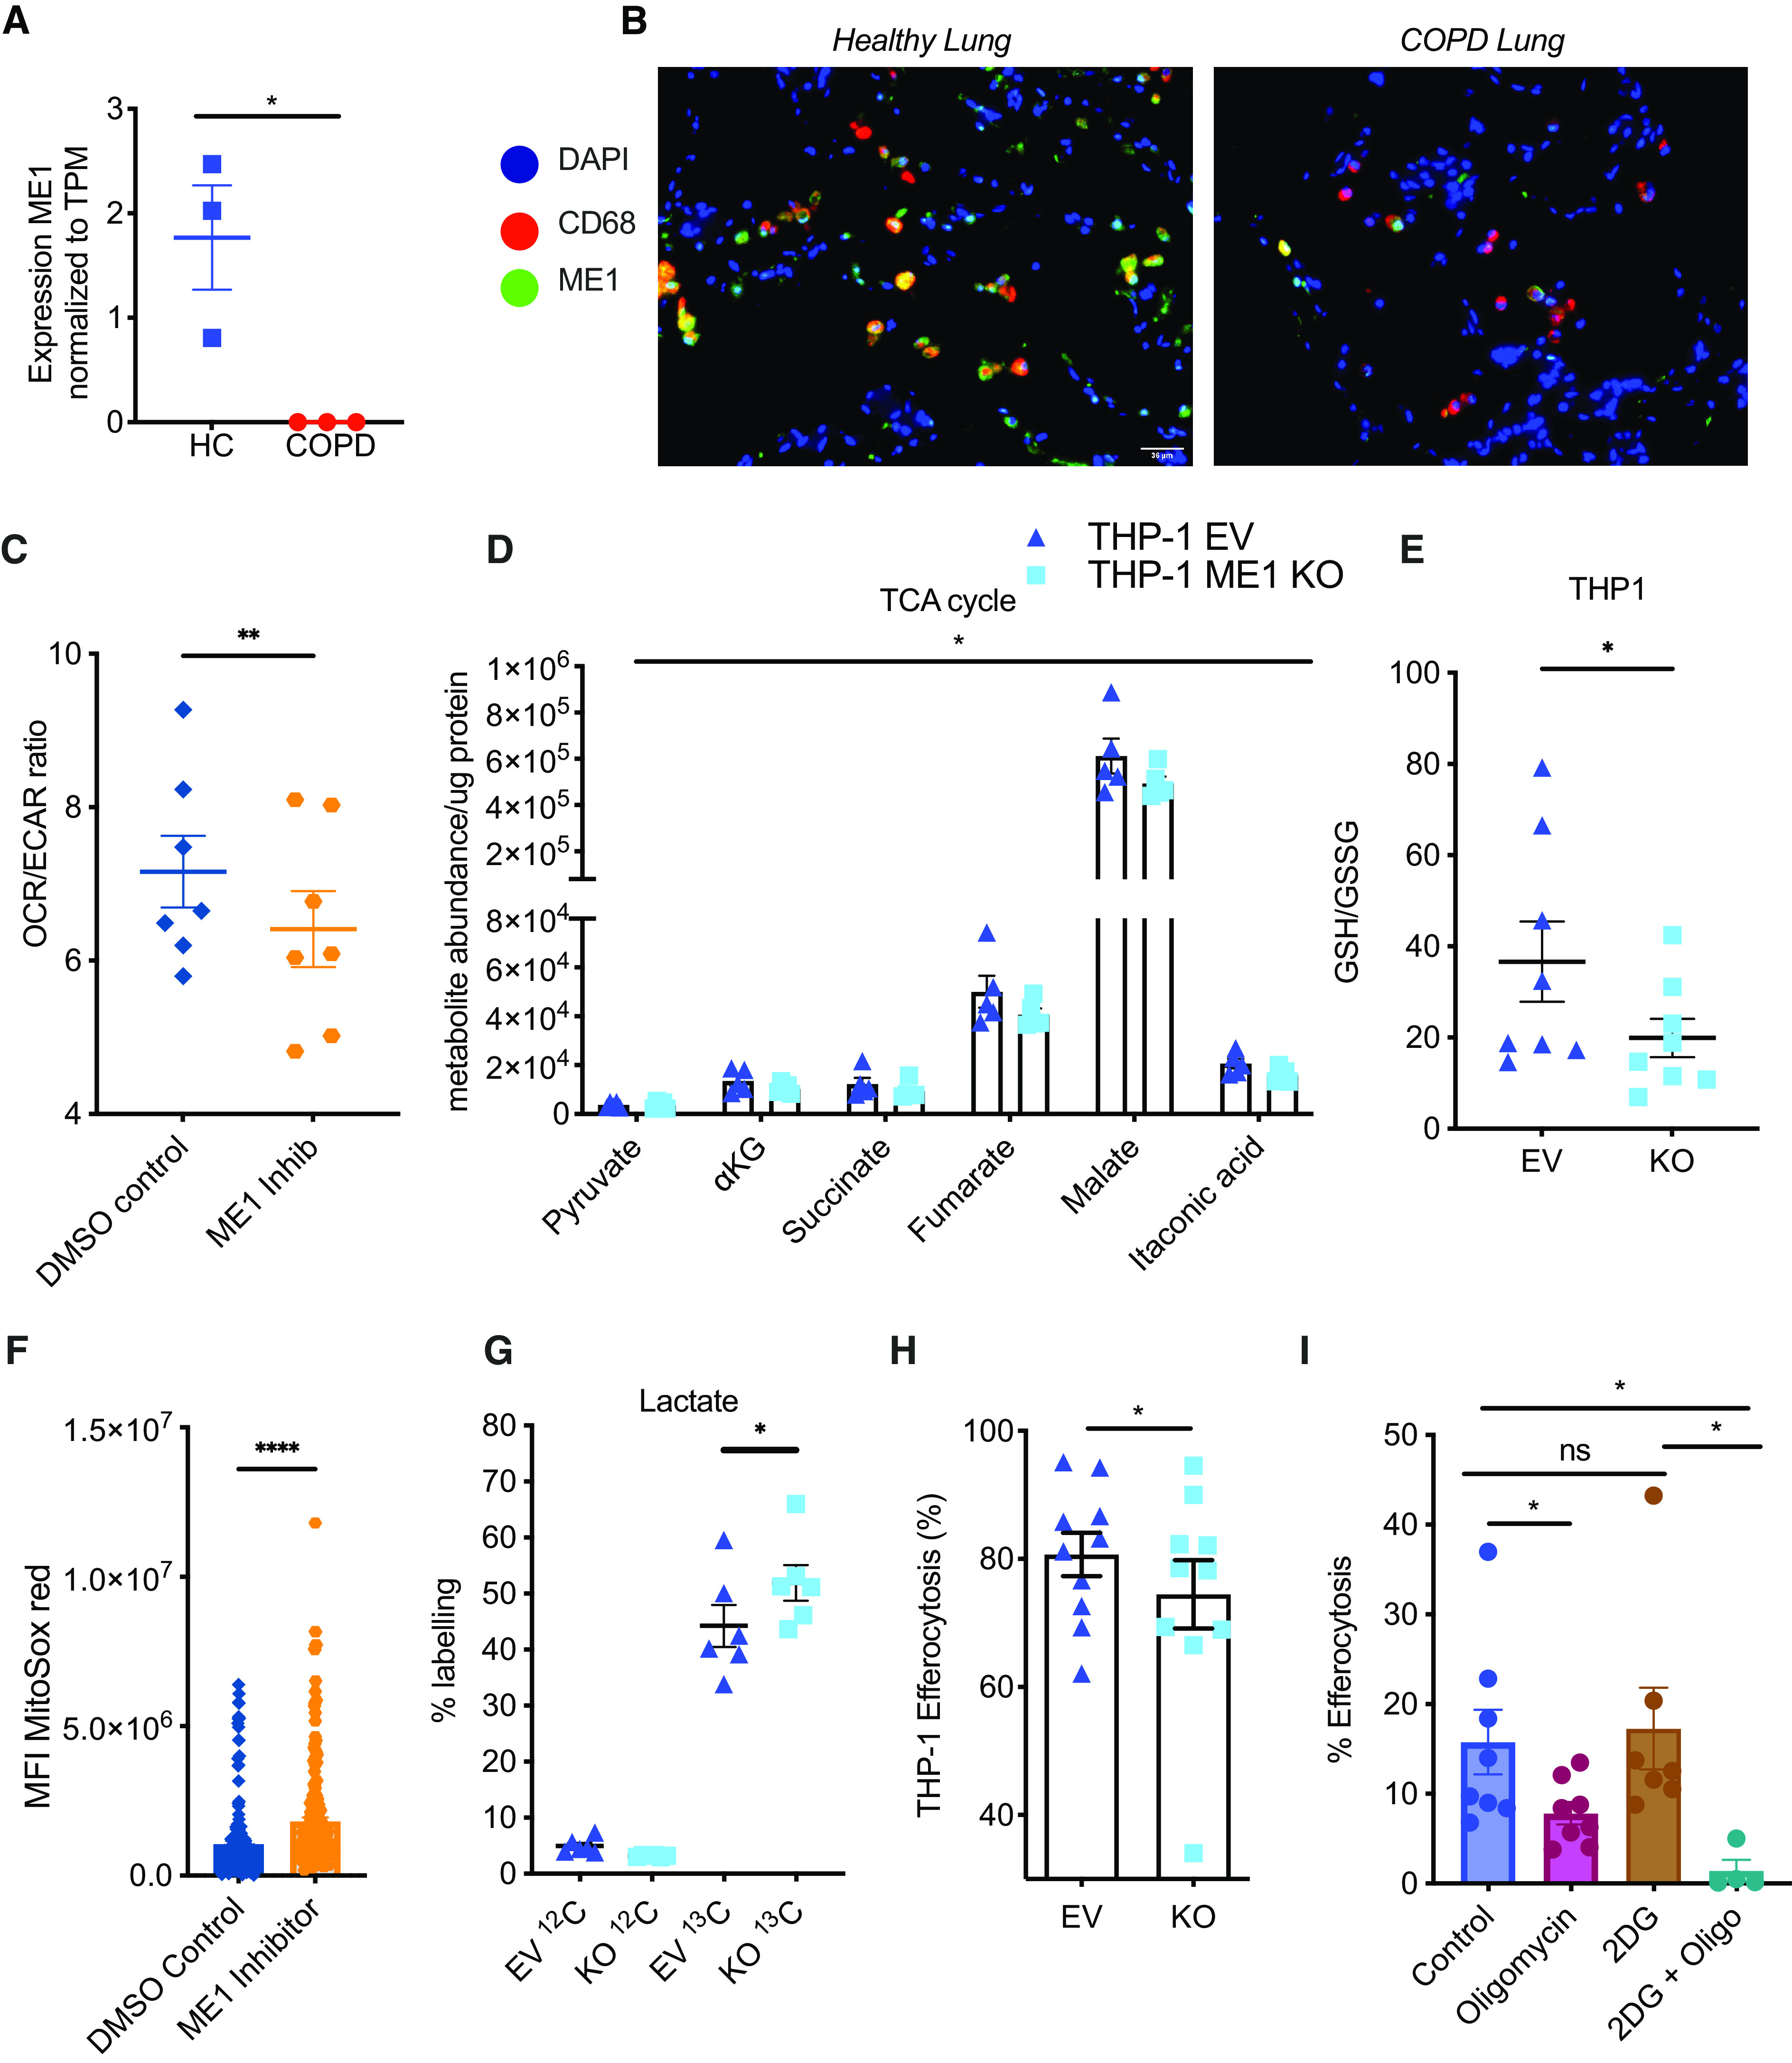
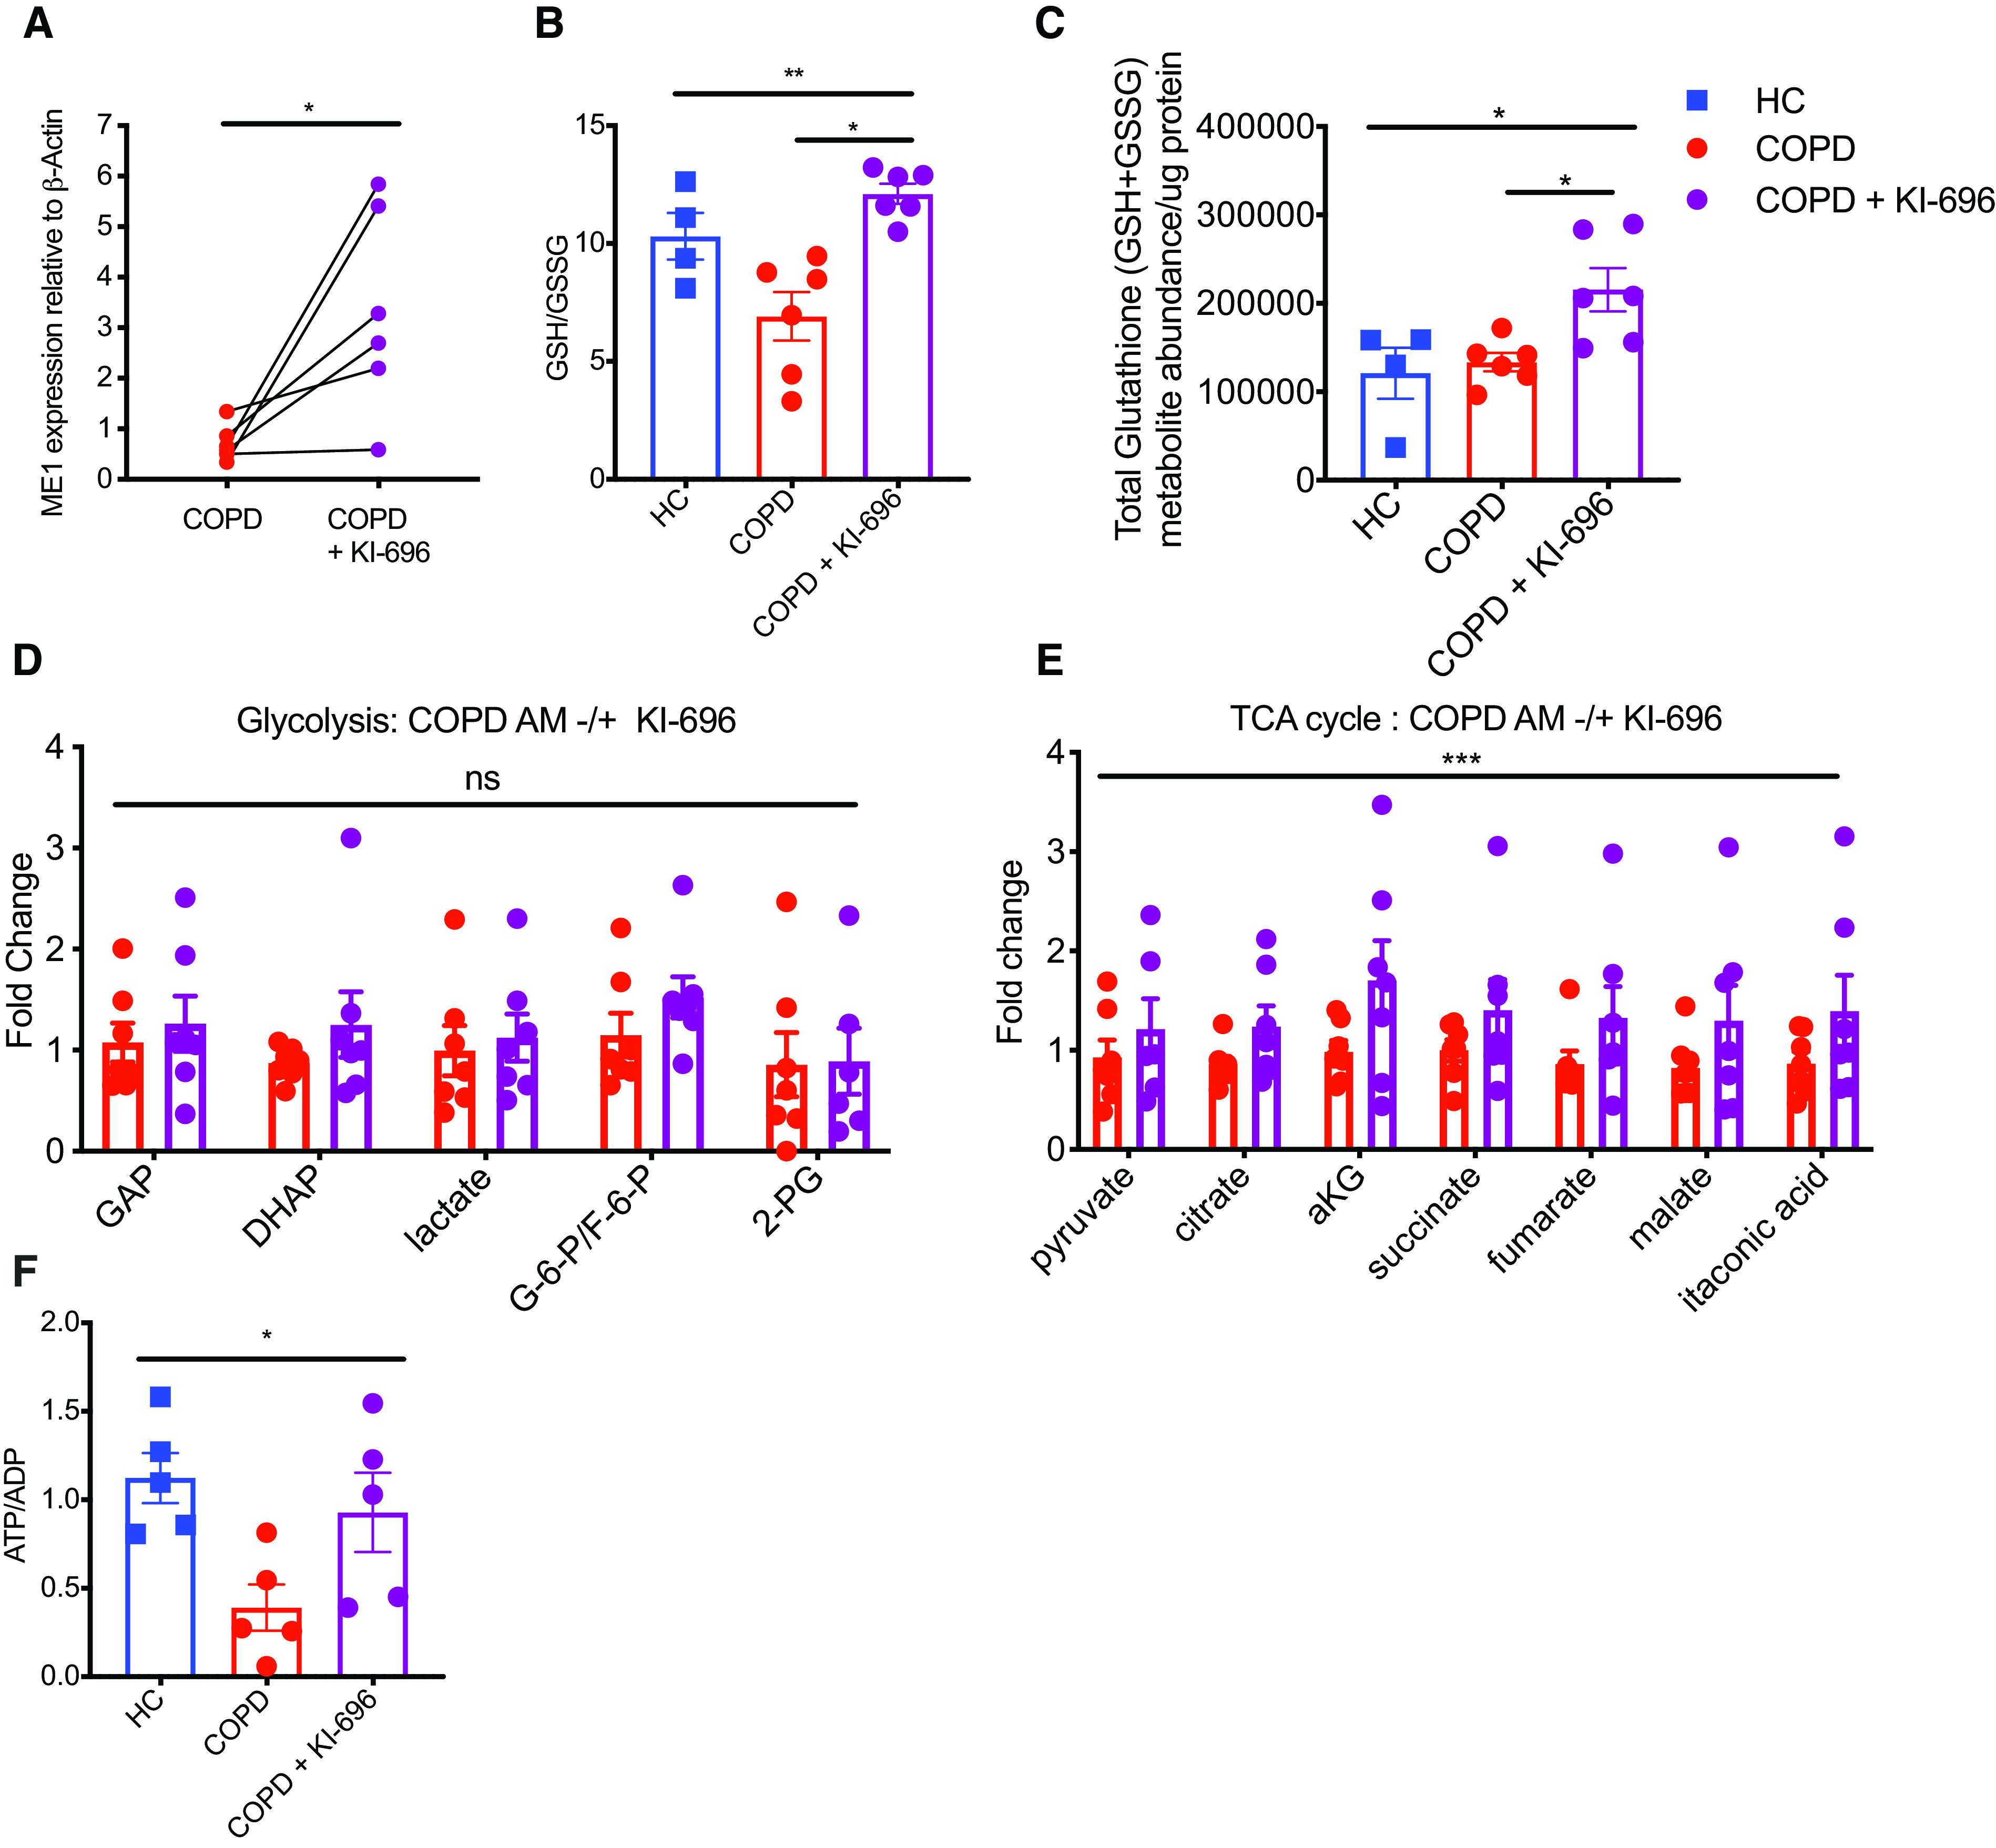
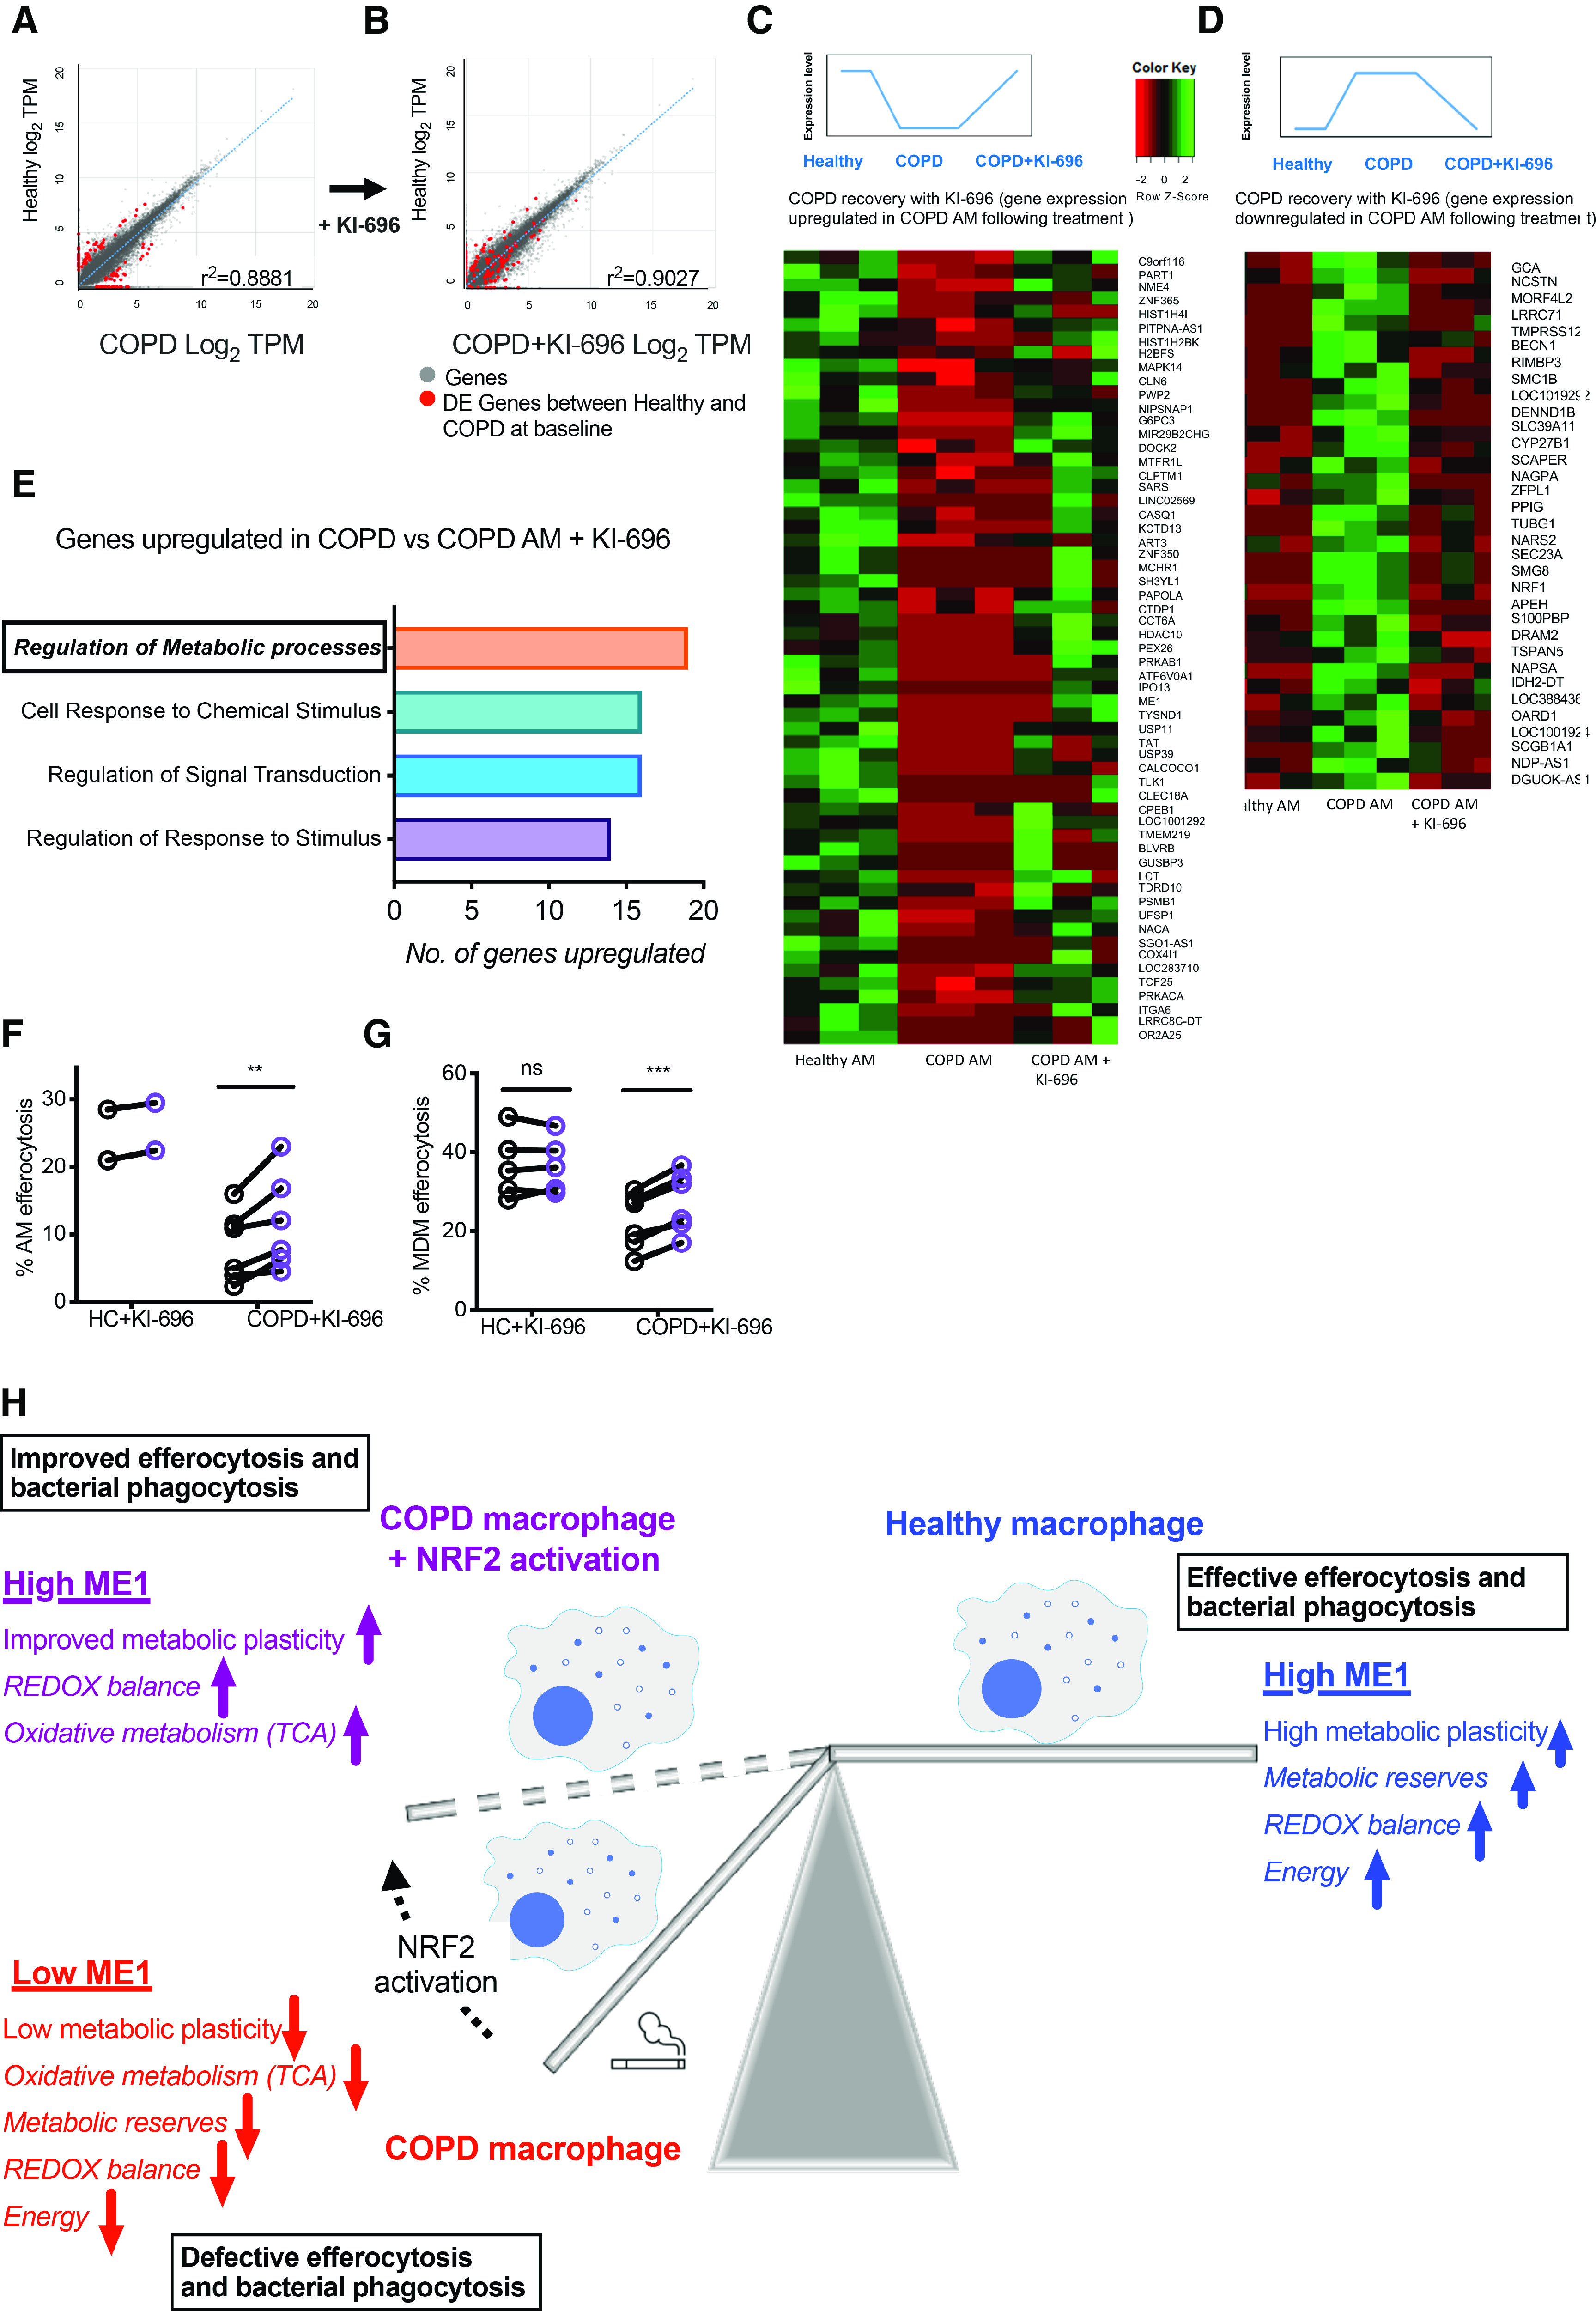
Rationale: Chronic obstructive pulmonary disease (COPD) is a disease characterized by persistent airway inflammation and disordered macrophage function. The extent to which alterations in macrophage bioenergetics contribute to impaired antioxidant responses and disease pathogenesis has yet to be fully delineated. Objectives: Through the study of COPD alveolar macrophages (AMs) and peripheral monocyte-derived macrophages (MDMs), we sought to establish if intrinsic defects in core metabolic processes drive macrophage dysfunction and redox imbalance. Methods: AMs and MDMs from donors with COPD and healthy donors underwent functional, metabolic, and transcriptional profiling. Measurements and Main Results: We observed that AMs and MDMs from donors with COPD display a critical depletion in glycolytic- and mitochondrial respiration-derived energy reserves and an overreliance on glycolysis as a source for ATP, resulting in reduced energy status. Defects in oxidative metabolism extend to an impaired redox balance associated with defective expression of the NADPH-generating enzyme, ME1 (malic enzyme 1), a known target of the antioxidant transcription factor NRF2 (nuclear factor erythroid 2-related factor 2). Consequently, selective activation of NRF2 resets the COPD transcriptome, resulting in increased generation of TCA cycle intermediaries, improved energetic status, favorable redox balance, and recovery of macrophage function. Conclusions: In COPD, an inherent loss of metabolic plasticity leads to metabolic exhaustion and reduced redox capacity, which can be rescued by activation of the NRF2 pathway. Targeting these defects, via NRF2 augmentation, may therefore present an attractive therapeutic strategy for the treatment of the aberrant airway inflammation described in COPD.

Keywords: COPD; macrophage; malic enzyme 1; metabolism; nuclear factor erythroid 2–related factor 2.


Figures

Figure 1.
Figure 1.
Intrinsic defects in chronic obstructive pulmonary disease (COPD) alveolar macrophages (AMs) and peripheral blood monocyte-derived macrophages (MDMs). (A and B) AMs and MDMs from healthy control subjects (HC, squares) and donors with COPD (circles) were challenged with opsonized serotype 14 Saccharomyces pneumoniae for 4 hours and numbers of viable bacteria measured or (C and D) coincubated with PKH26-labeled 20-hour apoptotic neutrophils and efferocytosis rates measured by flow cytometry. (A: HC, n = 6; COPD, n = 8; B: HC/COPD, n = 8; C: HC, n = 8; COPD, n = 11; D: HC/COPD, n = 10). (E and F) COPD AM and MDM efferocytosis were correlated with FEV1% (E: n = 14) and symptoms of disease severity, as measured by the CAT score (F: n = 24). (G and H) Efferocytosis of PKH26-labeled apoptotic neutrophils was correlated with phagocytosis of Saccharomyces pneumoniae S14 in both AMs (G: n = 13) and MDMs (H: n = 24) from patients with COPD and healthy donors. Open squares and circles represent current smokers. Data represent individual values with mean ± SEM. P values calculated by unpaired t test; *P ⩽ 0.05, ***P ⩽ 0.001, and ****P ⩽ 0.0001. Pearson’s correlation coefficient (r) as shown. CAT = COPD Assessment Test.
Figure 2.
Figure 2.
Loss of energy reserves in chronic obstructive pulmonary disease (COPD) macrophages. (A and B) alveolar macrophages (AMs) were isolated from patients with COPD and healthy control (HC) donors via BAL, cultured for 16 hours before collecting RNA for total RNA-sequencing (n = 3). (A) Volcano plots displaying the log2 fold change (FC) between patients with COPD and healthy donors. Red dots (n = 287) represent genes that are significantly altered. Orange dots represent genes that are altered but do not meet significance. (B) Top four Gene Ontology processes upregulated in healthy AMs at baseline, compared with COPD AMs. (C and D) High-performance liquid chromatography–mass spectrometry analysis was performed to determine the levels of ATP, ADP, and AMP in resting state healthy donor (squares) and COPD (circles) AMs and energy charge ([ATP + 1/2ADP]/(ATP + ADP + AMP]) was calculated (n = 5/6). (EH) Seahorse mitochondrial (E and G) and glycolytic (F and H) stress testing in COPD AMs and MDMs (E: HC, n = 9; COPD, n = 12; F: HC, n = 6; COPD, n = 10; G: n = 7; H: n = 5). Open squares and circles indicate current smokers. COPD smoker versus ex-smoker, E: P value = 0.103; F: P value = 0.158; G: P value = 0.17. (I) Glycolytic enzyme abundance in COPD (n = 7) versus HS AMs (n = 5) as determined by data-independent acquisition mass spectrometry proteomic analysis. Data represent individual values ± SEM. (A and B) Significance determined at FC > log21.5 and P value ⩽ 0.05. P values calculated via (C and I) two-way ANOVA, (EG) unpaired t test, or (D and H) Mann-Whitney U test. *P ⩽ 0.05, **P ⩽ 0.01, and ****P ⩽ 0.0001. ECAR = extracellular acidification rate; HS = healthy smoker; MDMs = monocyte-derived macrophages; OCR = oxygen consumption rate.
Figure 3.
Figure 3.
Chronic obstructive pulmonary disease (COPD) macrophages display a preponderance for glycolytic metabolism. (A) Calculated oxygen consumption rate/extracellular acidification rate (OCR/ECAR) ratio in healthy control (HC, squares) and COPD (circles) alveolar macrophages (AMs). (B) OCR consumption linked to ATP generation in healthy and COPD AMs as calculated by the reduction in OCR after oligomycin treatment. (C) ATP-linked OCR as a percentage of maximal OCR in healthy and COPD AMs. HC, n = 9; COPD, n = 12. (D) Relative protein abundance of the 11 detected subunits of Mitochondrial ATP Synthase/Complex V, as measured by data-independent acquisition mass spectrometry proteomic analysis. COPD AMs, n = 7; HNS and HS, n = 5. (E) AM mitochondrial DNA to nuclear DNA ratios, as measured by real-time quantitative PCR. Healthy donor, n = 6; COPD donor, n = 5. (F and G) Absolute change in ECAR was plotted against absolute change in OCR after injection of mitochondrial stressor compounds in resting macrophages (F: n = 21) and after cells were coincubated with 20-hour apoptotic neutrophils for 90 minutes (G: n = 14). (H and I) Glycolytic metabolite abundance determined by high-performance liquid chromatography–mass spectrometry in resting state MDMs (H: n = 4) COPD AMs (I: HC, n = 6; COPD, n = 8), plotted as relative to healthy control. (J) Schematic of glycolytic intermediaries increased throughout the glycolytic pathway in COPD macrophages. (K) The transcriptional response in COPD and healthy control AMs after coincubation with opsonized D39 Streptococcus pneumoniae (n = 3). Data represent individual values and mean ± SEM. P values calculated by (AC) unpaired t test, (E) Mann-Whitney U test, or (D, H, and I) two-way ANOVA. *P ⩽ 0.05, **P ⩽ 0.01, and ***P ⩽ 0.001. HNS = healthy nonsmoker; HS = healthy smoker; MDMs = monocyte-derived macrophages; ns = not significant.
Figure 4.
Figure 4.
Malic enzyme 1 (ME1) plays a critical role in macrophage metabolism and efferocytosis. (A) Transcriptomic analysis of baseline ME1 expression in HC and chronic obstructive pulmonary disease (COPD) alveolar macrophages normalized to TPM (n = 3). (B) ME1 expression in healthy and COPD patient lung sections prepared from paraffin-embedded blocks; images taken at ×20 magnification. (C) Healthy monocyte-derived macrophages (MDMs) were treated ×16 hours with a chemical ME1 inhibitor or DMSO control before measuring the basal OCR:ECAR ratio on a Seahorse platform (n = 7). (D) High-performance liquid chromatography–mass spectrometry analysis of TCA cycle metabolite abundance in THP-1 empty vector control (EV) and ME1 knockout (ME1 KO) cells, normalized to protein content (n = 5). (E) GSH:GSSG ratio calculated in THP-1 EV and ME1 KO cells (n = 9). (F) Healthy MDMs were treated ×16 hours with a chemical ME1 inhibitor or DMSO control. Mean fluorescence intensity of MitoSox Red was then measured from more than 180 cells per condition for three donors. (G) U-13C glucose incorporation into lactate in THP-1 EV and ME1 KO cells after 6 hours of culture in U-13C glucose-containing media (n = 6). (H and I) THP-1 EV and ME1 knockout cells (H) and healthy MDMs pretreated with oligomycin 2 μM, 2DG 50 mM, or oligomycin and 2DG combined for 1 hour (I) before coincubation with PKH26-labeled 20-hour apoptotic neutrophils for 90 minutes and efferocytosis rate determined by flow cytometry (H: n = 8; I: n = 8, 8, 7, and 4, respectively). Data represent individual values and mean ± SEM. P values calculated via (A) adjusted t test values from total RNA-sequencing analysis as outlined in online supplement, (C, E, G, and H) paired t test, (D and I) two-way ANOVA with Dunnett’s multiple comparisons, or (F) Wilcoxon matched-pairs signed-rank test. *P ⩽ 0.05, **P ⩽ 0.01, and ****P ⩽ 0.0001. ECAR = extracellular acidification rate; HC = healthy control; MFI = mean fluorescence intensity; ns = not significant; OCR = oxygen consumption rate; TPM = transcripts per kilobase million.
Figure 5.
Figure 5.
Cellular energetics and redox status are improved in chronic obstructive pulmonary disease (COPD) alveolar macrophages (AMs) after activation of malic enzyme 1 (ME1) via the NRF2 (nuclear factor erythroid 2–related factor 2) agonist KI-696. (A) Real-time PCR quantification of ME1 expression relative to β-actin in COPD AMs after culture in the absence or presence of KI-696 (n = 6). (B and C) Treatment with Ki-696 alters redox protection in COPD AMs as measured by (B) GSH:GSSG ratios and (C) absolute total glutathione abundance (GSH and GSSG) (HC, n = 4; COPD, n = 6). (D and E) Liquid chromatography–mass spectrometry analysis of healthy and COPD AMs (±KI-696). Metabolite abundance is plotted as relative to untreated COPD AMs (fold change) (n = 7). (F) Energy status expressed as an ATP-to-ADP ratio was calculated (n = 5). Data represent individual values and mean ± SEM. P values calculated via (A) paired t test, (B, C, and F) Kruskal-Wallis with Dunn’s multiple comparison tests, or (D and E) two-way ANOVA. *P ⩽ 0.05, **P ⩽ 0.01, and ***P ⩽ 0.001. HC = healthy control; ns = not significant.
Figure 6.
Figure 6.
Activation of NRF2 (nuclear factor erythroid 2–related factor 2) with KI-696 reprograms alveolar macrophages (AMs) in chronic obstructive pulmonary disease (COPD) with consequences for effector function. (AE) Healthy control (HC) and COPD AMs were cultured for 16 hours (±KI-696) before collection of RNA for total RNA-sequencing (n = 3). (A and B) Correlation analysis between healthy and COPD AMs before and after treatment with KI-696. Red dots represent significantly differentially expressed genes between COPD and healthy AMs at baseline, which are seen to move toward the trendline in B. (C and D) Heatmap of normalized z-scores showing genes that were initially comparatively downregulated (C) or upregulated (D) in COPD versus healthy AMs, which were transcriptionally reprogrammed by treatment with KI-696, in the direction of healthy AMs. (E) The lead Gene Ontology terms upregulated in COPD AMs after treatment with KI-696. (F and G) COPD AMs (F: HC, n = 2; COPD, n = 6) and MDMs (G: HC, n = 5; COPD, n = 6) were pretreated for 16 hours with the NRF2 activator KI-696, before coincubation with PKH26-labeled 20-hour apoptotic neutrophils and measurement of efferocytosis rates by flow cytometry. (H) Summary diagram of metabolic changes in COPD macrophages and the role of NRF2 augmentation. Data represent individual values and mean ± SEM. (A and B) Scatter plots were generated by plotting the average log2 tags per million (TPM) scores for healthy AMs versus the average log2 TPM scores for COPD AMs ±KI-696. R2 values were calculated from the slope of the correlation trendline. DE genes = FC > log21.5 and P value ⩽ 0.05. (F and G) P values calculated via (F) paired t test, or (G) donors with COPD paired t test, and healthy donors by Wilcoxon matched-pairs signed-rank test. **P ⩽ 0.01 and ***P ⩽ 0.001. DE = differentially expressed; FC = fold change; MDMs = monocyte-derived macrophages; ME1 = malic enzyme 1; ns = not significant; TCA = tricarboxylic acid cycle.

Comment in

References

    1. Willemse BW, ten Hacken NH, Rutgers B, Lesman-Leegte IG, Postma DS, Timens W. Effect of 1-year smoking cessation on airway inflammation in COPD and asymptomatic smokers. Eur Respir J . 2005;26:835–845. - PubMed
    1. Hogg JC, Chu F, Utokaparch S, Woods R, Elliott WM, Buzatu L, et al. The nature of small-airway obstruction in chronic obstructive pulmonary disease. N Engl J Med . 2004;350:2645–2653. - PubMed
    1. Patel IS, Seemungal TAR, Wilks M, Lloyd-Owen SJ, Donaldson GC, Wedzicha JA. Relationship between bacterial colonisation and the frequency, character, and severity of COPD exacerbations. Thorax . 2002;57:759–764. - PMC - PubMed
    1. Oltmanns U, Sukkar MB, Xie S, John M, Chung KF. Induction of human airway smooth muscle apoptosis by neutrophils and neutrophil elastase. Am J Respir Cell Mol Biol . 2005;32:334–341. - PubMed
    1. Berenson CS, Garlipp MA, Grove LJ, Maloney J, Sethi S. Impaired phagocytosis of nontypeable Haemophilus influenzae by human alveolar macrophages in chronic obstructive pulmonary disease. J Infect Dis . 2006;194:1375–1384. - PubMed

Publication types

MeSH terms

Substances