. 2023:37:103336.
doi: 10.1016/j.nicl.2023.103336. Epub 2023 Jan 22.

Atypical cortical processing of bottom-up speech binding cues in children with autism spectrum disorders

Affiliations

Atypical cortical processing of bottom-up speech binding cues in children with autism spectrum disorders

Jussi Alho et al. Neuroimage Clin. 2023.

Abstract

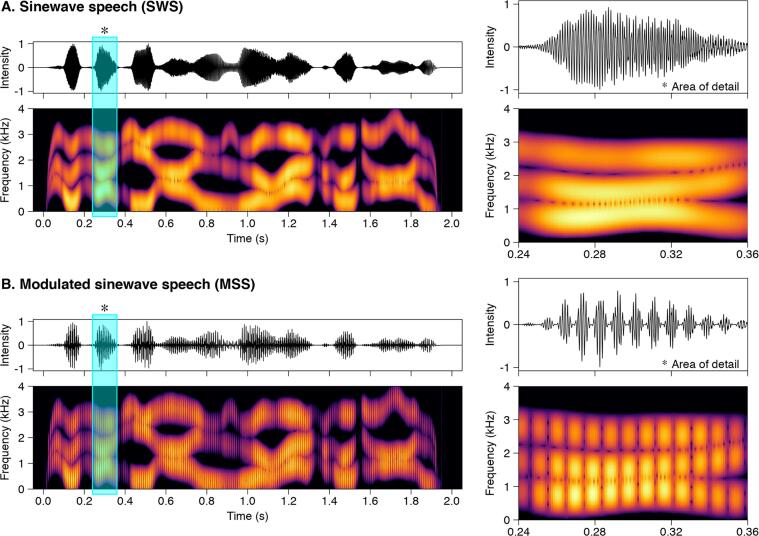
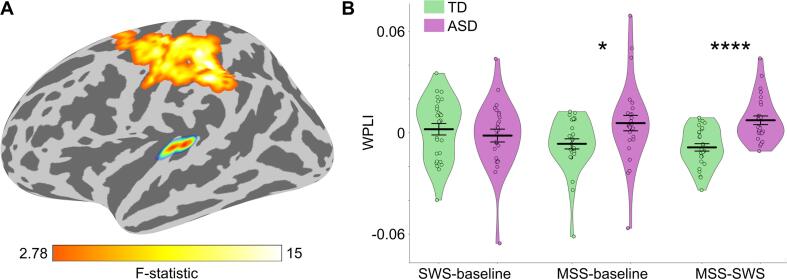
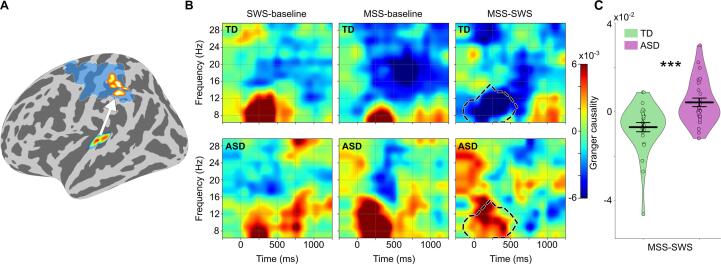
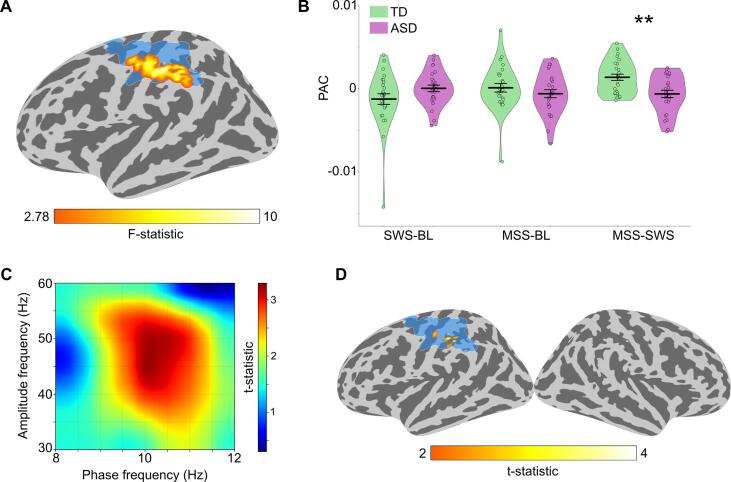
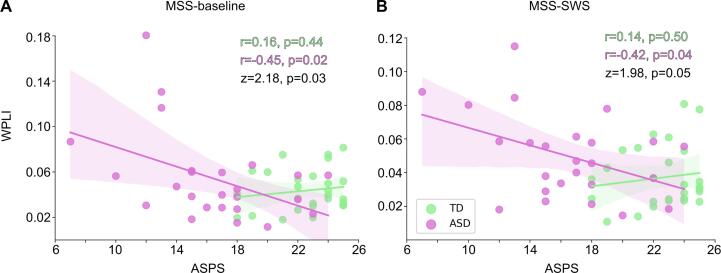
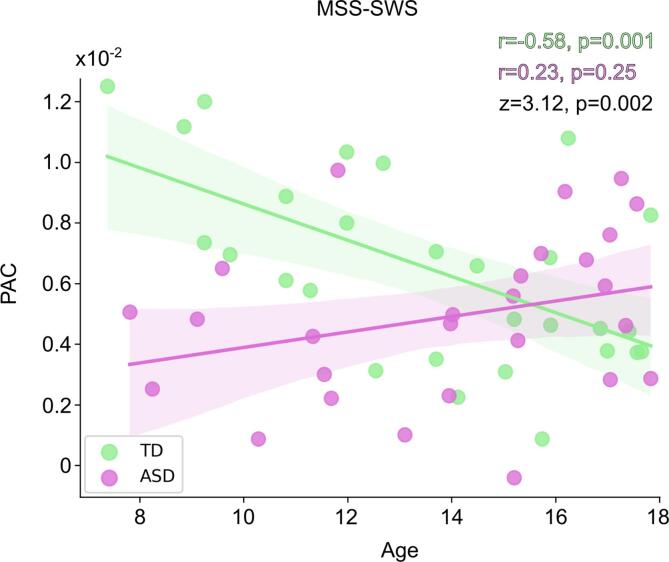
Individuals with autism spectrum disorder (ASD) commonly display speech processing abnormalities. Binding of acoustic features of speech distributed across different frequencies into coherent speech objects is fundamental in speech perception. Here, we tested the hypothesis that the cortical processing of bottom-up acoustic cues for speech binding may be anomalous in ASD. We recorded magnetoencephalography while ASD children (ages 7-17) and typically developing peers heard sentences of sine-wave speech (SWS) and modulated SWS (MSS) where binding cues were restored through increased temporal coherence of the acoustic components and the introduction of harmonicity. The ASD group showed increased long-range feedforward functional connectivity from left auditory to parietal cortex with concurrent decreased local functional connectivity within the parietal region during MSS relative to SWS. As the parietal region has been implicated in auditory object binding, our findings support our hypothesis of atypical bottom-up speech binding in ASD. Furthermore, the long-range functional connectivity correlated with behaviorally measured auditory processing abnormalities, confirming the relevance of these atypical cortical signatures to the ASD phenotype. Lastly, the group difference in the local functional connectivity was driven by the youngest participants, suggesting that impaired speech binding in ASD might be ameliorated upon entering adolescence.

Keywords: Autism; Functional connectivity; Magnetoencephalography; Phase-amplitude coupling; Speech.


Conflict of interest statement

Declaration of Competing Interest The authors declare that they have no known competing financial interests or personal relationships that could have appeared to influence the work reported in this paper.

Figures

Fig. 1
Fig. 1
Stimuli. Waveforms and spectrograms showing the acoustic differences between (A) sinewave speech (SWS) and (B) modulated sinewave speech (MSS). The * and light blue boxes highlight the areas of detail in the two stimulus types, shown at right. Note the presence of temporal modulation in the MSS stimuli evident in both the waveform and spectrogram, which facilitates perceptual binding of the three frequency components into a coherent auditory object. (For interpretation of the references to colour in this figure legend, the reader is referred to the web version of this article.)
Fig. 2
Fig. 2
Functional regions-of-interest (ROIs). Probability map of left and right A1 delineation overlap across participants (N = 55).
Fig. 3
Fig. 3
Seed-based functional connectivity. (A) Cluster of significant seed-based connectivity (WPLI) group difference in MSS relative to SWS (MSS-SWS) at alpha band (8–12 Hz), with the seed (left A1) also shown. (B) Plots of group mean WPLI (thick horizontal black line) with kernel density estimation (KDE) of the underlying distributions for SWS-baseline, MSS-baseline, and MSS-SWS. Individual WPLI values are overlaid on the KDE plot. The WPLI values were derived by averaging values within the cluster in A. Error bars around the mean represent standard error of the mean. Statistically significant group differences in Wilcoxon rank-sum test are indicated by asterisks (*p < 0.05, ****p < 0.0001).
Fig. 4
Fig. 4
Directionality of the functional connectivity. (A) Feedforward functional connectivity between the left A1 and the parietal area showing the strongest group difference in the MSS relative to SWS (MSS-SWS) functional connectivity (red-yellow cluster) estimated using nonparametric Granger causality. The blue area denotes the whole area of significant MSS-SWS group difference in the seed-based connectivity of the left A1 (see Fig. 3A). (B) Group mean Granger causality scores for SWS-baseline, MSS-baseline, and MSS-SWS in time–frequency domain with statistically significant group difference cluster outlined. The time axis indicates the center points of the 500 ms sliding windows from 0 to 1500 ms. (C) Group mean Granger causality scores (thick horizontal black line) within the MSS-SWS cluster in B (encircled with black dashed line) with kernel density estimation (KDE) of the underlying distributions for MSS-SWS. Individual scores are overlaid on the KDE plot. Error bars around the mean represent standard error of the mean. ***p < 0.001 in Wilcoxon rank-sum test. (For interpretation of the references to colour in this figure legend, the reader is referred to the web version of this article.)
Figure 5
Figure 5
Phase-amplitude coupling (PAC). (A) Cluster of significant group difference in alpha phase (8–12 Hz) to gamma (30–60 Hz) amplitude coupling in the MSS relative to SWS condition (MSS-SWS). The blue area denotes the area of significant MSS-SWS group difference in the seed-based connectivity of the left A1 (see Fig. 3A). (B) Plots of group mean PAC (thick horizontal black line) with kernel density estimation (KDE) of the underlying distributions for the SWS-baseline, MSS-baseline, and MSS-SWS. Individual PAC values are overlaid on the KDE plot. The PAC values were derived by averaging values within the cluster in A. Error bars around the mean represent standard error of the mean. Statistically significant group differences in Wilcoxon rank-sum test are indicated by asterisks (**p < 0.01). (C) PAC group difference t-statistics in the MSS-SWS condition within the cluster in A. (D) PAC group difference t-statistics in the MSS-SWS condition in the whole cortex, calculated using the frequencies of the peak group difference determined from C (i.e., 10 Hz for phase and 45 Hz for amplitude) and thresholded at p < 0.05 (one-tailed) and cluster size > 10 vertices. For whole-cortex PAC group difference calculated using the full frequency range (i.e., alpha [8–12 Hz] phase to gamma [30–60 Hz] amplitude), see Supplementary Figure S6.
Fig. 6
Fig. 6
Correlation between the seed-based functional connectivity and scores measuring auditory processing abnormalities (ASPS). Correlation between the ASPS scores and functional connectivity in (A) MSS-baseline and (B) MSS-SWS. The functional connectivity values were extracted from the cluster showing significant group difference in the seed-based connectivity of the left A1 (see Fig. 3A). The shaded areas (TD in green, ASD in purple) encompass the 95% confidence interval for the correlation. Correlation coefficients (r) and p-values for the within-group correlations, and z-scores and p-values for the difference between the within-group correlations are shown in the plots. (For interpretation of the references to colour in this figure legend, the reader is referred to the web version of this article.)
Fig. 7
Fig. 7
Phase-amplitude coupling (PAC) maturational trajectories. Correlation between PAC and age in MSS-SWS. The PAC values were extracted from the cluster showing significant group difference (see Fig. 5A). The shaded areas (TD in green, ASD in purple) encompass the 95% confidence interval for the correlation. Correlation coefficients (r) and p-values for within-group correlations, and z-scores and p-values for the difference between the within-group correlations are shown in the plot. (For interpretation of the references to colour in this figure legend, the reader is referred to the web version of this article.)

References

    1. Alcántara J.I., Weisblatt E.J.L., Moore B.C.J., Bolton P.F. Speech-in-noise perception in high-functioning individuals with autism or Asperger’s syndrome. J. Child Psychol. Psychiatry Allied Discip. 2004;45(6):1107–1114. - PubMed
    1. Alho J., Bharadwaj H., Khan S., Mamashli F., Perrachione T.K., Losh A., McGuiggan N.M., Joseph R.M., Hämäläinen M.S., Kenet T. Altered maturation and atypical cortical processing of spoken sentences in autism spectrum disorder. Prog. Neurobiol. 2021;203 - PMC - PubMed
    1. Amso D., Haas S., Tenenbaum E., Markant J., Sheinkopf S.J. Bottom-up attention orienting in young children with autism. J. Autism Dev. Disord. 2014;44(3):664–673. - PMC - PubMed
    1. Arnett A.B., Hudac C.M., DesChamps T.D., Cairney B.E., Gerdts J., Wallace A.S., Bernier R.A., Webb S.J. Auditory perception is associated with implicit language learning and receptive language ability in autism spectrum disorder. Brain Lang. 2018;187:1–8. - PMC - PubMed
    1. Ben-Sasson A., Hen L., Fluss R., Cermak S.A., Engel-Yeger B., Gal E. A meta-analysis of sensory modulation symptoms in individuals with autism spectrum disorders. J. Autism Dev. Disord. 2009;39(1):1–11. - PubMed

Publication types

LinkOut - more resources