. 2023 Mar 2;110(3):499-515.
doi: 10.1016/j.ajhg.2023.01.006. Epub 2023 Jan 31.

Bi-allelic TTI1 variants cause an autosomal-recessive neurodevelopmental disorder with microcephaly

Affiliations

Bi-allelic TTI1 variants cause an autosomal-recessive neurodevelopmental disorder with microcephaly

Margaux Serey-Gaut et al. Am J Hum Genet. .

Abstract

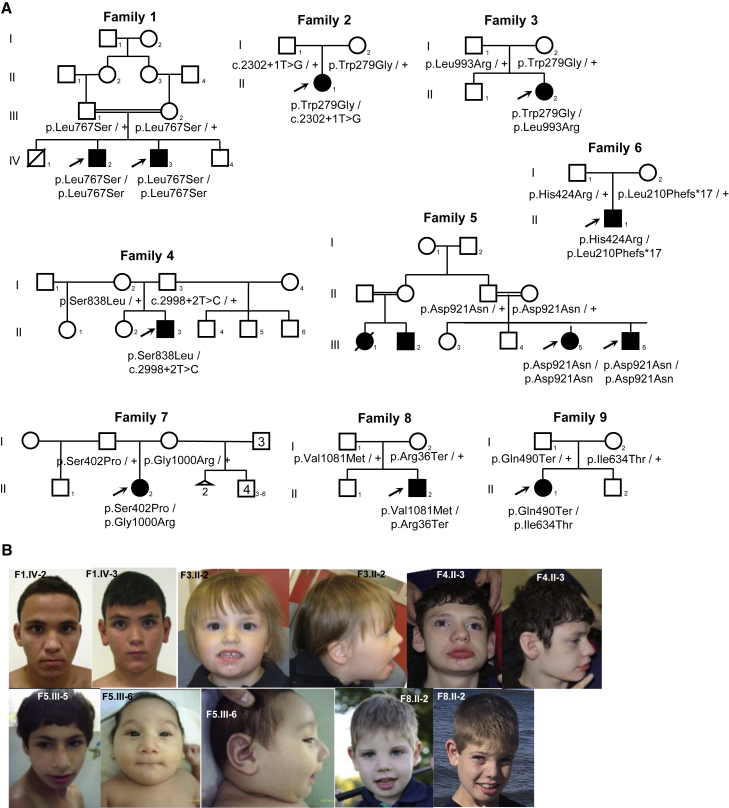
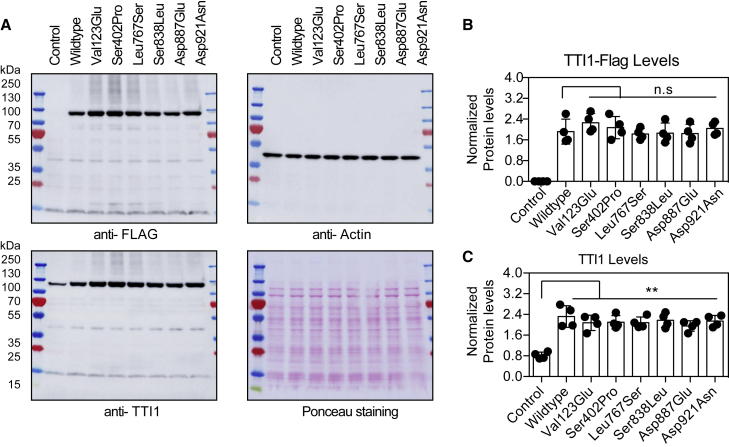
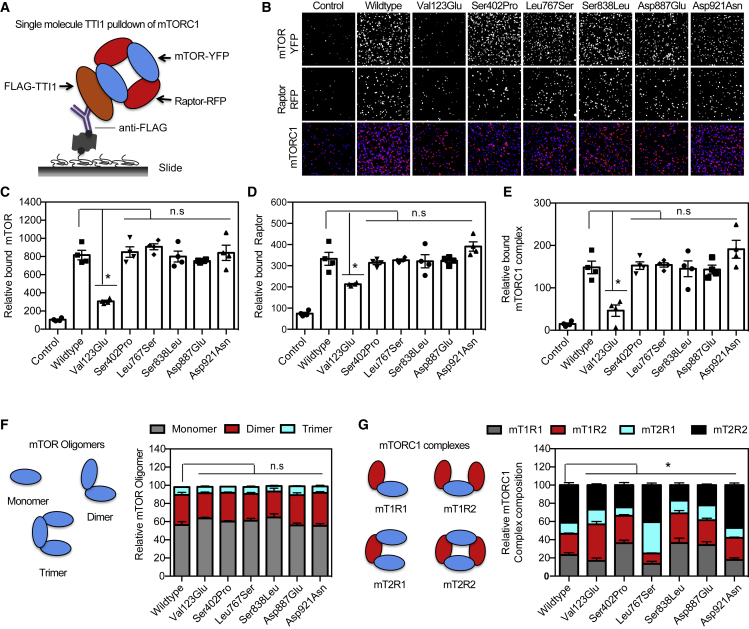
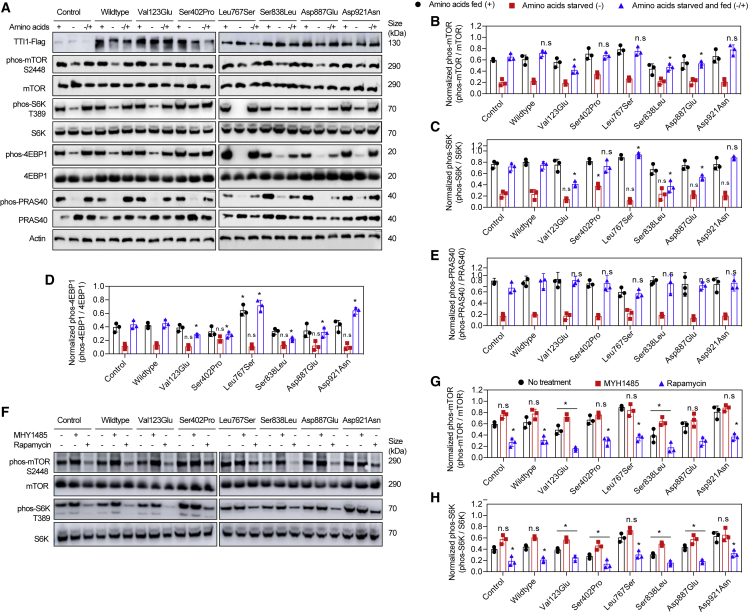
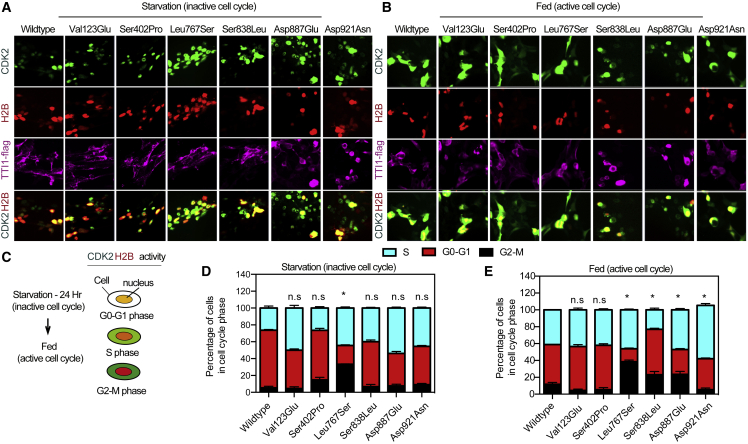
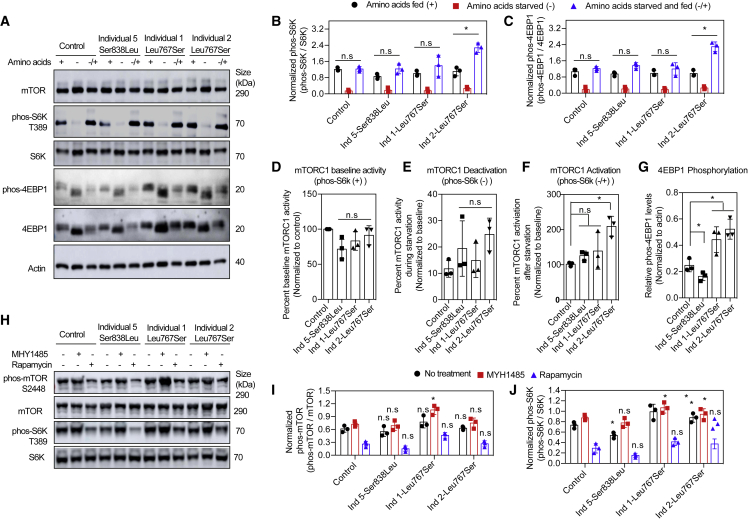
Telomere maintenance 2 (TELO2), Tel2 interacting protein 2 (TTI2), and Tel2 interacting protein 1 (TTI1) are the three components of the conserved Triple T (TTT) complex that modulates activity of phosphatidylinositol 3-kinase-related protein kinases (PIKKs), including mTOR, ATM, and ATR, by regulating the assembly of mTOR complex 1 (mTORC1). The TTT complex is essential for the expression, maturation, and stability of ATM and ATR in response to DNA damage. TELO2- and TTI2-related bi-allelic autosomal-recessive (AR) encephalopathies have been described in individuals with moderate to severe intellectual disability (ID), short stature, postnatal microcephaly, and a movement disorder (in the case of variants within TELO2). We present clinical, genomic, and functional data from 11 individuals in 9 unrelated families with bi-allelic variants in TTI1. All present with ID, and most with microcephaly, short stature, and a movement disorder. Functional studies performed in HEK293T cell lines and fibroblasts and lymphoblastoid cells derived from 4 unrelated individuals showed impairment of the TTT complex and of mTOR pathway activity which is improved by treatment with Rapamycin. Our data delineate a TTI1-related neurodevelopmental disorder and expand the group of disorders related to the TTT complex.

Keywords: TTI1 gene; autosomal recessive; consanguinity; gene; mendelian disorders; microcephaly; neurodevelopment; pathogenic variants.


Conflict of interest statement

Declaration of interests S.E.A. is a co-founder and CEO of Medigenome, Swiss Institute of Genomic Medicine, and serves in the Scientific Advisory Board of the “Imagine” Institute in Paris. The Department of Medical and Human Genetics at Baylor College of Medicine receives revenue from clinical genetic testing conducted at Baylor Genetics Laboratories. J.R.L. has stock ownership in 23andMe; is a paid consultant for Regeneron Genetics Center; and is a co-inventor on multiple United States and European patents related to molecular diagnostics for inherited neuropathies, eye diseases, genomic disorders, and bacterial genomic fingerprinting, and serves on the Scientific Advisory Board of Baylor Genomics.

Figures

Figure 1
Figure 1
Pedigrees and clinical photographs of the affected individuals (A) Pedigrees of the 11 affected individuals with bi-allelic, likely pathogenic TTI1 variants. (B) Clinical photographs of selected affected individuals. Individuals 1 (F1.IV-2) and 2 (F1.IV-3): smooth philtrum, thin upper lip. Individual 4 (F3.II-2): fine facial features with round face, low-set ears, and widely spaced teeth. Individual 5 (F4.II-3): lateral flare of eyebrows, upturned nose, wide mouth with fully everted lower lip, and large protruding ears with underfolded helices. Individual 6 (F5.III-5): narrow forehead, strabismus, upslanting palpebral fissures, blue sclerae, prominent nose, micrognathia, and short philtrum. Individual 7 (F5.III-6): narrow forehead, upslanting palpebral fissures, epicanthus, blue sclerae, prominent nose, micrognathia, and short philtrum. Individual 10 (F8.II-2): prominent metopic suture, upslanting palpebral fissures, infraorbital creases, and anteverted nares.
Figure 2
Figure 2
Protein levels of TTI1 variants in HEK293T cells (A) Immunoblot images of TTI1-Flag accumulation in HEK293T. Control cells were transfected with empty plasmid vector. (B) Quantification of band intensity of anti-FLAG blot normalized to anti-Actin blots in (A) (n = 4). (C) Quantification of band intensity of anti-TTI1 blot normalized to anti-Actin blots in (A) (n = 4).
Figure 3
Figure 3
TTI1 variants alter mTOR complex 1 (mTORC1) composition (A) Schematic depiction of mTORC1-TTI1-Flag SiMPull. (B) Representative quartz slide images from SiMPull shown in (A) with the TTI1 variants. Control is similar experiments with cells without TTI1-Flag. (C and D) Graphical representation of relative amount of mTOR (C) or of Raptor (D) bound to TTI1-Flag (n = 4 for each). (E) Graphical representation of relative amount of mTORC1 (mTOR-Raptor) bound to TTI1-Flag (n = 4). (F) Schematic depiction of different mTOR oligomeric states and graphical representation showing the distribution of the different mTOR complexes in the presence of the TTI1 variants (n = 4). (G) Schematic depiction of different mTORC1 composition (mTOR, mT-Raptor,R) complexes and graphical representation showing the distribution of the different Raptor-mTOR complexes in the presence of the TTI1 variants (n = 4). Data in (C)–(G) are mean ± SEM experiments, p < 0.05; n.s., p > 0.05, ANOVA with Tukey-Kramer post-hoc test compared with wild-type.
Figure 4
Figure 4
TTI1 variants alter mTORC1 activation by amino acids (A) Representative immunoblots of showing mTORC1 activation (phosphorylation) status during normal amino acids fed (+), starvation (−), and starvation followed by amino acid supplementation (−/+). (B) Quantification of phosphorylated mTOR (phos-mTOR, S2448) normalized to total mTOR (mTOR) of images in (A) (n = 3). (C) Quantification of phosphorylated S6K (phos-S6K, T389) normalized to total S6K (S6K) of images in (A) (n = 3). (D) Quantification of phosphorylated 4EBP1 (phos-4EBP1) normalized to total 4EBP1 (4EBP1) of images in (A) (n = 3). (E) Quantification of phosphorylated PRAS40 (phos-PRAS40) normalized to total PRAS40 (PRAS40) of images in (A) (n = 3). QA (F) Representative immunoblots of showing mTORC1 activation (phosphorylation) status in the absence (− −) or presence (+ −) of MHY1485 or Rapamycin (− +). (G) Quantification of phosphorylated S6K (phos-S6K, T389) normalized to total S6K (S6K) of images in (F) (n = 3). Data in (B)–(E), (G), and (H) are mean ± SEM of experiments performed, ∗∗∗p < 0.001, ∗∗p < 0.01, p < 0.05, n.s., p > 0.05, ANOVA with Tukey-Kramer post-hoc test compared with WT.
Figure 5
Figure 5
TTI1 likely pathogenic variants affect cell cycle progression (A) Representative images of starved cells co-expressing TTI1-flag (wild-type or variant, purple), CDK2 sensor-GFP (green), and H2B-RFP (red). (B) Representative images of re-fed starved cells to stimulate cell cycle progression. (C) Schematic of CDK2 activity and colocalization with H2B at different phases of the cell cycle. (D and E) Graphical representative of the percentage of the different phases of the cell cycle in starved cells (D) and re-fed cells (E) of images in (A) and (B) (n = 4). Data in (D) and (E) are mean ± SEM of experiments performed, p < 0.05, n.s., p > 0.05, ANOVA with Tukey-Kramer post-hoc test compared with WT.
Figure 6
Figure 6
mTORC1 activation altered in cells from affected individuals (A) Representative immunoblots showing mTORC1 activation (phosphorylation) status during normal amino acids fed (+), starvation (−), and starvation followed by amino acid supplementation (−/+). (B and C) Quantification of phosphorylated S6K (phos-S6K, T389) and 4EBP1 (phos-4EBP1) normalized to total proteins of images in (A) (n = 3). (D–G) Graphical representative of basal and amino acids stimulated mTORC1 activation. (H) Representative immunoblots showing mTORC1 activation (phosphorylation) status in the absence (− −) or presence of MHY1485 (+ −) or Rapamycin (− +). (I and J) Quantification of phosphorylated mTOR and S6K normalized to total proteins of images in (F) (n = 3). Data in (B)–(G), (I), and (J) are mean ± SEM of experiments performed, p < 0.05, n.s., p > 0.05, ANOVA with Tukey-Kramer post-hoc test compared with control.

References

    1. Kaizuka T., Hara T., Oshiro N., Kikkawa U., Yonezawa K., Takehana K., Iemura S.I., Natsume T., Mizushima N. Tti1 and Tel2 are critical factors in mammalian target of rapamycin complex assembly. J. Biol. Chem. 2010;285:20109–20116. - PMC - PubMed
    1. Hurov K.E., Cotta-Ramusino C., Elledge S.J. A genetic screen identifies the Triple T complex required for DNA damage signaling and ATM and ATR stability. Genes Dev. 2010;24:1939–1950. - PMC - PubMed
    1. Rao F., Cha J., Xu J., Xu R., Vandiver M.S., Tyagi R., Tokhunts R., Koldobskiy M.A., Fu C., Barrow R., et al. Inositol pyrophosphates mediate the DNA-PK/ATM-p53 cell death pathway by regulating CK2 phosphorylation of Tti1/Tel2. Mol. Cell. 2014;54:119–132. - PMC - PubMed
    1. Goto G.H., Ogi H., Biswas H., Ghosh A., Tanaka S., Sugimoto K. Two separate pathways regulate protein stability of ATM/ATR-related protein kinases Mec1 and Tel1 in budding yeast. PLoS Genet. 2017;13:e1006873. - PMC - PubMed
    1. Sugimoto K. Branching the Tel2 pathway for exact fit on phosphatidylinositol 3-kinase-related kinases. Curr. Genet. 2018;64:965–970. - PMC - PubMed

Publication types

Substances