Review
. 2023 Apr 1;22(2):157-175.
doi: 10.2463/mrms.rev.2022-0100. Epub 2023 Feb 1.

Clinical Significance of Liver MR Imaging

Affiliations
Review

Clinical Significance of Liver MR Imaging

Shintaro Ichikawa et al. Magn Reson Med Sci. .

Abstract

MRI is widely used in clinical practice for detecting liver diseases. Since the introduction of gadoxetic acid, MRI has become the most effective modality for the detection and characterization of focal liver lesions. According to previous meta-analyses, the area under the receiver operating characteristic curve (AUROC) was 0.97-0.99 for the diagnosis of small hepatocellular carcinoma (≥ 2 cm) by gadoxetic-acid-enhanced MRI. Moreover, the AUROC for the diagnosis of colorectal liver metastases was significantly high (0.98). Despite gadoxetic acid's drawbacks, its clinical utility outweighs them, making it the contrast agent of choice in routine liver MRIs. Moreover, clinically, liver MRI has become more prevalent for a quantitative assessment. Liver fibrosis can be evaluated using MR elastography; whereas, hepatic steatosis and iron overload can be evaluated using proton density fat fraction, with high accuracy and reproducibility. This article reviewed the usefulness of liver MRI, which can be a comprehensive imaging modality in clinical practice.

Keywords: elastography; gadoxetic acid; liver; magnetic resonance imaging; proton density fat fraction.


Conflict of interest statement

Conflicts of Interest

The authors declare that they have no conflicts of interest.

Figures

Fig. 1
Fig. 1
Multiple liver metastases from malignant melanoma in an 88-year-old man. (a) Unenhanced CT reveals several low-attenuation lesions in the liver (arrows). (b) Fat-saturated T2-weighted and (c) diffusion-weighted images reveal numerous hyperintense lesions in the liver. MRI has more advantages compared to CT, including better soft tissue contrast.
Fig. 2
Fig. 2
Hepatocellular carcinoma in a 56-year-old man with liver cirrhosis due to hepatitis C virus infection. (a) Precontrast fat-saturated FRFSE image (TR, 2200 ms; TE, 81 ms; flip angle, 90 degrees) reveals no focal liver lesions (dotted circle). (b) Postcontrast fat-saturated FRFSE image using superparamagnetic iron oxide reveals a high signal 12 mm-diameter nodule in segment 1 of the liver (arrow). (c) This nodule shows higher contrast to the surrounding liver parenchyma in the postcontrast fast spoiled gradient-echo image (TR, 190 ms; TE, 10 ms; flip angle, 70 degrees) compared to the FRFSE image (arrow). FRFSE, fast recovery fast spin-echo.
Fig. 3
Fig. 3
Hepatocellular carcinomas in a 77-year-old man with liver cirrhosis due to hepatitis C virus infection. (a) Precontrast and (b) arterial phase gadoxetic-acid-enhanced MRI reveal hypervascular nodules in segment 6 of the liver (arrows). (c) These nodules show no washout in the portal venous phase (dotted circle), whereas (d) they show hypointensity in the hepatobiliary phase measuring 13 mm in diameter (arrowheads). These nodules are diagnosed as hepatocellular carcinomas according to the Japan Society of Hepatology guideline, whereas they scored LR-4 according to the Liver Imaging Reporting and Data System version 2018.
Fig. 4
Fig. 4
Hepatocellular carcinoma in a 62-year-old man with liver cirrhosis due to nonalcoholic steatohepatitis. (a) Arterial and (b) portal venous phase contrast-enhanced CT reveal no focal liver lesions (dotted circles). (c) Arterial and (d) HBP gadoxetic-acid-enhanced MRI performed 3 weeks later reveal a hypervascular nodule that shows hypointensity in HBP measuring 7 mm in diameter in segment 5 of the liver (arrows). Gadoxetic-acid-enhanced MRI has a better diagnostic ability than contrast-enhanced CT. HBP, hepatobiliary phase.
Fig. 5
Fig. 5
Colorectal liver metastases in a 63-year-old man without chronic liver diseases. (a) Contrast-enhanced CT reveals a hypoattenuating 11 mm-diameter nodule in segment 6 of the liver (arrow). This nodule shows hyperintensity in fat-saturated T2-weighted imaging and (c) DWI, whereas it shows hypointensity in (d) HBP gadoxetic-acid-enhanced MRI performed the same day (arrows). Another small 5 mm-diameter nodule is detected via gadoxetic-acid-enhanced MRI in segment 6 of the liver (arrowheads). This small nodule cannot be detected by CT (dotted circle). Gadoxetic-acid-enhanced MRI has better diagnostic performance than CT in detecting colorectal liver metastases. The combination of DWI and HBP gadoxetic-acid-enhanced MRI increases diagnostic accuracy. DWI, diffusion-weighted imaging; HBP, hepatobiliary phase.
Fig. 6
Fig. 6
Liver metastasis from esophagogastric junctional cancer in a 68-year-old man without chronic liver diseases. (a) It is difficult to detect metastases in the HBP gadoxetic-acid-enhanced MRI (dotted arrows). (b) In contrast, DWI clearly shows hyperintense nodules (arrows). Small lesions near blood vessels are difficult to detect because intrahepatic vessels are also depicted with low signal intensity in HBP. DWI, diffusion-weighted imaging; HBP, hepatobiliary phase.
Fig. 7
Fig. 7
Liver metastasis from pancreatic ductal adenocarcinoma in an 83-year-old woman without chronic liver diseases. A small 5mm-diameter nodule is observed in segment 6 of the liver. This nodule cannot be detected in the AP (dotted circle in a) and shows slight hypoattenuation in the PVP (dotted arrow in b). It is difficult to detect via CT. (c) AP gadoxetic-acid-enhanced MRI reveals a wedge shaped hyper-enhanced area that can be misdiagnosed as an arterioportal shunt (arrowhead). (d) HBP imaging clearly shows a hypointense nodule (arrow). Gadoxetic-acid-enhanced MRI has better sensitivity for detecting liver metastases from pancreatic ductal adenocarcinoma. AP, arterial phase; HBP, hepatobiliary phase; PVP, portal venous phase.
Fig. 8
Fig. 8
Recurrent hepatocellular carcinoma after radiofrequency ablation in an 88-year-old man with non-B non-C liver cirrhosis. (a) Precontrast image shows post-ablation lesion in segment 8 of the liver. (b) Arterial phase and (c) portal venous phase contrast-enhanced MRI reveal a 10 mm-diameter nodule that shows arterial phase hyperenhancement and washout at the right periphery in the post-ablation lesion (arrows). This lesion meets the viable criteria of the Liver Imaging Reporting and Data System. (d) This nodule clearly shows hypointensity in the HBP. HBP, hepatobiliary phase.
Fig. 9
Fig. 9
Recurrent hepatocellular carcinoma after transcatheter arterial chemoembolization in a 62-year-old man with liver cirrhosis due to nonalcoholic steatohepatitis. (a) Arterial phase contrast-enhanced CT reveals a focal defect of lipiodol accumulation (arrowhead) 15 months after transcatheter arterial chemoembolization. Nodular enhancement is present (dotted arrow); however, it is difficult to detect it on CT because of the high concentration of lipiodol accumulated in the lesion. (b) This nodular enhancement can be clearly detected in arterial phase contrast-enhanced MRI (arrow) because lipiodol does not show high signal intensity on MRI.
Fig. 10
Fig. 10
SBRT for recurrent hepatocellular carcinoma after radiofrequency ablation in an 88-year-old woman with liver cirrhosis due to hepatitis C virus infection. (a) AP and (b) PVP contrast-enhanced MRI reveal a 20 mm-diameter nodule that shows AP hyperenhancement and washout in the periphery of the post-ablation lesion (arrows). (c) This nodule clearly shows hypointensity in the hepatobiliary phase. (d) AP and (e) PVP contrast-enhanced MRI 5 months after SBRT (48 Gy in four fractions) reveal that the nodule decreased in size and disappeared lesional enhancement (arrowheads). This lesion meets the nonviable criteria of the Liver Imaging Reporting and Data System. The liver parenchyma surrounding the target lesion shows AP hyperenhancement and persistent enhancement on the PVP (dotted arrows). (f) This area is depicted as a distinct low signal intensity area on the hepatobiliary phase (dotted arrows). AP, arterial phase; PVP, portal venous phase; SBRT, stereotactic body radiation therapy.
Fig. 11
Fig. 11
Hepatocellular carcinomas in a 59-year-old man with liver cirrhosis due to hepatitis C virus infection. (a) Arterial phase and (b) portal venous phase contrast-enhanced (CT reveals a 15 mm-diameter hypervascular nodule that shows a washout appearance in segment 3 of the liver (arrows). (c) Arterial phase gadoxetic-acid-enhanced MRI also reveals the hypervascular nodule; however, (d) this nodule shows iso intensity compared to the surrounding liver parenchyma in the HBP (dotted circle). In cases with good uptake of gadoxetic acid in the HBP, the liver parenchyma shows a distinctly higher signal than the spleen and intrahepatic vessels (see Fig. 3d), whereas in cases with severely impaired liver function, the liver parenchyma shows a signal comparable to that of the spleen and intrahepatic vessels because of decreased gadoxetic acid uptake. HBP, hepatobiliary phase.
Fig. 12
Fig. 12
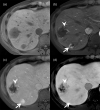
Hepatic hemangiomas in a 38-year-old man without chronic liver diseases. (a) Precontrast and (b) arterial phase gadoxetic-acid-enhanced MRI reveal peripherally enhancing nodules in segments 8 (45 mm in diameter) and 7 (20 mm in diameter) of the liver (arrow and arrowhead). (c) These nodules show centripetal enhancement in the portal venous phase. (d) These findings are compatible with a cavernous hemangioma; however, these nodules show hypointensity compared to the surrounding liver parenchyma (pseudo-washout) in the transitional phase.
Fig. 13
Fig. 13
Examples of PDFF of a 52-year-old woman with chronic hepatitis B without hepatic steatosis (upper row), a 51-year-old woman with NALFD with moderate hepatic steatosis (middle row), and a 56-year-old woman with NAFLD with severe hepatic steatosis (lower row). No signal loss in the liver parenchyma is observed between (a) in-phase and (b) in opposed-phase images. (c) PDFF shows hypointensity throughout the liver. Fat fraction is calculated as 2.2% in this patient. Mild signal loss is observed on (e) opposed-phase image compared to (d) in-phase image. (f) PDFF shows higher signal intensity compared to (c) throughout the liver. Fat fraction is calculated as 11.1% in this patient. Evident signal loss is observed on (h) opposed-phase image compared to (g) in-phase image. PDFF shows higher signal intensity compared to (c) and (f) throughout the liver. Fat fraction is calculated as 46.3% in this patient. NAFLD, nonalcoholic fatty liver disease; PDFF, proton density fat fraction.
Fig. 14
Fig. 14
Examples of an R2* map of a 73-year-old man with liver cirrhosis due to hepatitis C virus infection without hepatic iron overload (upper row) and an 82-year-old woman with hemochromatosis with severe hepatic iron overload (lower row). No signal loss in the liver parenchyma is observed between (a) in-phase and (b) in opposed-phase images. (c) T2*-weighted image shows no signal decrease in the liver parenchyma. (d) R2* map shows hypointensity throughout the liver. R2* value is calculated as 53.3s in this patient. (e) In-phase image shows a diffuse signal loss in the liver parenchyma compared to the (f) opposed-phase image due to severe iron deposition. (g) Liver parenchyma shows lower signal intensity in the T2*-weighted image compared to (c). (h) R2* map shows evident hyperintensity throughout the liver. R2* value is calculated as 928.0s in this patient.
Fig. 15
Fig. 15
Examples of MR elastography of a 54-year-old woman with nonalcoholic fatty liver disease (upper row) and a 52-year-old man with alcoholic liver cirrhosis (lower row). (a) Fat-saturated T1WI shows no morphological change. (b) Wave image shows propagating shear wave in the liver. (c) Elastograms are automatically generated by processing the acquired wave images according to a 2D or 3D inversion algorithm. The mean liver stiffness value is calculated as 2.2 kPa in this patient. (d) Cirrhotic change is observed in fat-saturated T1WI. (e) Wave image shows a larger amplitude of the waves propagating through the liver than that in Fig. 8b. (f) Elastogram shows that the mean liver stiffness value of the cirrhotic liver is significantly higher than that of the non-cirrhotic liver. The mean liver stiffness value is calculated as 11.6 kPa in this patient. T1WI, T1-weighted image.
Fig. 16
Fig. 16
Examples of MRE of a 65-year-old man with hepatic iron overload. (a) In-phase image shows a higher number of spots with signal loss in the liver parenchyma compared to (b) opposed-phase due to iron deposition. (c) There is no measurable area of liver stiffness value on gradient-echo MRE. Cross-hatched regions on the elastogram are areas of low-confidence data excluded by the processing algorithm. (d) Spin-echo echo-planar imaging MRE produces an elastogram with good image quality. MRE, MR elastography.

References

    1. Trefts E, Gannon M, Wasserman DH. The liver. Curr Biol 2017; 27:R1147–R1151. - PMC - PubMed
    1. Donato H, França M, Candelária I, Caseiro-Alves F. Liver MRI: from basic protocol to advanced techniques. Eur J Radiol 2017; 93:30–39. - PubMed
    1. Takayama Y, Nishie A, Okamoto D, et al. Differentiating liver hemangioma from metastatic tumor using T2-enhanced spin-echo imaging with a time-reversed gradient-echo sequence in the hepatobiliary phase of gadoxetic acid-enhanced MR imaging. Magn Reson Med Sci 2022; 21:445–457. - PMC - PubMed
    1. Murakami T, Sofue K, Hori M. Diagnosis of hepatocellular carcinoma using Gd-EOB-DTPA MR imaging. Magn Reson Med Sci 2022; 21:168–181. - PMC - PubMed
    1. Ichikawa S, Morisaka H, Omiya Y, Onishi H. Distinction between hepatocellular carcinoma and hypervascular liver metastases in non-cirrhotic patients using gadoxetate disodium-enhanced magnetic resonance imaging. Can Assoc Radiol J 2022; 73:639–646. - PubMed