. 2023 Feb:44:213-225.
doi: 10.1016/j.jare.2022.04.012. Epub 2022 Apr 29.

Lung specific homing of diphenyleneiodonium chloride improves pulmonary fibrosis by inhibiting macrophage M2 metabolic program

Affiliations

Lung specific homing of diphenyleneiodonium chloride improves pulmonary fibrosis by inhibiting macrophage M2 metabolic program

Huirui Wang et al. J Adv Res. 2023 Feb.

Erratum in

Abstract

Introduction: Pulmonary fibrosis (PF) is a fatal disease with a variable and unpredictable course. Effective clinical treatment for PF remains a challenge due to low drug accumulation in lungs and imbalanced polarization of pro/anti-fibrotic macrophages.

Objectives: To identify the alteration of immunometabolism in the pulmonary macrophages and investigate the feasibility of specific inhibition of M2 activation of macrophages as an effective anti-PF strategy in vivo.

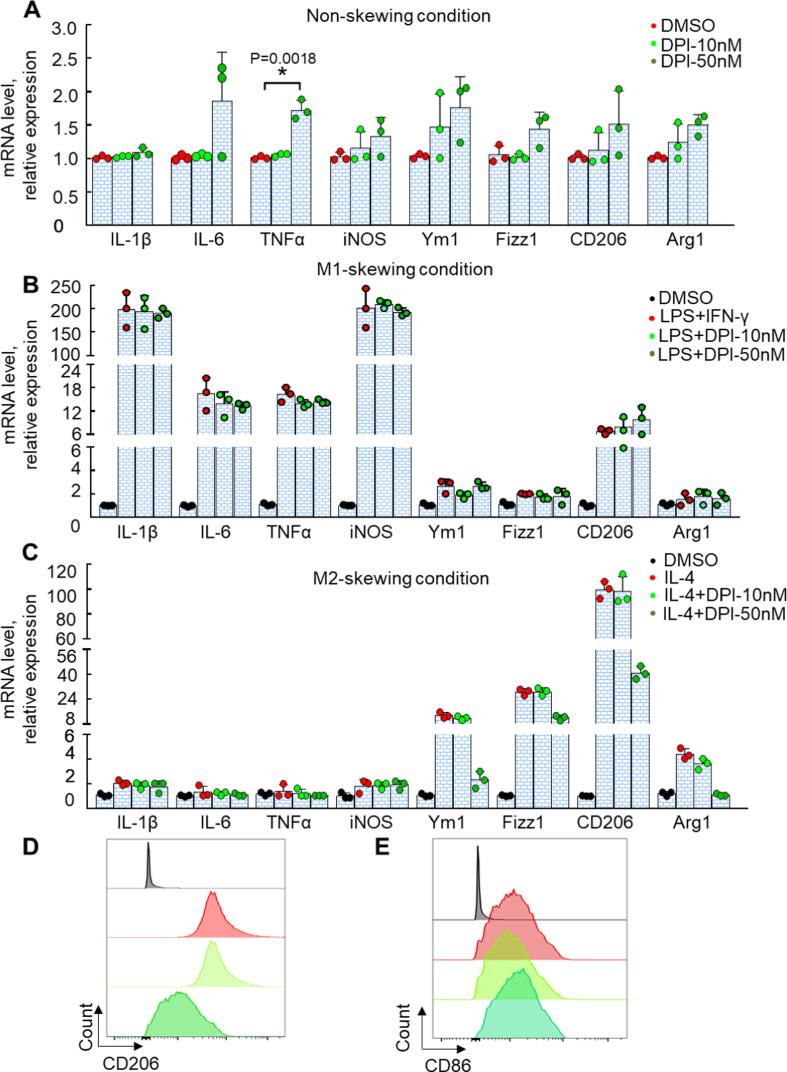
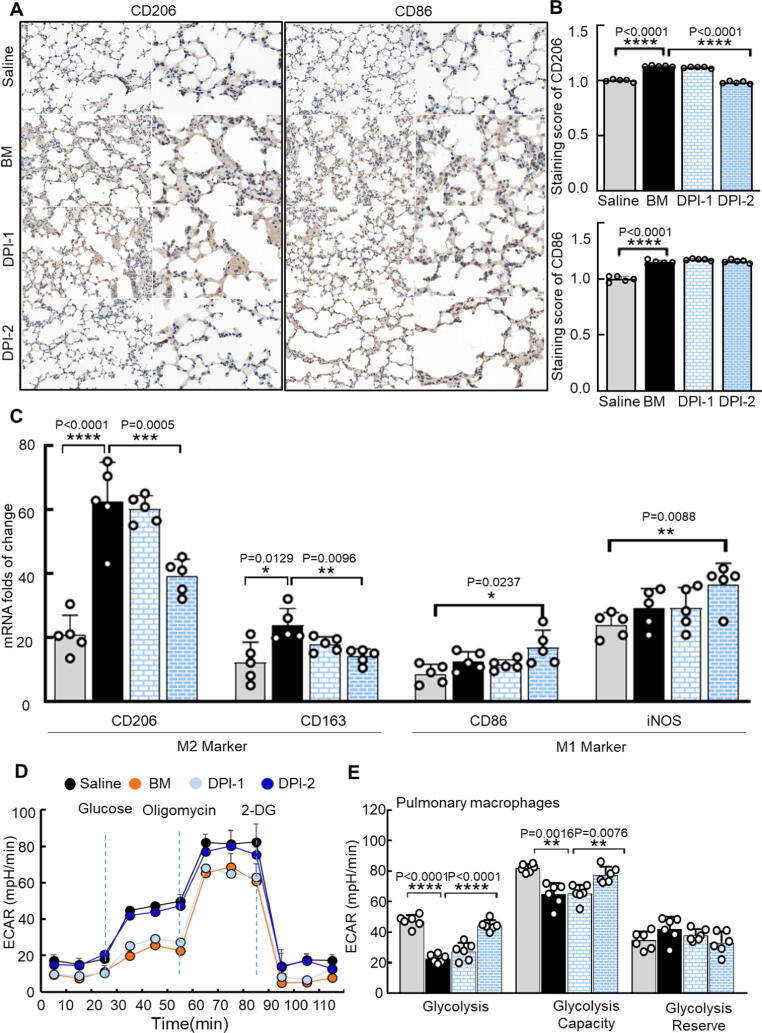
Methods: The high-content screening system was used to select lung-specific homing compounds that can modulate macrophage polarization. Imaging mass spectrometry (IMS) conjugated with chemical proteomics approach was conducted to explore the cells and proteins targeted by diphenyleneiodonium chloride (DPI). A bleomycin-induced fibrotic mouse model was established to examine the in vivo effect of DPI.

Results: Pulmonary macrophages of PF at late stage exhibited predominantly the M2 phenotype with decreased glycolysis metabolism. DPI was demonstrated to inhibit profibrotic activation of macrophages in the preliminary screening. Notably, IMS conjugated with chemical proteomics approach revealed DPI specifically targeted pulmonary macrophages, leading to the efficient protection from bleomycin-induced pulmonary fibrosis in mice. Mechanistically, DPI upregulated glycolysis and suppressed M2 programming in fibrosis mice, thus resulting in pro-fibrotic cytokine inhibition, hydroxyproline biosynthesis, and collagen deposition, with a concomitant increase in alveolar airspaces.

Conclusions: DPI mediated glycolysis in lung and accordingly suppressed M2 programming, resulting in improved lung fibrosis.

Keywords: Chemical proteomics; Diphenyleneiodonium chloride; Imaging mass spectrometry; Lung fibrosis.


Conflict of interest statement

Declaration of Competing Interest The authors declare that they have no known competing financial interests or personal relationships that could have appeared to influence the work reported in this paper.

Figures

None
Graphical abstract
Fig. 1
Fig. 1
PF is characterized by M2 dominant macrophages. (A) The characteristics of patients from which the lung specimens were obtained. (B) HEPF cells were seeded at the density of 5000 cells/well, after being serum-starved for 24 h. The cells were incubated with BALF for 48 h, and qPCR was performed to analyze pro-fibrotic proteins such as Collagen and α-SMA. (C) Flow cytometry analysis of M1 (CD86) and M2 (CD206) surface marker. (D) 2-DG uptake in macrophages cells (2000 cells/well) from BALF. (E) Extracellular acidification rate (ECAR) was measured with a glycolysis stress test. The representative kinetics were used to assess glycolysis-dependent ECAR (mpH/min) in pulmonary macrophages isolated from the PF patients by sequentially adding 10 mM glucose (Gluc), 1.25 µM oligomycin (Olig), and 50 mM 2-deoxyglucose (2-DG). (F) Bar graphs showing the basal ECAR levels, glycolytic capacity (GC), and glycolytic reserve (GR). (G) For the human samples, RNA was purified, and the mRNA level of the indicated glycolytic enzyme was measured by RT-PCR. Abbreviations: GAPDH, glyceraldehyde 3-phosphate dehydrogenase; GLUT-1, glucose transporter 1; GPI, phosphoglucose isomerase; PDK1, pyruvate dehydrogenase kinase 1; PFK, phosphofructokinase; LDH, lactate dehydrogenase; HK1, Hexokinase 1; PGK, 3-phosphoglycerate kinase; ENO, Enolase; PKM2, pyruvate kinase M2. (H) BALF was collected from BM-induced fibrotic mice and the glucose consumption rate was determined. (I) ECAR was measured with a glycolysis stress test. The representative kinetics were used to assess glycolysis-dependent ECAR (mpH/min) in pulmonary macrophages isolated from BM-induced mice by continuously adding Gluc and Olig. (J) Bar graphs showing the basal ECAR levels, GC and GR. (K) Glycolytic enzymes were examined by qPCR in BM-induced fibrotic mice.
Fig. 1
Fig. 1
PF is characterized by M2 dominant macrophages. (A) The characteristics of patients from which the lung specimens were obtained. (B) HEPF cells were seeded at the density of 5000 cells/well, after being serum-starved for 24 h. The cells were incubated with BALF for 48 h, and qPCR was performed to analyze pro-fibrotic proteins such as Collagen and α-SMA. (C) Flow cytometry analysis of M1 (CD86) and M2 (CD206) surface marker. (D) 2-DG uptake in macrophages cells (2000 cells/well) from BALF. (E) Extracellular acidification rate (ECAR) was measured with a glycolysis stress test. The representative kinetics were used to assess glycolysis-dependent ECAR (mpH/min) in pulmonary macrophages isolated from the PF patients by sequentially adding 10 mM glucose (Gluc), 1.25 µM oligomycin (Olig), and 50 mM 2-deoxyglucose (2-DG). (F) Bar graphs showing the basal ECAR levels, glycolytic capacity (GC), and glycolytic reserve (GR). (G) For the human samples, RNA was purified, and the mRNA level of the indicated glycolytic enzyme was measured by RT-PCR. Abbreviations: GAPDH, glyceraldehyde 3-phosphate dehydrogenase; GLUT-1, glucose transporter 1; GPI, phosphoglucose isomerase; PDK1, pyruvate dehydrogenase kinase 1; PFK, phosphofructokinase; LDH, lactate dehydrogenase; HK1, Hexokinase 1; PGK, 3-phosphoglycerate kinase; ENO, Enolase; PKM2, pyruvate kinase M2. (H) BALF was collected from BM-induced fibrotic mice and the glucose consumption rate was determined. (I) ECAR was measured with a glycolysis stress test. The representative kinetics were used to assess glycolysis-dependent ECAR (mpH/min) in pulmonary macrophages isolated from BM-induced mice by continuously adding Gluc and Olig. (J) Bar graphs showing the basal ECAR levels, GC and GR. (K) Glycolytic enzymes were examined by qPCR in BM-induced fibrotic mice.
Fig. 2
Fig. 2
DPI inhibits macrophage M2-like polarization. (A) The mRNA levels of Arg1, CD206, Fizz1, iNOS, IL-1β, IL-6, TNF-α, and Ym1 in non-activated BMDMs. (B-C) BMDMs were skewed to acquire an M1 or M2-like phenotype (see Materials and Methods) and then exposed to 0, 10, and 50 nM of DPI for 24 h. The mRNA levels of the indicated surface markers were measured by qPCR. (D-E) Flow cytometry analysis of M1 (CD86) and M2 (CD206) surface markers after DPI treatment.
Fig. 3
Fig. 3
Tissue homing of DPI after intravenous (IV) injection. (A) Optical and mass images of the [M + H] + ions at m/z 278.9665, corresponding to the DPI in mice. (B-C) Clodronate liposomes were given 72 h before DPI (1 mg/kg) injection, and the mice tissue sections were isolated for subsequent analysis. Blank liposomes were administered into the vehicle control at an equal volume. (D) At 6 h following DPI treatment, the BALF was sampled for the evaluation of macrophage depletion. (E) Concentration-time profile of DPI in lung tissues. The mice were intravenously injected with DPI (1 mg/kg) for the indicated time periods, and then analyzed by IMS.
Fig. 4
Fig. 4
Chemical proteomics study of DPI. (A) Schematic illustration of chemical tracking of DPI in vivo. (B-D) In vivo tracking of Cy3-DPI. The mice were given clodronate liposomes for 72 h, and then injected with or without Cy3-DPI (1 mg/kg) for 6 h, analyzed the fluorescence signals by using an in-vivo imaging instrument (PerkinElmer) in mice, tissue, or cell levels. (E) Quantitative analysis of the fluorescence signals in the above experimental groups. (F) Pre-target imaging of Cy3-DPI in living cells. The isolated pulmonary macrophages were treated with 1 µM of Cy3-DPI or Cy3 for 24 h. Before imaging on a confocal microscope, all cells were incubated with DAPI (scale bar, 200 µm).
Fig. 5
Fig. 5
DPI suppresses BM-induced PF in mice. (A) Schematic diagram of the experimental design. A single dose of BM (5.0 mg/kg) was given via intratracheal instillation on day 0. DPI-1(0.5 mg/kg) or DPI-2 (1 mg/kg) was administered every three days starting on days 10, 13, 16, and 19, and then euthanized on day 28. (B) Bodyweight changes in mice over time. (C) Hematoxylin-eosin and Masson’s trichrome staining of the lung tissues (scale bar, 100 µm). (D) Quantification of the inflammatory score (n = 5). (E) Quantification of total hydroxyproline content was used as a measure to express the collagen content of each lung sample (n = 6). (F) Ashcroft scoring of fibrosis (n = 5). (G) Representative micro-CT images of the lung tissues of DPI treatment and normal mice after BM induction. Horizontal (upper row), horizontal axis (middle row) and 3D micro-CT (right image) images can be obtained four weeks after BM induction. (H-I) Quantification of normal lung volume was performed by using living image software, and the calculation process was recorded as a video shown in 5I. (J) Changes in the mRNA expression of the pro-fibrosis markers (TGF-β1, Fibronectin, collagen 1α1, and α-SMA) were evaluated by qPCR. (K) BALF was sampled on day 28, followed by centrifugation to separate the cell pellet. Western blot analysis was conducted to detect collagen 1α1, Fibronectin, α-SMA, and TGF-β1 protein levels. GAPDH was used as a loading control.
Fig. 5
Fig. 5
DPI suppresses BM-induced PF in mice. (A) Schematic diagram of the experimental design. A single dose of BM (5.0 mg/kg) was given via intratracheal instillation on day 0. DPI-1(0.5 mg/kg) or DPI-2 (1 mg/kg) was administered every three days starting on days 10, 13, 16, and 19, and then euthanized on day 28. (B) Bodyweight changes in mice over time. (C) Hematoxylin-eosin and Masson’s trichrome staining of the lung tissues (scale bar, 100 µm). (D) Quantification of the inflammatory score (n = 5). (E) Quantification of total hydroxyproline content was used as a measure to express the collagen content of each lung sample (n = 6). (F) Ashcroft scoring of fibrosis (n = 5). (G) Representative micro-CT images of the lung tissues of DPI treatment and normal mice after BM induction. Horizontal (upper row), horizontal axis (middle row) and 3D micro-CT (right image) images can be obtained four weeks after BM induction. (H-I) Quantification of normal lung volume was performed by using living image software, and the calculation process was recorded as a video shown in 5I. (J) Changes in the mRNA expression of the pro-fibrosis markers (TGF-β1, Fibronectin, collagen 1α1, and α-SMA) were evaluated by qPCR. (K) BALF was sampled on day 28, followed by centrifugation to separate the cell pellet. Western blot analysis was conducted to detect collagen 1α1, Fibronectin, α-SMA, and TGF-β1 protein levels. GAPDH was used as a loading control.
Fig. 6
Fig. 6
DPI inhibits the expression of M2-like macrophages in vivo. (A) Immunohistochemical analysis of the surface markers CD86 (M1 macrophages typical surface marker) and CD206 (M2 macrophages typical surface marker) in the lung tissues from different experimental groups on day 28. (Scale bar: 100 µm) (B)Quantification of CD206 + and CD86 + IHC stained tissues of the mice (n = 5). (C) Changes in the mRNA levels of the macrophage markers in lung tissues after exposure to DPI or saline treatment. (D-E) ECAR was measured with a glycolysis stress test. The representative kinetics were used to assess glycolysis-dependent ECAR (mpH/min) pulmonary macrophages isolated from the various experimental mice by sequentially adding Gluc, Olig and 2-DG. (E) Bar graphs showing the basal ECAR levels, GC and GR. (F-G) The representative kinetics were used to assess glycolysis-dependent ECAR (mpH/min) in endothelial cells isolated from the above mice. (G) Bar graphs showing the basal ECAR levels, GC and GR.
Fig. 6
Fig. 6
DPI inhibits the expression of M2-like macrophages in vivo. (A) Immunohistochemical analysis of the surface markers CD86 (M1 macrophages typical surface marker) and CD206 (M2 macrophages typical surface marker) in the lung tissues from different experimental groups on day 28. (Scale bar: 100 µm) (B)Quantification of CD206 + and CD86 + IHC stained tissues of the mice (n = 5). (C) Changes in the mRNA levels of the macrophage markers in lung tissues after exposure to DPI or saline treatment. (D-E) ECAR was measured with a glycolysis stress test. The representative kinetics were used to assess glycolysis-dependent ECAR (mpH/min) pulmonary macrophages isolated from the various experimental mice by sequentially adding Gluc, Olig and 2-DG. (E) Bar graphs showing the basal ECAR levels, GC and GR. (F-G) The representative kinetics were used to assess glycolysis-dependent ECAR (mpH/min) in endothelial cells isolated from the above mice. (G) Bar graphs showing the basal ECAR levels, GC and GR.

References

    1. Ferkol T., Schraufnagel D. The global burden of respiratory disease. Ann Am Thorac Soc. 2014;11(3):404–406. - PubMed
    1. Patra J.K., Das G., Fraceto L.F., Campos E.V.R., Rodriguez-Torres M.D.P., Acosta-Torres L.S., et al. Nano based drug delivery systems: recent developments and future prospects. J Nanobiotechnol. 2018;16(1) doi: 10.1186/s12951-018-0392-8. - DOI - PMC - PubMed
    1. Tiwari G., Tiwari R., Sriwastawa B., Bhati L., Pandey S., Pandey P., et al. Drug delivery systems: An updated review. Int J Pharm Investig. 2012;2(1):2. doi: 10.4103/2230-973X.96920. - DOI - PMC - PubMed
    1. Wilczewska A.Z., Niemirowicz K., Markiewicz K.H., Car H. Nanoparticles as drug delivery systems. Pharmacol Rep. 2012;64(5):1020–1037. - PubMed
    1. Newman S.P. Drug delivery to the lungs: challenges and opportunities. Ther Deliv. 2017;8(8):647–661. - PubMed

Publication types