. 2023 Apr;10(10):e2204951.
doi: 10.1002/advs.202204951. Epub 2023 Feb 1.

Single-Cell Landscape Highlights Heterogenous Microenvironment, Novel Immune Reaction Patterns, Potential Biomarkers and Unique Therapeutic Strategies of Cervical Squamous Carcinoma, Human Papillomavirus-Associated (HPVA) and Non-HPVA Adenocarcinoma

Affiliations

Single-Cell Landscape Highlights Heterogenous Microenvironment, Novel Immune Reaction Patterns, Potential Biomarkers and Unique Therapeutic Strategies of Cervical Squamous Carcinoma, Human Papillomavirus-Associated (HPVA) and Non-HPVA Adenocarcinoma

Junjun Qiu et al. Adv Sci (Weinh). 2023 Apr.

Abstract

Cervical adenocarcinomas (ADCs), including human papillomavirus (HPV)-associated (HPVA) and non-HPVA (NHPVA), though exhibiting a more malignant phenotype and poorer prognosis, are treated identically to squamous cell carcinoma (SCC). This clinical dilemma requires a deeper investigation into their differences. Herein a transcriptomic atlas of SCC, HPVA, and NHPVA-ADC using single-cell RNA (scRNA) and T-cell receptor sequencing (TCR-seq) is presented. Regarding structural cells, the malignancy origin of epithelial cells, angiogenic tip cells and two subtypes of fibroblasts is revealed. The promalignant properties of the structural cells using organoids are further confirmed. Regarding immune cells, myeloid cells with multiple functions other than antigen presentation and exhausted T lymphocytes contribute to immunosuppression. From the perspective of HPV infection, not only is HPV-dependent and independent cervical cancer oncogenesis proposed but also three immune reaction patterns mediated by T cells (coordinated/inactive/imbalanced) are identified. Strikingly, diagnostic biomarkers to distinguish ADC from SCC are discovered and prognostic biomarkers with marker genes for malignant epithelial cells, tip cells, and SPP1/C1QC macrophages are generated. Importantly, the efficacy of anti-CD96 and anti-TIGIT, not inferior to anti-PD1, in animal experiments is confirmed and targeted therapies specifically for HPV-positive SCC, HPVA and NHPVA-ADC, providing essential clues for further clinical trials, are proposed.

Keywords: HPV infection; TCR-seq; cervical cancer; precise treatment; scRNA-seq; transcriptional heterogeneity; tumor microenvironment.


Conflict of interest statement

The authors declare no conflict of interest.

Figures
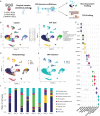
Figure 1
Figure 1
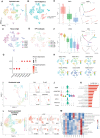
Single‐cell transcriptome atlas of SCC and ADC. A) Schematic diagram of conducting scRNA‐seq and TCR‐seq of eight CC samples including three HPV‐positive SCC samples, three HPVA ADC samples, and two NHPVA ADC samples through the 10× Genomics Platform. B) UMAP projection of 29 568 cells which were clustered into 22 clusters (left) and further categorized into nine major cell types (right). Each single dot corresponds to one single cell colored according to cell cluster (left) or cell type (right). C) Violin plots showing the expression of well‐recognized marker genes in the major cell types. D) UMAP projection of all the cells presenting in different histologic subtypes. Each single dot corresponded to one single cell colored according to histologic subtypes including SCC, HPVA, and NHPVA ADC. Epithelial cells are aggregated merely within a small part between SCC and ADC (cluster 16), whereas other cell types showed adequate integration. E) UMAP projection of all the cells presenting with HPV infection status. Each single dot corresponds to one single cell colored according to HPV infection status. HPV only infects the epithelial cells in the CC TME, thus mediating the oncogenesis. F) Histogram indicating the ratios of each major cell type in eight CC samples, respectively, indicating remarkable inter‐tumoral heterogeneity. SCC, squamous cell carcinoma; ADC, cervical adenocarcinoma; scRNA, single‐cell RNA; TCR‐seq, T‐cell receptor sequencing; CC, cervical cancer; HPV, human papillomavirus; NHPVA, non‐human papillomavirus‐associated; TME, tumor microenvironment.
Figure 2
Figure 2
Epithelial cells turning malignant, tip cells mediating angiogenesis and fibroblasts acting as accomplices in CC TME. A) tSNE projection of the 16 epithelial subclusters generated from unsupervised reclustering. See also Figure S1A, Supporting Information. B) tSNE projection of malignant (subclusters 0, 1, 2, 3, 5, 7, 8, 9, 10, 11, 12, 13, and 15) and nonmalignant (subclusters 4, 6, and 14) epithelial cells determined by inferCNV analysis. See also Figure S1B,C, Supporting Information. C) tSNE projection of five major types of epithelial cells indicating tissue origin. See also Figure S1F, Supporting Information. D) tSNE projection of epithelial cells with HPV infection statuses. See also Figure S1G, Supporting Information. E) Predicted differentiation order of SSECs by CytoTRACE analysis with higher CytoTRACE score representing less differentiation extent and greater developmental diversity (left) and trajectory of differentiation of SSECs predicted by monocle (right) with the expression of KRT14 and KRT6A (markers for basal epithelial cells). F) Predicted differentiation order of MGECs by CytoTRACE analysis (left) and trajectory of differentiation of GECs predicted by monocle (right) with the expression of ALDH1A1 and ALDH3A1 (markers for stem cells). G) Dot plot indicating the average expression levels and cell expressing proportion of differentially expressed genes (DEGs) between SSECs and GECs. The colors represent the average expression levels, and dot sizes represent the percentage expression of selected genes. H) tSNE projection of specific transcription factors (TFs) regulating the five major types of CC epithelial cells (TP63 and MYC mainly regulating SSECs; DDIT3 mainly regulating UGECs; PPARG mainly regulating MGECs; EGR4 mainly regulating GGECs; and SOX17 mainly regulating NMECs). Color key from blue to red indicates AUCell value from low to high. I) UMAP projection of the seven subclusters generated from endothelial cell reclustering (left) and the expression levels of the specific marker gene for the four major types of endothelial cells (right): ACKR1 for vein cells (subclusters 0, 1, 2, and 5); CXCR4 for tip cells (subcluster 3); FBLN5 for artery cells (subcluster 4); and PDPN for lymphatic cells (subcluster 6). Color key from gray to red indicates relative expression levels from low to high. J) Violin plots indicating the expression levels of the marker genes for tip cells (ESM1, CLO4A1, ADAMTSL2, APLN, and ANGPT2). K) Bar chart showing the enrichment of angiogenesis‐related pathways based on the GO pathways in tip cells presented with statistical significance [−Log10(P‐value)]. L) UMAP projection of the 11 subclusters generated from CAFs reclustering (left) and the expression levels of the specific marker genes for the two major types of CAFs (right): CFD, CKB, and DPT for iCAFs (subclusters 0, 2, 3, 4, 5, 6, 7, and 8); INHBA, SULF1, COL8A1 for myCAFs (subclusters 1, 9, and 10). Color key from gray to red indicates relative expression levels from low to high. M) Heatmap demonstrating the KEGG pathway QuSAGE enrichment scores for each CAF subcluster. A score of 0 (white color) represents non‐significant enrichment after FDR correction. CC, cervical cancer; TME, tumor microenvironment; SSECs, stratified squamous epithelial cells; CytoTRACE, Cellular Trajectory Reconstruction Analysis using gene Counts and Expression; MGECs, mucinous glandular epithelial cells; GECs, glandular epithelial cells; DEGs, differentially expressed genes; TFs, transcription factors; GO, gene ontology; CAFs, cancer‐associated fibroblasts; iCAFs, inflammatory cancer‐associated fibroblasts; myCAFs, myoblastic cancer‐associated fibroblasts; KEGG, Kyoto Encyclopedia of Genes and Genomes; FDR, false discovery rate.
Figure 3
Figure 3
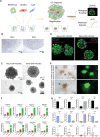
Validation of both the features and functions of structural cells in CC: integrating scRNA‐seq with 3D organoid culture. A) Scheme of establishing 3D organoids with SiHa/HeLa cell lines, CAFs, and endothelial cells to validate the features and functions of structural cells in CC identified by scRNA‐seq. B) 3D cultivation of SiHa or HeLa cells alone could not form spheroids (scale bars, 100 µm). C) ADC organoids consisting of HeLa cells, CAFs and HUVECs (scale bars, 200 [upper] and 50 µm [lower]) and SCC organoids consisting of SiHa cells, CAFs and HUVECs (scale bars, 200 [upper] and 100 µm [lower]) in bright fields. D) SCC and ADC organoids consisting of GFP‐SiHa/HeLa cells, mCherry‐HUVECs, and CAFs stained with DAPI observed by confocal microscopy (200× magnification). E) SCC and ADC organoids protruding into the Matrix gel exhibiting tumor invasiveness in bright field (left) and under fluorescence (right). Scale bars, 100 µm. F) qRT–PCR results indicating that CDC42, RHOA, ROCK1, and MMP7 were more intensely expressed in invasive 3D organoids (invasive‐SiHa/invasive HeLa) than in static organoids (3D‐SiHa/3D‐HeLa) or SiHa/HeLa cells cultured in traditional 2D conditions (2D‐SiHa/2D‐HeLa). Error bar: mean value ± SD (n = 3 independent experiments). p‐values were determined by one‐way ANOVA with the Tukey multiple comparison test. ****p < 0.0001. G) qRT–PCR results demonstrating the relative expression levels of the DEGs and TFs for SSECs and GECs identified by scRNA‐seq, including KRT14, S100A8, CLDN3 and TP63, in CC cell lines (2D‐SiHa/2D‐HeLa), 3D organoids (3D‐SiHa/3D‐HeLa) and tissue samples (10 SCC samples and 10 ADC samples). Error bar: mean value ± SD (n = 3 independent experiments). p‐values were determined by two‐sided Student t‐test or Mann–Whitney test. *p < 0.05; **p < 0.01; ***p < 0.001; ****p < 0.0001. CC, cervical cancer; scRNA‐seq, single‐cell RNA sequencing; CAFs, cancer‐associated fibroblasts; ADC, cervical adenocarcinoma; SCC, squamous cell carcinoma; DAPI, 4′,6‐diamidino‐2‐phenylindole; qRT‐PCR, real‐time quantitative reverse transcription polymerase chain reaction; SD, standard deviation; ANOVA, analysis of variance; DEGs, differentially expressed genes; SSECs, stratified squamous epithelial cells; GECs, glandular epithelial cells.
Figure 4
Figure 4
Myeloid cells differentiate into monocytes, macrophages, and dendritic cells with distinguished roles. A) UMAP projection of the eight subclusters of myeloid cells generated from unsupervised clustering, which could be categorized into three main groups (left) based on marker gene expression (right): CD55 and FCN1 for monocytes (subcluster 4); C1QC and C1QA for C1QC+ macrophages (subclusters 0, 2, 5, 6, and 7); SPP1 and MARCO for SPP1+ macrophages (subclusters 1 and 3). Color key from gray to red indicates relative expression levels from low to high. B) Traditional marker expression for M1‐type macrophages (CCL5, IL6, CD40, CD86, and CXCL10) and M2‐type macrophages (CCL4, CLEC7A, CTSB, IL4R, and TGFB1) plotted onto UMAP projection. C) Bar plot of the enriched KEGG pathways of C1QC+ and SPP1+ macrophages presented with a t‐value of the GSVA score (SPP1+ macrophages versus C1QC+ macrophages). D) UMAP projection of the six subclusters of DCs generated from unsupervised clustering, which could be categorized into five main groups (left) based on marker gene expression (right): CD14, CD1A for CD14+CD1A+ DCs (subcluster 0); CD1C for cDCs (subclusters 1 and 3); LMAP3 for LAMP3+ DCs (subcluster 2); CLEC9A for CLEC9A+ DCs (subcluster 4); and LILRA4 for pDCs (subcluster 5). E) Bubble plot of the enriched pathways of each DC cluster through QUSAGE analysis presented with statistical significance [−Log10(p‐value)] and the enrichment score (color key from blue to red). F) Differentiation trajectory of DC subclusters predicted by monocle. KEGG, Kyoto Encyclopedia of Genes and Genomes; GSVA, gene set variation analysis; DCs, dendritic cells.
Figure 5
Figure 5
CD8+ and CD4+ T cells involved in immunosuppression and exhaustion in CC. A) UMAP projection of the 11 clusters of CD4+ T cells generated from unsupervised reclustering (left), which could be further categorized into three major groups according to marker gene expression (right): CXCL13, IFNG, PDCD1 for Th1‐like cells (subcluster 2, 7, 10); FOXP3, CCR8, LAYN for Tregs (subcluster 1, 3, 6, 8); CCR7, ANXA1, TC2N for Tcm cells (subcluster 0, 4, 5, 9). Color key from gray to red indicates relative expression levels from low to high. B) Expression levels of IL2RA, TNFRSF18, TNFRSF4, and TNFRSF9 in CD4+ T cells are plotted onto the UMAP projection. Color key from gray to red indicates relative expression levels from low to high. C) Expression levels of GZMA, GZMB, CCL4, and TOX in CD4+ T cells are plotted onto the UMAP projection. Color key from gray to red indicates relative expression levels from low to high. D) UMAP projection of the 13 subclusters of CD8+ T cells generated from unsupervised reclustering, which could be categorized into five main groups (left) based on marker gene expression (right): SLC4A10, CCR6, TRAV1‐2 for MAITs (subcluster 11); GPR183, CCR7, GZMK for Tcms (subclusters 2, 5, 6, 9, and 10); LAYN, CXCL13, HAVCR2 for Tex cells (subclusters 1, 7, and 8); KLRC2, KLRC3, KIR3DL2 for IELs (subclusters 0, 3, 4, and 10); FGFBP2, FCGR3A, CXC3R1 for Temra/effffs (subcluster 12). Color key from gray to red indicates relative expression levels from low to high. E) Dot plot indicating the average expression levels and cell expressing proportion of markers for immune checkpoint activation, immune checkpoint inhibition, and cytotoxicity among different CD8+ T cell clusters. The colors represent the average expression levels, and dot sizes represent the percentage expression of selected genes. F) Photographs of TC1 tumors by indicated treatment. The tumors were removed from C57BL/6 mice at day 12 after TC1 cell injection (n = 6 for each group: isotypes, anti‐TIGIT, anti‐CD96, anti‐PD1). G) Average tumor growth curves of TC1 tumors in mice with different treatment options (left) and the scatter plot indicating the tumor weights in different treatment groups (right). Error bar: mean value ± SD (n = 6 for each treatment group). p‐values were obtained by one‐way ANOVA with the Tukey multiple comparison test. **p < 0.01, ****p < 0.0001, ns not significant. H) (Upper) Representative flow cytometric histograms and (lower) the scatter plots of the MFI showing perforin, IFNG and Ki67 expression in T cells in the TC1 tumors after different treatment options. Error bar: mean value ± SD (n = 6 for each treatment group). p‐values were obtained by one‐way ANOVA with the Tukey multiple comparison test. *p < 0.05; **p < 0.01; ***p < 0.001; ns, not significant. CC, cervical cancer; IELs, intraepithelial lymphocytes; SD, standard deviation; ANOVA, analysis of variance; MFI, median fluorescence intensity.
Figure 6
Figure 6
TCR clonotype expansion in CC: three immune reaction patterns. A) Bar plot describing the TCR clonotype expansion in each CC sample in four categories: n = 1, 2 ≤ n <5, 5 ≤ n <15, and n > 15. B) Scatter plots indicating the proportions of five subclusters of CD8+ T cells (left) and 3 subclusters of CD4+ T cells (right) with expanded TCR clonotypes (n ≥ 2). Error bar: median value with 95% CI (n = 8 standing for 8 CC samples). p‐values were obtained by the Kruskal–Wallis test. **p < 0.01; ns, not significant. C) Heat maps of clonotype sharing within different CD8+ T cell subclusters in representative samples including HPV‐positive SCC (SCC_2, HPV 16 positive), HPVA ADC (ADC_2, HPV 18 positive), and NHPVA ADC (ADC_4, endometrioid type and ADC_5, gastric type). Color key from blue to white indicates the shared fraction from low to high. D) Heat maps of clonotype sharing within different CD4+ T cell subclusters in representative samples including HPV‐positive SCC (SCC_2, HPV 16 positive), HPVA ADC (ADC_2, HPV 18 positive), and NHPVA ADC (ADC_4, endometrioid type and ADC_5, gastric type). Color key from blue to white indicates the shared fraction from low to high. TCR, T‐cell receptor; CC, cervical cancer; CI, confidence interval; HPV, human papillomavirus; ADC, cervical adenocarcinoma; SCC, squamous cell carcinoma; NHPVA, non‐human papillomavirus‐associated.
Figure 7
Figure 7
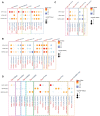
Ligand–receptor interactions in CC with different histologic subtypes and HPV infection statuses. A) Dot plots demonstrate selected ligand–receptor interactions between tip cells and other endothelial cells, respectively, in HPV‐positive SCC, HPVA ADC and NHPVA ADC. The ligand–receptor interactions and histologic subtypes are indicated by the columns and rows, respectively. The means of the average expression levels of two interacting molecules are indicated by color key, with blue to red representing low to high expression. The [−Log10(p‐values)] were indicated by dot size. Tip cells contacted each other through DLL4‐NOTCH interaction and attracted other lymphovascular endothelial cells by producing angiogenic factors such as APLN, ANGPT2, and VEGFC. Intriguingly, ANGPT2>>TEK and APLN>>APLNR interactions were more prominent in the HPV‐positive SCC microenvironment, while VEGFC>>FLT4 and DLL4>>NOTCH4 crosstalk was more remarkable in the ADC ecosystem, especially in NHPVA ADC. Additionally, tip cells characteristically specifically expressing MMP2 in NHPVA ADC, reflect a greater extent of angiogenesis, which was in accordance with a more malignant phenotype. B) Dot plots demonstrate selected ligand–receptor interactions between myCAFs and other cell types respectively in HPV‐positive SCC, HPVA ADC, and NHPVA ADC. MyCAFs show extensive engagement in ECM receptor interactions (collagen>>integrin, WNT>>FZD), illustrating their important roles in ECM remodeling. Moreover, SEMA5A–PLXNB3 interaction between myCAFs and tip cells merely exist in NHPVA ADC samples, which is involved in axon guidance, partly explaining the high rate of neural invasion in this histologic subtype. In addition, we found that growth factors also took part in the cellular crosstalk between myCAFs and iCAFs such as PDGFC and HGF; yet HGF>>CD44 specifically existed in NHPVA ADC microenvironment. C) Dot plots demonstrate selected ligand–receptor interactions between SPP1+ macrophages and other cell types, respectively, in HPV‐positive SCC, HPVA ADC and NHPVA ADC. SPP1+ macrophages produced and responded to certain chemokines (CXCL8/CCL5/CCL2>>ACKR1, CCL18>>CCR8, etc.), among which the widely existed CCL18>>CCR8 interaction might mediate the attraction of CD4+ Tregs. Moreover, SPP1+ macrophages interacted with stroma cells mainly through cell adhesion. And we noticed that SPP1>>avb3 complex and FN1>>a11b1 complex were more remarkable in the NHPVA ADC microenvironment, indicating a greater infiltration of SPP1+ macrophages. D) Dot plots demonstrate selected ligand–receptor interactions between CD8+ Tex cells and other cell types respectively in HPV‐positive SCC, HPVA ADC, and NHPVA ADC. CD8+ T ex cells show comprehensive crosstalk with malignant epithelial cells, DC cells and CD4+ T cells. Notably, the cellular crosstalk between CD8+ Tex cells and epithelial cell were associated with chemotaxis (CXCL13>>ACKR4), antigen‐recognition (CD8A>>CEACAM5) and immune dysfunction (CD96>>NECTIN1, TIGIT>>NECTIN3). Remarkably, CD96‐NECTIN1 interaction was found within CD8+ T ex cells and SSECs, whereas TIGIT‐NECTIN3 interaction was demonstrated within CD8+ T ex cells and GECs, which suggested that different immune checkpoint blockades could be considered for SCC and ADC. Besides, we noticed a greater HLA‐E mediated immune inhibitory response between CD8+ T cells and CD4+ T cells in ADC microenvironment, which might contribute to progressive loss of effector functions of tumor‐specific T cells, a state known as cell exhaustion. Furthermore, regarding the cellular crosstalk between CD8+ T ex cells and DCs, PDCD1–PDCD1LG2 interaction, inducing programmed death of T cells, was observed merely in ADC samples, not in SCC samples, which manifested a more severe immune‐repressed status of ADC. CC, cervical cancer; HPV, human papillomavirus; SCC, squamous cell carcinoma; HPVA, human papillomavirus‐associated; ADC, cervical adenocarcinoma; NHPVA, non‐human papillomavirus‐associated; myCAFs, myoblastic cancer‐associated fibroblasts; ECM, iCAFs, inflammatory cancer‐associated fibroblasts; DC, dendritic cell; SSECs, stratified squamous epithelial cells.
Figure 8
Figure 8
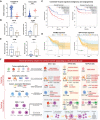
Novel diagnostic and prognostic biomarkers for CC and potential therapy targets based on different histologic subtypes and HPV infection statuses. A) Scatter plots indicating the expression of KRT14 and CLDN3 between 257 SCC samples and 32 ADC samples in the TCGA CESC dataset. Error bar: median value with interquartile range. p‐values were obtained by the two‐sided Mann–Whitney test. ****p < 0.0001. B) IHC expression scores of KRT14 and CLDN3 in 10 SCC samples and 5 ADC samples. Error bar: mean value with SD. p‐values were obtained by the two‐sided unpaired test. ***p < 0.001, ****p < 0.0001. C) Kaplan–Meier curves illustrating the prognostic value of the combined 10‐gene signature indicating both epithelial malignancy (KRT17, S100A10, CDKN2A, CLIC1, KRT20) and sprouting angiogenesis (ESM1, ADAMTSL2, COLA1, APLN, ANGPTL2), constructed by the web tool Gepia2 with the CESC TCGA dataset: the higher the signature expression was, the shorter the OS and DFS were (p = 0.00052 and 0.012, respectively by the log rank test). D) Kaplan–Meier curves indicating the prognostic value of the SPP1/C1QC signature embodying macrophages immunoregulation superior to the M1/M2 signature (p = 0.17): the higher SPP1/C1QC signature expression was, the shorter OS would be (p = 0.0017 by log rank test). E) IHC expression scores of CD96 and TIGIT in 10 SCC samples and 5 ADC samples. Error bar: mean value with SD. p‐values were obtained by two‐sided unpaired test. **p < 0.01; ns, not significant. F) Novel potential targets for precise treatment uniquely to HPV‐positive SCC, HPVA ADC, and NHPVA ADC. CC, cervical cancer; HPV, human papillomavirus; TCGA, The Cancer Genome Atlas; CESC, cervical and endocervical cancer; IHC, immunohistochemistry; SD, standard deviation; OS, overall survival; DFS, disease‐free survival; SCC, squamous cell carcinoma; HPVA, human papillomavirus‐associated; NHPVA, non‐human papillomavirus‐associated.
Figure 9
Figure 9
Flow chart of the current study demonstrating the main methods and significant findings.

References

    1. Arbyn M., Weiderpass E., Bruni L., de Sanjosé S., Saraiya M., Ferlay J., Bray F., Lancet Global Health 2020, 8, e191. - PMC - PubMed
    1. Adegoke O., Kulasingam S., Virnig B., J. Women's Health 2012, 21, 1031. - PMC - PubMed
    1. Guo F., Cofie L. E., Berenson A. B., Am. J. Prev. Med. 2018, 55, 197. - PMC - PubMed
    1. Zhou J., Wu S. G., Sun J. Y., Li F. Y., Lin H. X., Chen Q. H., He Z. Y., J. Cancer Res. Clin. Oncol. 2017, 143, 115. - PMC - PubMed
    1. Reimers L. L., Anderson W. F., Rosenberg P. S., Henson D. E., Castle P. E., Cancer Epidemiol., Biomarkers Prev. 2009, 18, 792. - PubMed

Publication types

Substances