. 2023 Feb 1;13(1):1812.
doi: 10.1038/s41598-023-27413-w.

Cell type specific IL-27p28 (IL-30) deletion in mice uncovers an unexpected regulatory function of IL-30 in autoimmune inflammation

Affiliations

Cell type specific IL-27p28 (IL-30) deletion in mice uncovers an unexpected regulatory function of IL-30 in autoimmune inflammation

Dongkyun Kim et al. Sci Rep. .

Abstract

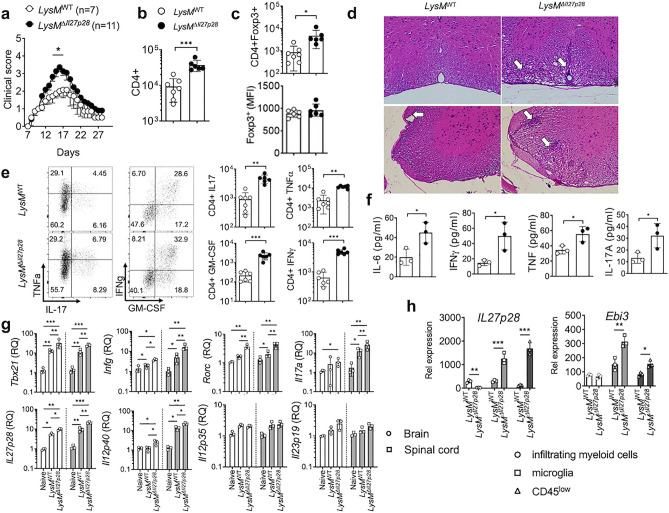
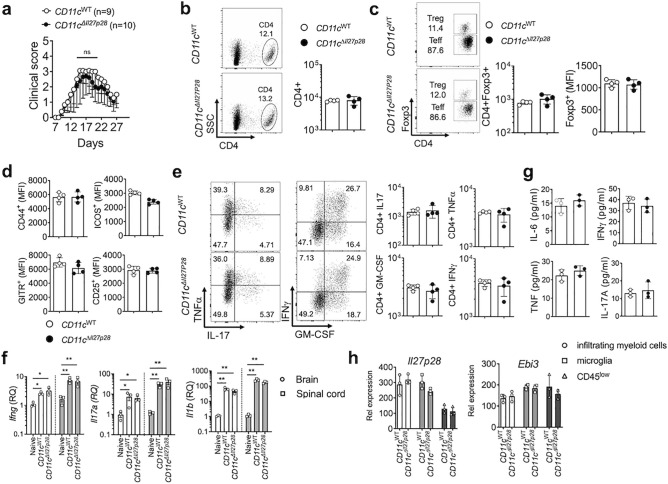
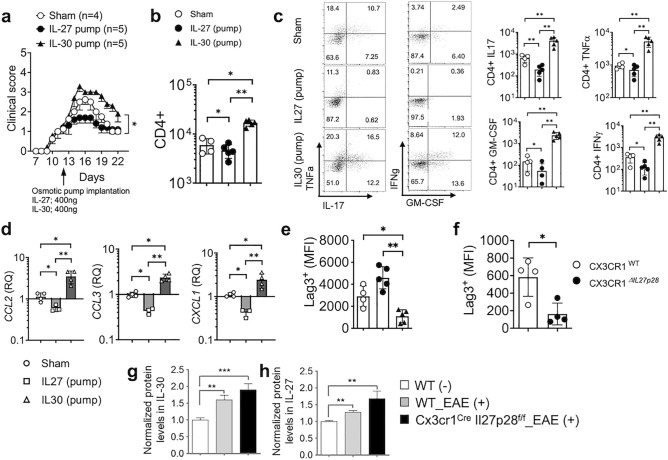
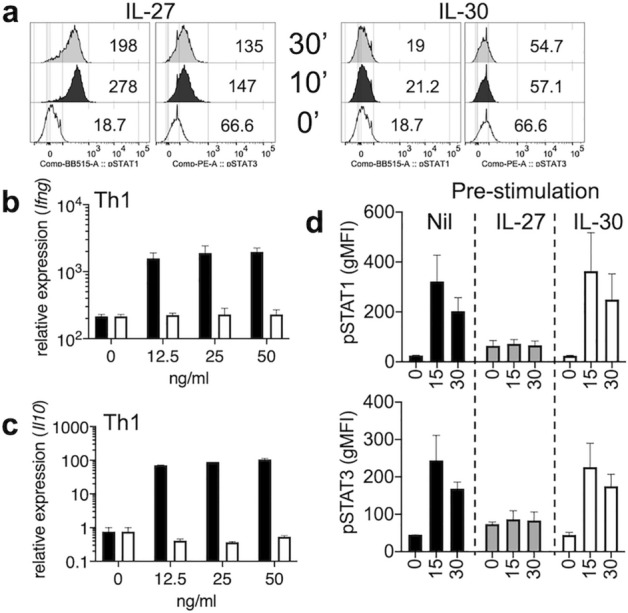
IL-27 is an IL-12 family cytokine with immune regulatory properties, capable of modulating inflammatory responses, including autoimmunity. While extensive studies investigated the major target cells of IL-27 mediating its functions, the source of IL-27 especially during tissue specific autoimmune inflammation has not formally been examined. IL-27p28 subunit, also known as IL-30, was initially discovered as an IL-27-specific subunit, and it has thus been deemed as a surrogate marker to denote IL-27 expression. However, IL-30 can be secreted independently of Ebi3, a subunit that forms bioactive IL-27 with IL-30. Moreover, IL-30 itself may act as a negative regulator antagonizing IL-27. In this study, we exploited various cell type specific IL-30-deficient mouse models and examined the source of IL-30 in a T cell mediated autoimmune neuroinflammation. We found that IL-30 expressed by infiltrating and CNS resident APC subsets, infiltrating myeloid cells and microglia, is central in limiting the inflammation. However, dendritic cell-derived IL-30 was dispensable for the disease development. Unexpectedly, in cell type specific IL-30 deficient mice that develop severe EAE, IL-30 expression in the remaining wild-type APC subsets is disproportionately increased, suggesting that increased endogenous IL-30 production may be involved in the severe pathogenesis. In support, systemic recombinant IL-30 administration exacerbates EAE severity. Our results demonstrate that dysregulated endogenous IL-30 expression may interfere with immune regulatory functions of IL-27, promoting encephalitogenic inflammation in vivo.


Conflict of interest statement

The authors declare no competing interests.

Figures

Figure 1
Figure 1
Cytokine gene expression in the CNS during EAE. (ac) EAE was induced in C57BL/6 mice as described in the “Methods”. RNA was isolated from the brain and spinal cords at disease onset (day 8 post immunization), acute phase (day 14 post immunization) and remission phase (day 21 post immunization). n = 4–6 per group. mRNA expression of IL-12 family genes, cytokines and transcription factors were measured by qRT-PCR. Data were normalized by Gapdh gene expression and compared to that of naive mice. (d) CD45high CD11bhigh (infiltrating myeloid cells), CD45int CD11bhigh (microglia) and CD45low (including astrocyte and oligodendrocyte) cells were sorted from the CNS at the peak of disease (day 17 post immunization) and expression of the indicated genes was measured by qPCR. Gene expression was normalized by Gapdh and compared to that of naïve mice. The results shown represent two independent experiments. *p < 0.05; **p < 0.01; ***p < 0.001; as determined by Mann–Whitney nonparametric test.
Figure 2
Figure 2
EAE in myeloid cell-specific Il27p28−/− mice. LysMWT (n = 7) and LysMCre Il27p28fl/fl (LysMΔIl27p28) (n = 11) mice were induced for EAE. (a) EAE clinical score. (b,c) The numbers of CNS infiltrating CD4+ and CD4+Foxp3+ Treg cells, and the mean fluorescence intensity (MFI) of Foxp3 was determined by flow cytometry at day 17 post immunization. (d) At day 18 postimmunization, tissue sections of the spinal cords were stained with H&E. Arrows indicate infiltration of inflammatory cells. × 200 magnification. (e) Flow cytometry analysis of GM-CSF, IFNγ, IL-17, and TNFα CD4+ T cells from the CNS of EAE mice (day 17 post immunization). (f) The levels of IL-6, IFNγ, TNFα and IL-17A in the serum of EAE mice (day 17 post immunization) were measured using Cytometric Bead Array. Each serum sample was analyzed in duplicates. (g) qPCR analysis of the indicated mRNAs in the brain and spinal cords from naïve, LysMWT, and LysMΔIl27p28 mice 17 days post immunization. Gene expression was normalized by Gapdh and compared to that of naïve mice. n = 3 per group. (h) qPCR analysis of the indicated mRNAs in freshly sorted CD45high CD11bhigh (infiltrating myeloid cells), CD45int CD11bhigh (microglia) and CD45low (astrocyte and oligodendrocyte) cells from LysMWT or LysMΔIl27p28 mice 17 days post immunization. n = 3 per group. *p < 0.05; **p < 0.01; ***p < 0.001; as determined by Mann–Whitney nonparametric test.
Figure 3
Figure 3
EAE in DC-specific Il27p28−/− mice. CD11cWT (n = 9) and CD11cCre Il27p28fl/fl (CD11cΔIl27p28) (n = 10) were induced for EAE. (a) Time course of the development of EAE. (bd) The numbers of CNS-infiltrating CD4+ and CD4+Foxp3+ Treg cells, and the mean fluorescence intensity (MFI) of Foxp3, CD44, ICOS, GITR and CD25 were determined by flow cytometry at day 17 post immunization. (e) Flow cytometry analysis of GM-CSF, IFN-γ, IL-17, and TNFα CD4+ T cells from the CNS of EAE mice (day 17 post immunization). (f) RNAs isolated from the brain and spinal cords at day 17 post immunization were analyzed for the expression of Ifng, Il17a, and Il1b. n = 3 per group. Gene expression was normalized by Gapdh and compared to that of naïve mice. (g) The levels of IL-2, IL-4, IL-6, IFNg, TNFa and IL-17A in the serum of EAE mice (day 17 post immunization) were measured using the Cytometric Bead Array. Each serum sample was analyzed in duplicates. (h) qPCR analysis of the indicated mRNAs in freshly sorted CD45high CD11bhigh (infiltrating myeloid cells), CD45int CD11bhigh (microglia) and CD45low (astrocyte and oligodendrocyte) cells from CD11cWT and CD11cΔIl27p28 mice with EAE. *p < 0.05; **p < 0.01; ***p < 0.001; as determined by Mann–Whitney nonparametric test.
Figure 4
Figure 4
EAE in microglia-specific Il27p28−/− mice. Cx3cr1WT (n = 9) and Cx3cr1Cre Il27p28fl/f (Cx3cr1ΔIl27p28) (n = 10) were induced for EAE. (a) EAE clinical scores. (b,c) Total numbers of CNS-infiltrating CD4+ and CD4+Foxp3+ Treg cells, and the mean fluorescence intensity (MFI) of Foxp3 was determined by flow cytometry at day 17 post immunization. (d) At day 18 postimmunization, tissue sections of the spinal cords were stained with H&E. Arrows indicate infiltration of inflammatory cells. × 200 magnification. (e) Flow cytometry analysis of GM-CSF, IFNγ, IL-17, and TNFα CD4+ T cells from the CNS of EAE mice (day 17 post immunization). (f) qPCR analysis of the indicated mRNAs in the brain and spinal cords from naïve, Cx3cr1WT, and Cx3cr1ΔIl27p28 mice 17 days post immunization. Gene expression was normalized by Gapdh and compared to that of naïve mice. n = 3–5 per group. (g) qPCR analysis of the indicated mRNAs in freshly sorted CD45high CD11bhigh (infiltrating myeloid cells), CD45int CD11bhigh (microglia) and CD45low (including astrocyte and oligodendrocyte) cells from Cx3cr1WT or Cx3cr1ΔIl27p28 mice 17 days post immunization. n = 3 per group. *p < 0.05; **p < 0.01; ***p < 0.001; as determined by Mann–Whitney nonparametric test.
Figure 5
Figure 5
In vivo IL-30 administration develops significantly exacerbated EAE. C57BL/6 mice were induced for EAE. Osmotic pumps containing IL-27 (400 ng, n = 5), IL-30 (400 ng, n = 5) were subcutaneously implanted or sham surgery (n = 4) was performed at 12 days post induction. (a) EAE score. (b) Total CD4+ T cell numbers in the CNS at 22 days post induction. (c) The numbers of GM-CSF, IFNγ, IL-17, and TNFα+ CD4 T cells were determined by intracellular cytokine staining at day 22 post immunization. (d) qPCR analysis of the indicated chemokine expression in the brain from the sham, IL-27-pump and IL-30-pump group. Gene expression was normalized by Gapdh and compared to that of sham surgery group. (e) Lag3 expression of CNS infiltrating Treg cells was determined by flow cytometry. (f) Cx3cr1WT and Cx3cr1ΔIl27p28 mice induced for EAE as described in Fig. 4 were used to measure CNS infiltrating Treg cell expression of Lag3. (g,h) IL-30 and IL-27 levels in the CNS homogenates were measured by ELISA and were normalized to those of naïve wild type mice. n = 7 per group. *p < 0.05; **p < 0.01; ***p < 0.001; as determined by Mann–Whitney nonparametric test.
Figure 6
Figure 6
IL-30 stimulation in CD4 T cell activation in vitro. (a) FACS sorted CD4+ naïve cells were stimulated with recombinant IL-27, IL-30. Phosphorylated STAT1 and STAT3 expression was determined by flow cytometry at 10- and 30-min following stimulation. (b,c) Naive CD4 T cells were stimulated under Th1 polarization conditions in the presence of IL-27 (filled bar) or IL-30 (open bar) (0–50 ng/mL) for 3 days. Ifng and Il10 mRNA expression was determined by qPCR. (d) Naïve CD4 T cells were incubated with media (Nil), 50 ng IL-27, or 50 ng IL-30 for one hour. The cells were then washed and restimulated with IL-27. Stat1 and Stat3 phosphorylation was determined by flow cytometry at 15 and 30 min following stimulation. The data shown are representative of two independent experiments.

Similar articles

References

    1. Kourko O, Seaver K, Odoardi N, Basta S, Gee K. IL-27, IL-30, and IL-35: A cytokine triumvirate in cancer. Front. Oncol. 2019;9:969. doi: 10.3389/fonc.2019.00969. - DOI - PMC - PubMed
    1. Yoshida H, Hunter CA. The immunobiology of interleukin-27. Annu. Rev. Immunol. 2015;33:417–443. doi: 10.1146/annurev-immunol-032414-112134. - DOI - PubMed
    1. Yoshimura T, et al. Two-sided roles of IL-27: Induction of Th1 differentiation on naive CD4+ T cells versus suppression of proinflammatory cytokine production including IL-23-induced IL-17 on activated CD4+ T cells partially through STAT3-dependent mechanism. J. Immunol. 2006;177:5377–5385. doi: 10.4049/jimmunol.177.8.5377. - DOI - PubMed
    1. Cao Y, Doodes PD, Glant TT, Finnegan A. IL-27 induces a Th1 immune response and susceptibility to experimental arthritis. J. Immunol. 2008;180:922–930. doi: 10.4049/jimmunol.180.2.922. - DOI - PubMed
    1. Diveu C, et al. IL-27 blocks RORc expression to inhibit lineage commitment of Th17 cells. J. Immunol. 2009;182:5748–5756. doi: 10.4049/jimmunol.0801162. - DOI - PubMed

Publication types

LinkOut - more resources