. 2023 Feb;614(7949):781-787.
doi: 10.1038/s41586-022-05664-3. Epub 2023 Feb 1.

Structural basis for substrate selection by the SARS-CoV-2 replicase

Affiliations

Structural basis for substrate selection by the SARS-CoV-2 replicase

Brandon F Malone et al. Nature. 2023 Feb.

Abstract

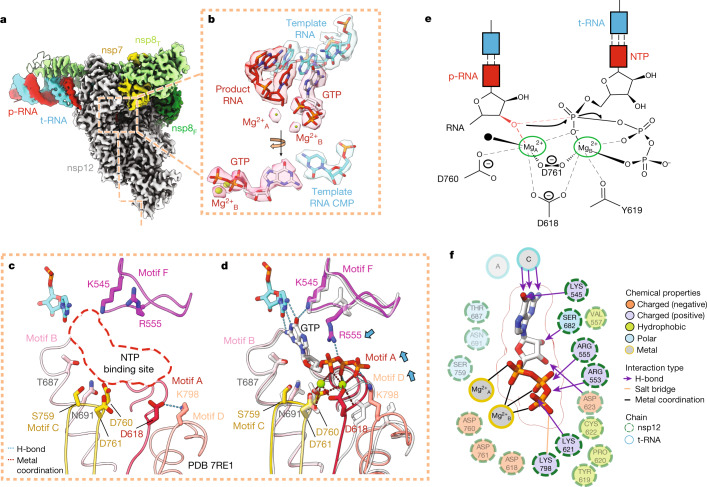
The SARS-CoV-2 RNA-dependent RNA polymerase coordinates viral RNA synthesis as part of an assembly known as the replication-transcription complex (RTC)1. Accordingly, the RTC is a target for clinically approved antiviral nucleoside analogues, including remdesivir2. Faithful synthesis of viral RNAs by the RTC requires recognition of the correct nucleotide triphosphate (NTP) for incorporation into the nascent RNA. To be effective inhibitors, antiviral nucleoside analogues must compete with the natural NTPs for incorporation. How the SARS-CoV-2 RTC discriminates between the natural NTPs, and how antiviral nucleoside analogues compete, has not been discerned in detail. Here, we use cryogenic-electron microscopy to visualize the RTC bound to each of the natural NTPs in states poised for incorporation. Furthermore, we investigate the RTC with the active metabolite of remdesivir, remdesivir triphosphate (RDV-TP), highlighting the structural basis for the selective incorporation of RDV-TP over its natural counterpart adenosine triphosphate3,4. Our results explain the suite of interactions required for NTP recognition, informing the rational design of antivirals. Our analysis also yields insights into nucleotide recognition by the nsp12 NiRAN (nidovirus RdRp-associated nucleotidyltransferase), an enigmatic catalytic domain essential for viral propagation5. The NiRAN selectively binds guanosine triphosphate, strengthening proposals for the role of this domain in the formation of the 5' RNA cap6.


Conflict of interest statement

E.A.C. and S.A.D. received funding from Gilead Sciences, Inc. in support of this study. J.K.P., T.C.A., J.Y.F. and J.P.B. are Gilead employees. M.G. received funding from Gilead Sciences Inc. for studies on the mechanism of action of remdesivir. All other authors declare no competing interests.

Figures

Fig. 1
Fig. 1. Capturing the SARS-CoV-2 RTC ternary complex.
a, Schematic depicting the major steps of the nucleotide addition cycle of the RTC. The pre-incorporation complex studied here is highlighted (red dashed box). b, nMS analysis of the RTC bound to a 3′ oxy p-RNA in the absence and presence of 300 µM ATP, RDV-TP or GTP, respectively. c, Similar nMS analysis to b but the RTC was reconstituted using a 3′-deoxy p-RNA (RTC*). p-RNA and t-RNA schematics were created with BioRender.com.
Fig. 2
Fig. 2. Structural basis of nucleotide recognition.
a, Cryo-EM density of the 2.7 Å nominal resolution +GTP structure (S4_GTP), coloured according to the fitted model chains. b, Cryo-EM density of the bound incoming GTP, two associated metal ions and the nearby bases of the t-RNA and p-RNA strands. c, Close-up of the active site of the apo complex PDB 7RE1 (ref. ), illustrating the arrangement of the conserved RdRp active site motifs A–D and F (crimson, hot pink, gold, salmon and magenta, respectively) and of key residues when the NTP binding site (dashed red line) is empty. d, Comparison of the S4_GTP and apo structure (faded grey) active sites, highlighting observed motif/residue rearrangements (blue arrows) on NTP binding. Movements in motifs A and D close the active site. e, Schematic depicting nucleotide addition, in the presence of an intact 3′-OH, based on disposition of magnesiums and NTP in the S4_GTP structure. f, 2D schematic of the suite of interactions involved in NTP binding based on distances in the S4_GTP structure. Residues interacting indirectly or weakly with the NTP are faded for clarity.
Fig. 3
Fig. 3. Molecular basis of remdesivir’s incorporation selectivity.
a, Chemical structures of ATP and RDV-TP, highlighting the position of the RDV-TP 1′ cyano group. b, Cryo-EM densities of the S2_RDV-TP structure, coloured according to fitted model chains. Zoom-in on the bound RDV-TP illustrates the RDV-TP 1′ cyano group is accommodated in a hydrophilic pocket formed by motif B and C residues. Protein surface is coloured according to electrostatics. ce, Comparison of the active sites of the S1_RDV-TP (c), S4_GTP (d) and S5_CTP (e) structures reveals that the RdRp cyano pocket can also bind a water molecule (map density around the water shown in mesh), which needs to be displaced for RDV-TP binding. f, A comparison of the S2_RDV-TP and S4_GTP structures reveals two predominant rotamers of R555 that mediate either a pi–pi stacking (red dotted lines) or a H-bond (blue dotted line) interaction with the incoming NTP.
Fig. 4
Fig. 4. NiRAN specific recognition of GTP.
a, View of the NiRAN domain of the RTC, bound to GTP, which lies at the amino-terminal end of nsp12. b, GTP is selectively recognized in the NiRAN pocket by a series of hydrogen-bonding and electrostatic interactions in which interacting residues are shown as sticks. c, 2D schematic illustrating the NiRAN-GTP interactions. d, Residues that mediate GTP recognition are shown as sticks and coloured according to their conservation across the α and β coronavirus clades. e, Binding of GTP in the NiRAN is mediated through an induced fit that widens the pocket for insertion of the guanine base. Cross-sections (dashed lines) of the pocket surface area (PSA) of the S4_GTP (GTP bound), S3_UTP and S5_CTP (apo-NiRAN) are shown overlaid on a clipped surface view of the nsp12 NiRAN. The NiRAN pocket volume was measured using the Schrodinger Sitemap tool. The mean ± s.d. of the pocket volumes of the S1_RDV-TP, S3_UTP and S5_CTP structures (apo-NiRAN, n = 3) is shown. The estimated volume sizes of the datasets are shown as overlaid circles in which the green, cyan and red circles represent the calculated PSA for the S3, S5 and S1 structures, respectively.
Extended Data Fig. 1
Extended Data Fig. 1. Cryo-EM processing pipeline and analysis for S1_RDV-TP dataset.
(a) Cryo-EM processing pipeline for the S1_RDV-TP dataset. (b) Angular distribution plot for the S1_RDV-TP dataset, calculated in cryoSPARC. Scale depicts number of particles assigned to a specific angular bin. (c) Nominal 3.38 Å resolution cryo-EM reconstruction filtered by local resolution and colored according to fitted model chain. Right panel is clipped to reveal RTC active site. (d) Directional 3D FSC for S1_RDV-TP, determined with 3DFSC. (e) Gold-standard FSC plot for the S1_RDV-TP dataset, calculated by comparing two half maps from cryoSPARC. The blue dotted line represents the 0.143 FSC cutoff.
Extended Data Fig. 2
Extended Data Fig. 2. Cryo-EM processing pipeline and analysis for S2_ATP dataset.
(a) Cryo-EM processing pipeline for the S2_ATP dataset. (b) Angular distribution plot for the S2_ATP dataset, calculated in cryoSPARC. Scale depicts number of particles assigned to a specific angular bin. (c) Nominal 3.09 Å resolution cryo-EM reconstruction filtered by local resolution and colored according to fitted model chain. Right panel is clipped to reveal RTC active site. (d) Directional 3D FSC for S2_ATP, determined with 3DFSC. (e) Gold-standard FSC plot for the S2_ATP dataset, calculated by comparing two half maps from cryoSPARC. The blue dotted line represents the 0.143 FSC cutoff.
Extended Data Fig. 3
Extended Data Fig. 3. Cryo-EM processing pipeline and analysis for S3_UTP dataset.
(a) Cryo-EM processing pipeline for the S3_UTP dataset. (b) Angular distribution plot for the S3_UTP dataset, calculated in cryoSPARC. Scale depicts number of particles assigned to a specific angular bin. (c) Nominal 3.13 Å resolution cryo-EM reconstruction filtered by local resolution and colored according to fitted model chain. Right panel is clipped to reveal RTC active site. (d) Directional 3D FSC for S3_UTP, determined with 3DFSC. (e) Gold-standard FSC plot for the S3_UTP dataset, calculated by comparing two half maps from cryoSPARC. The blue dotted line represents the 0.143 FSC cutoff.
Extended Data Fig. 4
Extended Data Fig. 4. Cryo-EM processing pipeline and analysis for S4_GTP dataset.
(a) Cryo-EM processing pipeline for the S4_GTP dataset. (b) Angular distribution plot for the S4_GTP dataset, calculated in cryoSPARC. Scale depicts number of particles assigned to a specific angular bin. (c) Nominal 2.68 Å resolution cryo-EM reconstruction filtered by local resolution and colored according to fitted model chain. Right panel is clipped to reveal RTC active site. (d) Directional 3D FSC for S4_GTP, determined with 3DFSC. (e) Gold-standard FSC plot for the S4_GTP dataset, calculated by comparing two half maps from cryoSPARC. The black dotted line represents the 0.143 FSC cutoff.
Extended Data Fig. 5
Extended Data Fig. 5. Cryo-EM processing pipeline and analysis for S5_CTP dataset.
(a) Cryo-EM processing pipeline for the S5_CTP dataset. (b) Angular distribution plot for the S5_CTP dataset, calculated in cryoSPARC. Scale depicts number of particles assigned to a specific angular bin. (c) Nominal 2.67 Å resolution cryo-EM reconstruction filtered by local resolution and colored according to fitted model chain. Right panel is clipped to reveal RTC active site. (d) Directional 3D FSC for S5_CTP, determined with 3DFSC. (e) Gold-standard FSC plot for the S5_CTP dataset, calculated by comparing two half maps from cryoSPARC. The black dotted line represents the 0.143 FSC cutoff.
Extended Data Fig. 6
Extended Data Fig. 6. Biochemical assays probing stabilization of pre-incorporation complex.
(a) SDS-PAGE of purified SARS-CoV-2 nsp7/8 & nsp12. The experiment was performed once. (b) Size exclusion chromatography for the purified RTC complex, composed of nsp7/82/12 bound to the reconstituted product/template-RNA scaffold (chromatogram trace using the S4 scaffold is depicted). (c) SDS-PAGE of assembled RTC complex following size exclusion. Gel (n = 1) illustrates RTC assembly on the S4 scaffold. (d) S4 RNA scaffold utilized for the S4_GTP structure and incorporation assays. (e) Gel-based primer elongation assay in presence of physiological metal, Mg2+, and non-physiological metal, Ca2+, to investigate use of Ca2+ for stabilization of the pre-incorporation complex (gel depicts n = 2 with n = 3 experiments performed). Products are visualized alongside Decade RNA ladder (Invitrogen) showing separation in nucleotides (nts). (f) S3 RNA scaffold used for the S3_UTP structure and incorporation assays. (g) Gel-based primer elongation assay in presence of UTP, UMPNPP and 3′deoxy UTP (gel depicts n = 2 with n = 3 experiments performed). Products are visualized alongside Decade RNA ladder (Invitrogen) showing separation in nucleotides (nts). (h) Native mass spectrometry analysis of RNA extension in presence of ADP, RDV-DP & ATP using the S1/S2 RNA scaffold. (i) Native mass spectrometry analysis of RNA extension in presence of GDP using the S4 RNA scaffold.
Extended Data Fig. 7
Extended Data Fig. 7. Motif F residue interactions with the incoming NTPs.
(ae) Analysis of the active sites of structures (S1–S5) illustrate that K545 and R555 interact differentially with each of the incoming nucleotides. H-bonds are depicted as dotted-cyan lines. (f,g) 2D schematics illustrating the set of interactions between RDV-TP (f) and ATP (g) and the active site.
Extended Data Fig. 8
Extended Data Fig. 8. Conservation of the CoV active site across clades and SARS-CoV-2 strains.
(a) Zoom-in on the active site of S4_GTP, highlighting residues (sticks) which interact with the bound GTP/2xMg in which ribbon/sticks are colored according to the amino acid conservation across a representative list of viruses found in the α & β coronavirus clades (Supplementary Table 3). (b) Bar plot showing the frequency of occurrence of the wild-type amino acid (reference strain Wuhan/Hu-1/2019) as well as their summed mutations according to the GISAID database, as of April 2022, for the nsp12 active site residues and the nsp12 residue P323. (c) Bar plot showing the frequency of occurrence of the wild-type amino acid (reference strain Wuhan/Hu-1/2019) as well as their summed mutations according to the GISAID database, as of April 2022, for Spike (S) residues found in the ACE2 binding region.
Extended Data Fig. 9
Extended Data Fig. 9. Biochemical analysis of the role of residue S759 in RDV-TP recognition.
(a) RNA template sequence used to determine the efficiency of adenosine triphosphate (ATP) or RDV-TP incorporation at position 6 (i). G indicates incorporation of [α32P] guanosine triphosphate (GTP) at position 5 (red). (b) Migration patterns of the products of ATP or RDV-TP incorporation reactions with wild-type and S759A SARS-CoV-2 RdRp complexes are shown. Main products emerge at position 6. The 5’- 32P-labeled 4-nucleotide primer (4) is used as a size marker (m), illustrating sizing in nucleotides (nts) (c) Graphical representation of ATP or RDV-TP single-nucleotide incorporation during RNA synthesis as a function of their respective concentrations shown in (b). Best-fit lines illustrate fitting of the data points to Michaelis-Menten kinetics function using GraphPad Prism 7.0. Data shows mean values with error bars illustrating the SDs of the data. All data represent at least three independent experiments (n = 4 for wild-type and n = 3 for S759A SARS-CoV-2 RdRp complexes). (d) Vmax refers to the maximum velocity required to convert substrates into products in a substrate-saturated system, reported as a product fraction of incorporated nucleotide. Km is a parameter indicating the concentration of substrate at one-half Vmax, in μM. The standard error of the linear fit is denoted (±). The Vmax/Km ratio reflects catalytic efficiency and is used here to determine the selectivity of RDV-TP by taking the ratio between the catalytic efficiency of ATP and of RDV-TP. The discrimination index is defined as the ratio between the mutant RdRp’s selectivity values in relation to that of the wild-type.
Extended Data Fig. 10
Extended Data Fig. 10. Comparison of NiRAN binding poses.
(a) Models (PDBs 6XEZ & 7CYQ) of the nsp12 NiRAN with a bound base in the ‘Base-out’ pose. (b) Models (PDBs 7ED5 & 7UOB) of the nsp12 NiRAN with a bound base in the ‘Base-in’ pose. (c) Surface representation detailing the NiRAN active site pocket bound to a nucleotide in the ‘base-out’ pose (PDB 6XEZ) aligned with a structure with a bound nucleotide in the ‘base-in’ pose (PDB 7ED5).

References

    1. Malone B, Urakova N, Snijder EJ, Campbell EA. Structures and functions of coronavirus replication–transcription complexes and their relevance for SARS-CoV-2 drug design. Nat. Rev. Mol. Cell Biol. 2022;23:21–39. doi: 10.1038/s41580-021-00432-z. - DOI - PMC - PubMed
    1. Beigel JH, et al. Remdesivir for the treatment of COVID-19—final report. N. Engl. J. Med. 2020;383:1813–1826. doi: 10.1056/NEJMoa2007764. - DOI - PMC - PubMed
    1. Dangerfield TL, Huang NZ, Johnson KA. Remdesivir is effective in combating COVID-19 because it is a better substrate than ATP for the viral RNA-dependent RNA polymerase. iScience. 2020;23:101849. doi: 10.1016/j.isci.2020.101849. - DOI - PMC - PubMed
    1. Gordon CJ, et al. Remdesivir is a direct-acting antiviral that inhibits RNA-dependent RNA polymerase from severe acute respiratory syndrome coronavirus 2 with high potency. J. Biol. Chem. 2020;295:6785–6797. doi: 10.1074/jbc.RA120.013679. - DOI - PMC - PubMed
    1. Slanina H, et al. Coronavirus replication–transcription complex: vital and selective NMPylation of a conserved site in nsp9 by the NiRAN-RdRp subunit. Proc. Natl Acad. Sci. USA. 2021;118:e2022310118. doi: 10.1073/pnas.2022310118. - DOI - PMC - PubMed

Publication types

MeSH terms