. 2023 Feb;614(7948):548-554.
doi: 10.1038/s41586-022-05672-3. Epub 2023 Feb 1.

Single-cell spatial landscapes of the lung tumour immune microenvironment

Affiliations

Single-cell spatial landscapes of the lung tumour immune microenvironment

Mark Sorin et al. Nature. 2023 Feb.

Abstract

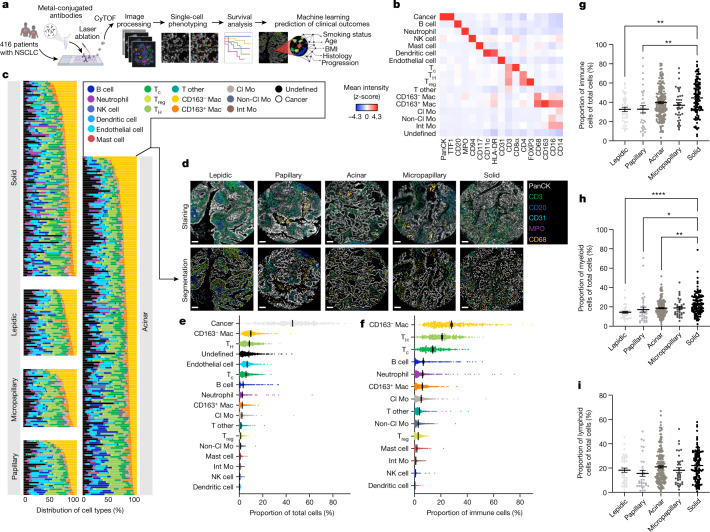
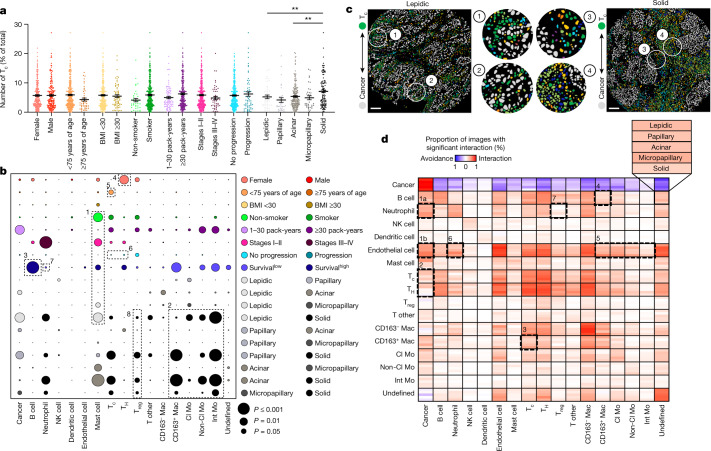
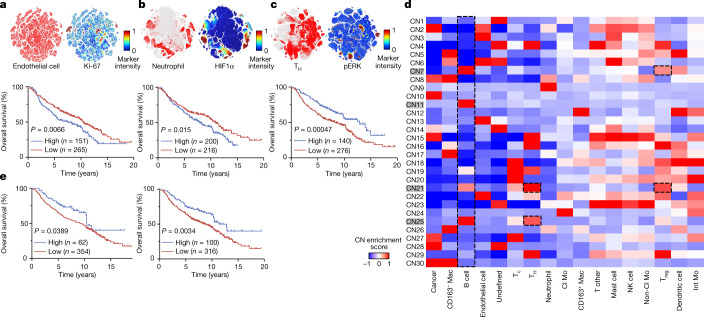
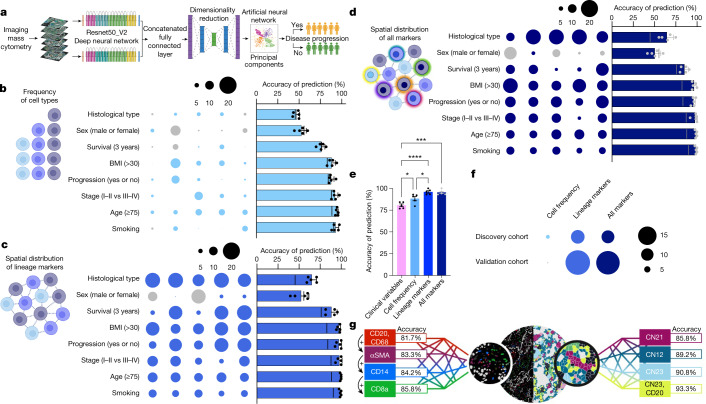
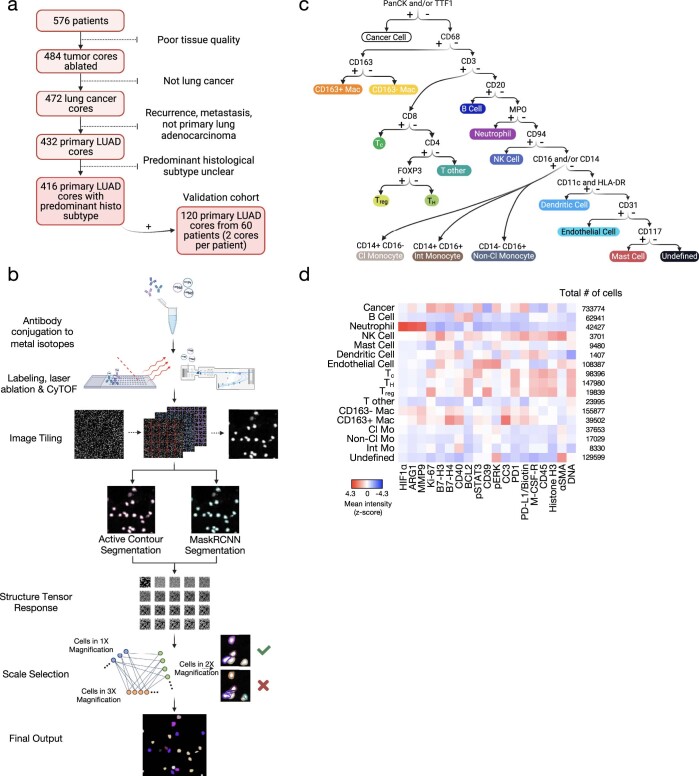
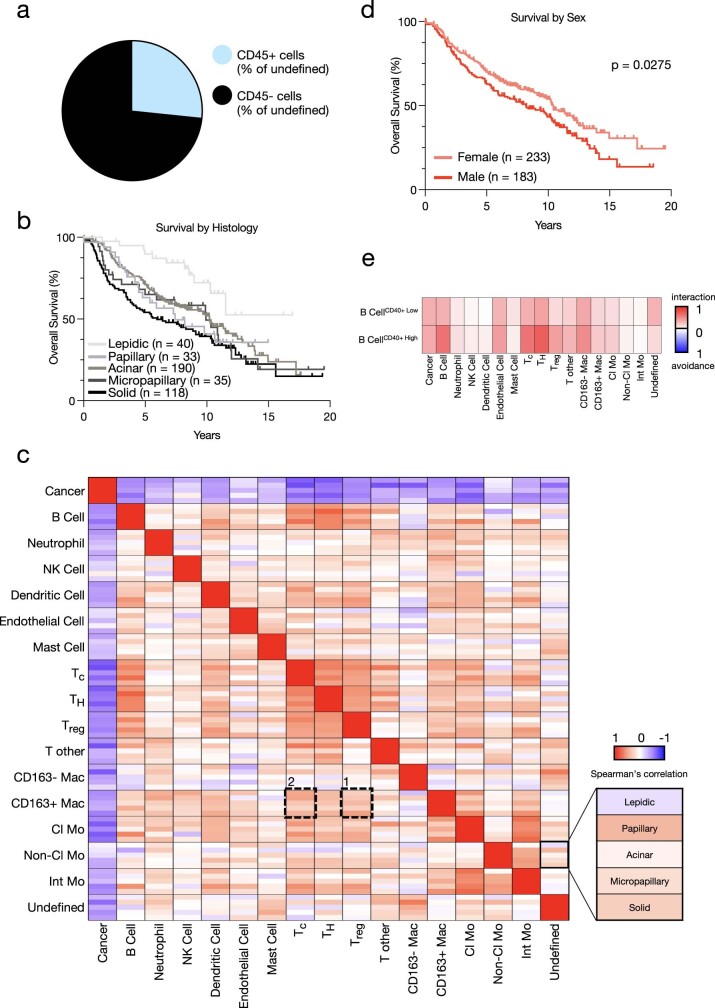
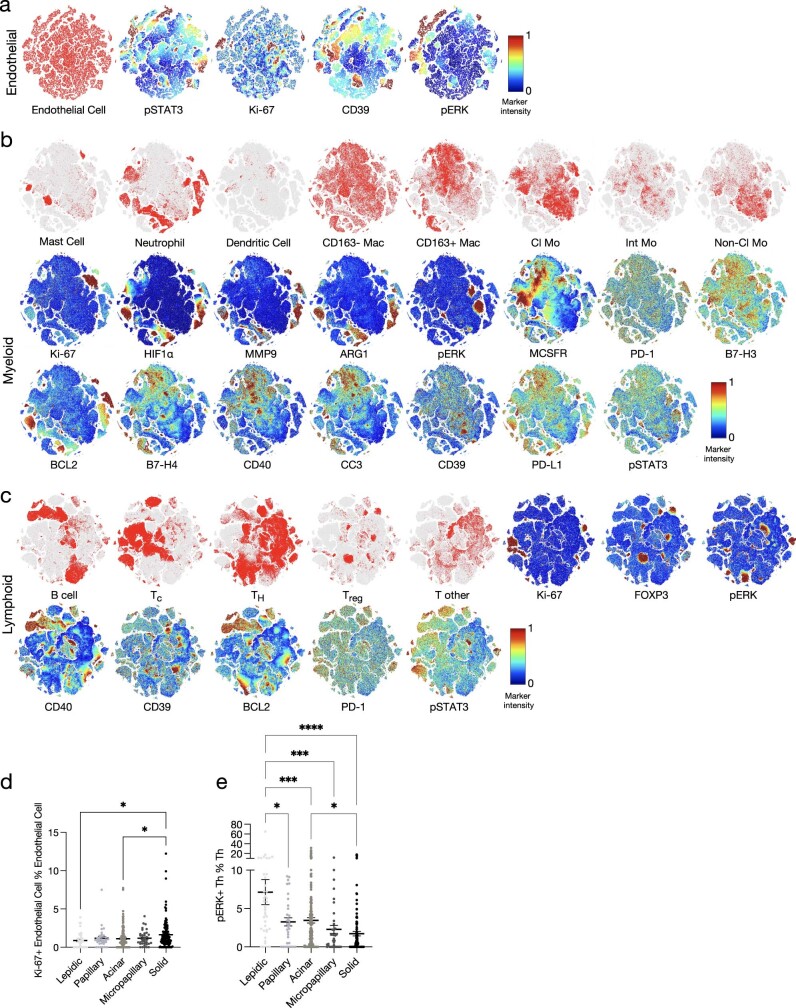
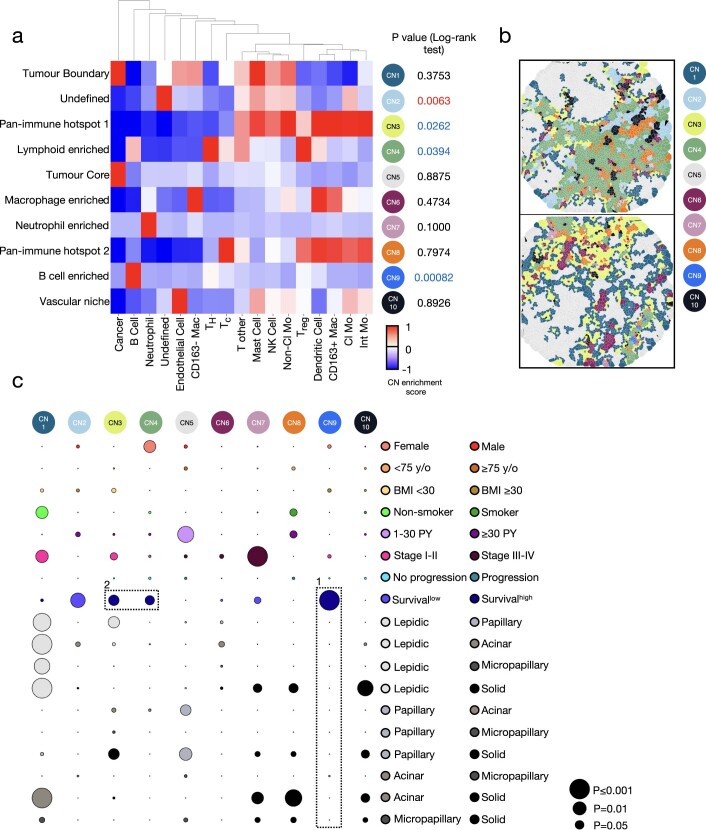
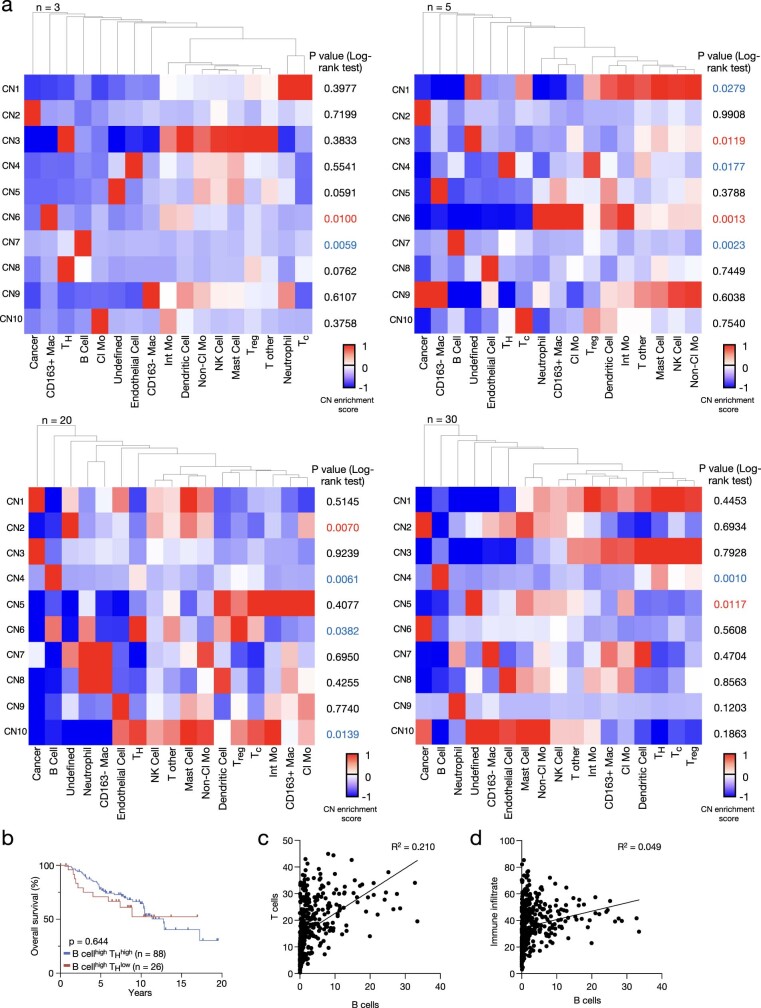
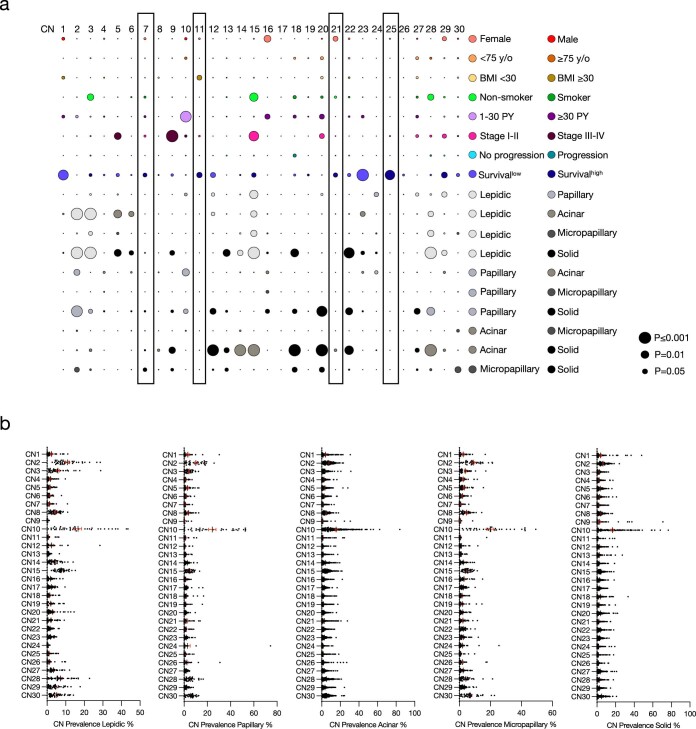
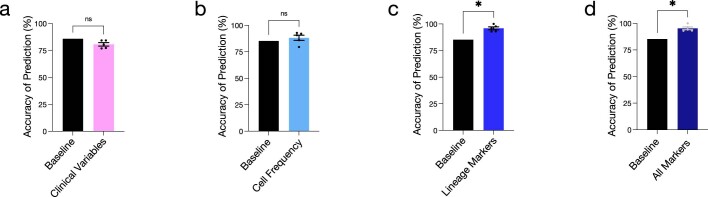
Single-cell technologies have revealed the complexity of the tumour immune microenvironment with unparalleled resolution1-9. Most clinical strategies rely on histopathological stratification of tumour subtypes, yet the spatial context of single-cell phenotypes within these stratified subgroups is poorly understood. Here we apply imaging mass cytometry to characterize the tumour and immunological landscape of samples from 416 patients with lung adenocarcinoma across five histological patterns. We resolve more than 1.6 million cells, enabling spatial analysis of immune lineages and activation states with distinct clinical correlates, including survival. Using deep learning, we can predict with high accuracy those patients who will progress after surgery using a single 1-mm2 tumour core, which could be informative for clinical management following surgical resection. Our dataset represents a valuable resource for the non-small cell lung cancer research community and exemplifies the utility of spatial resolution within single-cell analyses. This study also highlights how artificial intelligence can improve our understanding of microenvironmental features that underlie cancer progression and may influence future clinical practice.


Conflict of interest statement

The authors declare no competing interest.

Figures

Fig. 1
Fig. 1. IMC defines the spatial landscape of LUAD.
a, Schematic depicting IMC acquisition of multiplexed images from 416 patients with LUAD, single-cell phenotyping, survival and machine learning prediction of clinical outcomes. CyTOF, cytometry by time of flight. Images were created with BioRender. b, Average expression of lineage markers across cell types in the LUAD tissue using the panel of isotope-conjugated antibodies. Cl Mo, classical monocyte; Int Mo, intermediate monocyte; Mac, macrophage; NK, natural killer; non-Cl Mo, non-classical monocyte; Tc, cytotoxic T cell; TH, helper T cell. c, Waterfall plot depicting the distribution of 16 stromal and immune cell types across histological subgroups. d, Representative images of antibody staining and corresponding single-cell segmented images across histological subgroups. Scale bars, 100 μm. e,f, Prevalence of 17 cell types, including 14 immune cell types, across 416 patients with LUAD as a proportion of total cells (e) and immune cells (f). gi, Prevalence of all immune (g), myeloid (h) and lymphoid (i) cells across lepidic (n = 40), papillary (n = 33), acinar (n = 190), micropapillary (n = 35) and solid (n = 118) architectural patterns as a proportion of total cells. Comparison between lepidic and solid (immune cells): **P = 0.0013. Comparison between papillary and solid (immune cells): **P = 0.0039. Comparison between lepidic and solid (myeloid cells): ****P ≤ 0.0001. Comparison between papillary and solid (myeloid cells): *P = 0.0474. Comparison between acinar and solid (myeloid cells): **P = 0.0072. Data shown as mean ± s.e.m. (ei). One-way ANOVA with Tukey multiple comparison test was used for statistical analysis (gi).
Fig. 2
Fig. 2. Variability in single-cell distributions across clinical variables and in cell–cell interaction profiles across histological patterns in LUAD.
a, Prevalence of Tc cells (CD8+ T cells) across sex (female n = 233, male n = 183), age (younger than 75 years of age n = 369, 75 years of age or older n = 47), BMI (less than 30 n = 346, 30 or higher n = 70), smoking status (smoker n = 376, non-smoker n = 38), pack-years (1–30 n = 89, 30 or more n = 256), stage (I-II n = 365, III–IV n = 50), progression status (progression n = 64, no progression n = 340) and histological subgroup (lepidic n = 40, papillary n = 33, acinar n = 190, micropapillary n = 35, solid n = 118). Comparison between papillary and solid: **P = 0.0070, and acinar and solid: **P = 0.0076. Data shown as mean ± s.e.m. b, Bubble plot in which the circle size represents the level of significance and the circle colour indicates which of the two comparisons on the y axis has higher levels of the cell type on the x axis. Survivallow, survival in the context of low (z-score < 0) cell prevalence. For P values, see Supplementary Table 4. c, Segmented images showing increased interaction of cancer and Tc cells in lepidic versus solid predominant LUAD. Scale bars, 100 μm. d, Heat map depicting significant pairwise cell–cell interaction (red) or avoidance (blue) across the five histological subgroups (lepidic n = 40 images, papillary n = 33 images, acinar n = 190 images, micropapillary n = 35 images, solid n = 118 images; 1,000 permutations each). The black boxes depict associations referenced in the text. FDR-corrected two-tailed Student’s t-test for sex, age, BMI, smoking status, pack-years, stage and progression status; one-way ANOVA with Tukey multiple comparison test for histological subgroup; and log-rank test for survival were used for statistical analysis (a,b).
Fig. 3
Fig. 3. Single-cell populations and neighbourhoods are associated with distinct outcomes in LUAD.
ac, t-SNE of endothelial, myeloid and lymphoid cell populations highlighting the distribution of 108,387 endothelial cells (a), 42,427 neutrophils (b) and 147,980 CD4+ TH cells (c), and the positivity of the Ki-67 (endothelial cells), HIF1α (neutrophils) and pERK (TH cells) markers. Kaplan–Meier curves of overall survival for 416 patients with LUAD based on low (z-score < 0) and high (z-score ≥ 0) prevalence of the indicated cell types are also shown. d, Heatmap of 30 CNs discovered in 416 patients with LUAD. The CNs highlighted in grey refer to B-cell-enriched neighbourhoods. e, Kaplan–Meier curves of overall survival for 416 patients with LUAD based on low (z-score < 0) and high (z-score ≥ 0) prevalence of B cell CN11 (left) and CN25 (right). log-rank test was used for statistical analysis (ac,e).
Fig. 4
Fig. 4. Machine learning of IMC data predicts clinical outcomes.
a, Schematic of the deep-learning-based strategy involving deep residual networks (Resnet50) architecture on the ImageNet dataset for feature extraction from IMC image channels. bd, Fivefold cross-validation across clinical outcomes: histological patterns, sex (male or female), BMI (less than 30 or 30 or higher) and age (younger than 75 years of age or 75 years of age or older) n = 416; survival (less than 3 years, 3 years or longer) n = 407; progression status (progression or no progression) n = 404; stage (I–II or III–IV) n = 415; smoking status (smoker or non-smoker) n = 414 using frequency of cell types (b); spatial distribution of lineage markers (c) and spatial distribution of all markers (d). The size of the bubble represents deviation from baseline, with blue and grey indicating an improvement or worsening in predictive performance, respectively. The line in the bar plot represents the baseline. Schematics in ad were created with BioRender. e, Accuracy of clinical progression prediction in patients with stage I LUAD (n = 286) using clinical variables, cell frequency, lineage marker and ‘all markers’ models. Comparison between the clinical variables and the cell frequency model: *P = 0.0319. Comparison between the clinical variables and lineage marker model: ****P < 0.0001. Comparison between the clinical variables and all markers model: ***P = 0.0001. Comparison between the cell frequency and lineage marker model: *P = 0.0321. f, Accuracy of clinical progression prediction in patients with stage I LUAD; discovery cohort (n = 286) and validation cohort (n = 60; 120 cores) in the cell frequency, lineage and all markers models compared with baseline. The size of the bubble represents deviation from baseline, with blue and grey indicating an improvement or worsening in predictive performance, respectively. g, Accuracy of clinical progression prediction in patients with stage I LUAD (validation cohort n = 60; 120 cores) using combinations of top-ranked (left) and neighbourhood-derived (right) lineage markers. For all combinations, see Supplementary Table 15. Data shown as mean ± s.e.m. (be). One-way ANOVA with Tukey multiple comparison test was used for statistical analysis (e).
Extended Data Fig. 1
Extended Data Fig. 1. Imaging mass cytometry segmentation pipeline and antibody panel.
a, Flowchart for inclusion and exclusion criteria of 576 lung adenocarcinoma cores. b, Schematic of IMC segmentation pipeline representing antibody conjugation of metal isotopes, labeling, laser ablation, CyTOF acquisition, image tiling, structure tensor response, scale selection and final output. c, Schematic depiction of the workflow and specific markers used for lineage assignment. Panels ac were created with BioRender. d, Average expression of non-lineage markers across cell types in lung adenocarcinoma tissue stained with the panel of isotope-conjugated antibodies; CD163Mac, CD163 macrophage; CD163+ Mac, CD163+ macrophage; Tc, CD8+ T cell; Treg, regulatory T cell, TH, CD4+ T cell; Cl Mo, classical monocyte; Int Mo, intermediate monocyte; Non-Cl Mo, non-classical monocyte; NK Cell, natural killer cell.
Extended Data Fig. 2
Extended Data Fig. 2. Antibody panel validation 1.
Validation of 18 antibodies used for multiplex IMC across positive and negative controls. Scale bars represent 50 μm.
Extended Data Fig. 3
Extended Data Fig. 3. Antibody panel validation 2.
Validation of 17 antibodies used for multiplex IMC across positive and negative controls. Scale bars represent 50 μm.
Extended Data Fig. 4
Extended Data Fig. 4. Antibody panel validation 3.
Lineage marker staining and corresponding cell segmentation in control tissue. Colour code for cell segmentation is provided. Scale bars represent 100 μm.
Extended Data Fig. 5
Extended Data Fig. 5. Survival analysis of distinct clinical variables.
a, Pie chart depicting the proportion of undefined cells that are CD45+ across 416 lung adenocarcinoma patients. b, Kaplan–Meier curves of overall survival for 416 lung adenocarcinoma patients based on histological subgroup (Lepidic n = 40, Papillary n = 33, Acinar n = 190, Micropapillary n = 35, Solid n = 118. For P values, see Supplementary Table 3. c, Heatmap depicting the Spearman’s rank correlation coefficient with high coefficients in red and low coefficients in blue between indicated cell types across the five histological subgroups (Lepidic n = 40 images, Papillary n = 33 images, Acinar n = 190 images, Micropapillary n = 35 images, Solid n = 118 images). d, Kaplan–Meier curves of overall survival for 416 lung adenocarcinoma patients based on sex (Female n = 233, Male n = 183). e, Heatmap depicting cell-cell interaction/avoidance among B cells in the CD40+ B cell high (z score ≥0; %total B cells) and CD40+ B cell low (z score <0; %total B cells) groups. Each rectangle depicts significant pairwise cell-type interaction (red) or avoidance (blue) between indicated cell types (n = 186 images for the CD40+ B cell high group; n = 230 images for the CD40+ B cell low group; 1,000 permutations each). Statistical analysis (b, d: log-rank test).
Extended Data Fig. 6
Extended Data Fig. 6. Activation markers and single-cell phenotypes in lung adenocarcinoma.
a, T-distributed stochastic neighbour embedding (t-SNE) of 108,387 endothelial cells. pSTAT3, Ki-67, CD39 and pERK expression within the endothelial cluster is shown. b, t-SNE plots of 9,480 mast cells, 42,427 neutrophils, 1,407 dendritic cells, 10,000 subsampled CD163- macrophages, 39,502 CD163+ macrophages, 37,653 classical monocytes, 8,330 intermediate monocytes and 17,029 non-classical monocytes. Ki-67, HIF1α, MMP9, ARG1, pERK, MCSFR, PD-1, B7-H3, BCL2, B7-H4, CD40, CC3, CD39, PD-L1 and pSTAT3 expression in the myeloid compartment is shown. c, t-SNE plots of 62,941 B cells, 98,396 Tc, 147,980 TH, 19,839 Treg and 23,995 T other cells. Ki-67, FOXP3, pERK, CD40, CD39, BCL2, PD-1 and pSTAT3 expression in the lymphoid compartment is shown. d-e, Prevalence of Ki-67+ endothelial cells (Comparison between Lepidic and Solid: * P = 0.0362. Comparison between Acinar and Solid: * P = 0.0185) and pERK+ TH cells (Comparison between Lepidic and Solid: **** P = <0.0001. Comparison between Lepidic and Micropapillary: *** P = 0.0004. Comparison between Lepidic and Acinar: *** P = 0.0003. Comparison between Lepidic and Papillary: * P = 0.0102. Comparison between Acinar and Solid: * P = 0.0288) as a proportion of endothelial and TH cells respectively, across histological subgroups in 416 lung adenocarcinoma patients (Lepidic n = 40, Papillary n = 33, Acinar n = 190, Micropapillary n = 35, Solid n = 118). Mean ± SEM. Statistical analysis (d-e: one-way ANOVA with Tukey multiple comparison test).
Extended Data Fig. 7
Extended Data Fig. 7. Variability in 10 cellular neighbourhoods across clinical variables in lung adenocarcinoma.
a, Heatmap of 10 cellular neighbourhoods discovered in 416 lung adenocarcinoma patients. b, Representative images of 10 cellular neighbourhoods using Voronoi diagrams. c, Bubble plot where circle colour indicates which of the two comparisons on the y-axis has higher levels of the cell type on the x-axis (Female n = 233, Male n = 183), age (<75 yo n = 369, ≥75 yo n = 47), BMI (<30 n = 346, ≥30 n = 70), smoking status (Smoker n = 376, Non-smoker n = 38), pack-years (1—30 n = 89, ≥30 n = 256), stage (I-II n = 365, III-IV n = 50), progression status (Progression n = 64, No progression n = 340) and histological subgroup (Lepidic n = 40, Papillary n = 33, Acinar n = 190, Micropapillary n = 35, Solid n = 118). The size of the circle represents the level of significance. Survivallow refers to survival in the context of low (z score <0) prevalence of depicted 10 cellular neighbourhoods. The black boxes depict associations referenced in the text. For exact P values, see Supplementary Table 6. Statistical analysis (a: log-rank test, c: FDR-corrected two-tailed Student t-test for sex, age, BMI, smoking status, pack-years, stage, progression status; one-way ANOVA with Tukey multiple comparison test for histological subgroup; log-rank test for survival).
Extended Data Fig. 8
Extended Data Fig. 8. Heatmaps of 10 cellular neighbourhoods with 3, 5, 20 and 30 closest cells (n) discovered in 416 lung adenocarcinoma patients.
a, Tables depict result of log-rank test of the overall survival for 416 lung adenocarcinoma patients based on low (z score <0) and high (z score ≥0) prevalence. Black p values indicate no significant difference (p ≥ 0.05) in survival between the two groups. Blue p values indicate better survival (p < 0.05) with high prevalence and red p values indicate better survival (p < 0.05) with low prevalence of the depicted groups. b, Kaplan–Meier curves of overall survival for lung adenocarcinoma patients based on low (z score <0) and high (z score ≥0) prevalence of TH cells and high (z score ≥0) prevalence of B cells. c, Correlation of T cell and B cell prevalence. d, Correlation of immune infiltrate and B cell prevalence. Statistical analysis (b: Log-rank test).
Extended Data Fig. 9
Extended Data Fig. 9. Variability in 30 cellular neighbourhoods across clinical variables in lung adenocarcinoma.
a, Bubble plot where circle colour indicates which of the two comparisons on the y-axis has higher levels of the cell type on the x-axis (Female n = 233, Male n = 183), age (<75 yo n = 369, ≥75 yo n = 47), BMI (<30 n = 346, ≥30 n = 70), smoking status (Smoker n = 376, Non-smoker n = 38), pack-years (1-30 n = 89, ≥30 n = 256), stage (I-II n = 365, III-IV n = 50), progression status (Progression n = 64, No progression n = 340) and histological subgroup (Lepidic n = 40, Papillary n = 33, Acinar n = 190, Micropapillary n = 35, Solid n = 118). The size of the circle represents the level of significance. Survivallow refers to survival in the context of low (z score <0) prevalence of depicted 30 cellular neighbourhoods. For exact P values, see Supplementary Table 7. The black boxes depict associations referenced in the text. b, Prevalence of 30 cellular neighbourhoods across 5 histological subtypes (Lepidic n = 40, Papillary n = 33, Acinar n = 190, Micropapillary n = 35, Solid n = 118). Mean ± SEM. Statistical analysis (a: FDR-corrected two-tailed Student t-test for sex, age, BMI, smoking status, pack-years, stage, progression status; one-way ANOVA with Tukey multiple comparison test for histological subgroup; log-rank test for survival).
Extended Data Fig. 10
Extended Data Fig. 10. Machine learning of imaging mass cytometry data improves prediction of progression.
Accuracy of clinical progression prediction in stage I lung adenocarcinoma patients (n = 286) in the a, clinical variables; b, cell frequency; c, lineage markers and d, “all markers” models. Comparison between baseline and the lineage marker model: * P = 0.0343. Comparison between baseline and the “all marker” model : * P = 0.0355. Mean ± SEM. Statistical analysis (a—d: two-tailed Student t-test).

Comment in

References

    1. Leader AM, et al. Single-cell analysis of human non-small cell lung cancer lesions refines tumor classification and patient stratification. Cancer Cell. 2021;39:1594–1609.e12. doi: 10.1016/j.ccell.2021.10.009. - DOI - PMC - PubMed
    1. Melms JC, et al. A molecular single-cell lung atlas of lethal COVID-19. Nature. 2021;595:114–119. doi: 10.1038/s41586-021-03569-1. - DOI - PMC - PubMed
    1. Marjanovic ND, et al. Emergence of a high-plasticity cell state during lung cancer evolution. Cancer Cell. 2020;38:229–246.e13. doi: 10.1016/j.ccell.2020.06.012. - DOI - PMC - PubMed
    1. Zilionis R, et al. Single-cell transcriptomics of human and mouse lung cancers reveals conserved myeloid populations across individuals and species. Immunity. 2019;50:1317–1334.e10. doi: 10.1016/j.immuni.2019.03.009. - DOI - PMC - PubMed
    1. Liu B, et al. Temporal single-cell tracing reveals clonal revival and expansion of precursor exhausted T cells during anti-PD-1 therapy in lung cancer. Nat. Cancer. 2022;3:108–121. doi: 10.1038/s43018-021-00292-8. - DOI - PubMed

Publication types

MeSH terms