. 2023 Feb;614(7948):555-563.
doi: 10.1038/s41586-022-05680-3. Epub 2023 Feb 1.

Single-cell spatial immune landscapes of primary and metastatic brain tumours

Affiliations

Single-cell spatial immune landscapes of primary and metastatic brain tumours

Elham Karimi et al. Nature. 2023 Feb.

Abstract

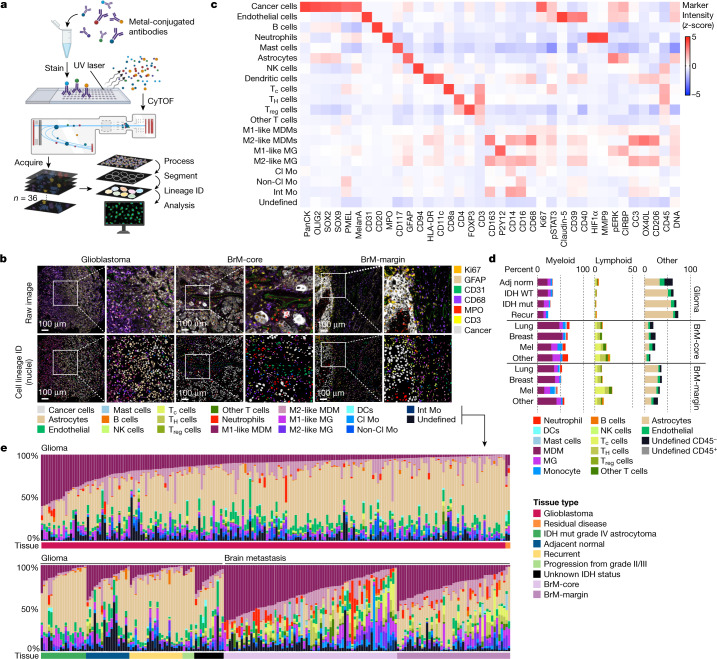
Single-cell technologies have enabled the characterization of the tumour microenvironment at unprecedented depth and have revealed vast cellular diversity among tumour cells and their niche. Anti-tumour immunity relies on cell-cell relationships within the tumour microenvironment1,2, yet many single-cell studies lack spatial context and rely on dissociated tissues3. Here we applied imaging mass cytometry to characterize the immunological landscape of 139 high-grade glioma and 46 brain metastasis tumours from patients. Single-cell analysis of more than 1.1 million cells across 389 high-dimensional histopathology images enabled the spatial resolution of immune lineages and activation states, revealing differences in immune landscapes between primary tumours and brain metastases from diverse solid cancers. These analyses revealed cellular neighbourhoods associated with survival in patients with glioblastoma, which we leveraged to identify a unique population of myeloperoxidase (MPO)-positive macrophages associated with long-term survival. Our findings provide insight into the biology of primary and metastatic brain tumours, reinforcing the value of integrating spatial resolution to single-cell datasets to dissect the microenvironmental contexture of cancer.


Conflict of interest statement

The authors declare no competing interests.

Figures

Fig. 1
Fig. 1. IMC reveals cell dynamics within the brain TME.
a, Schematic of the IMC pipeline applied to glioma and BrM tissue microarrays. Samples were subject to multiplex staining and data were acquired using cytometry by time-of-flight (CyTOF). Cell segmentation and lineage assignment was performed prior to spatial analysis. Created with BioRender.com. b, IMC images from glioblastoma, BrM-core and BrM-margin samples (top) and corresponding lineage assignment (bottom), with magnified regions to the right of each image. The colour codes for IMC markers (top right) and lineage assignment (bottom) are provided (representative of n = 389 images). Scale bars, 100 μm. c, Heat map showing relative average expression of all markers across cell populations identified using IMC (n = 389 images). A subset of markers was specific to the glioma IMC antibody panel (SOX2, SOX9, OLIG2, CD40, CD206; n = 270 images) and a second subset to the BrM IMC antibody panel (pan-cytokeratin, PMEL, MelanA, pERK, CIRBP; n = 119 images). d, Stacked bar graph of the indicated cell types as a percentage of all cells within the TME according to clinical subgroups. Glioma: adjacent normal (adj norm), n = 18; primary isocitrate dehydrogenase (IDH) wild type (WT), n = 192; primary IDH mutant (mut), n = 19; recurrent (recur), n = 22. BrM-core: lung, n = 29; breast, n = 17; melanoma (mel), n = 13; other, n = 13. BrM-margin: lung, n = 22; breast, n = 12; melanoma, n = 6; other, n = 7. Data are mean values; n refers to number of images. e, The distribution of cell populations as a percentage of all cells in the TME, sorted by tissue type. Cell frequencies for each image (n = 389 images) are displayed as vertical bars (colours correspond to cell lineages in b) and the associated tissue type is indicated in the horizontal panels below (colours indicated in the legend, right). Cl Mo, classical monocyte; DC, dendritic cells; Int Mo, intermediate monocyte; MG, microglia; Non-Cl Mo, non-classical monocyte; NK cells, natural killer cells; panCK, pan-cytokeratin; Tc, cytotoxic T cell; TH, T helper; Treg, T regulatory cell; other T cells, CD8CD4 double-negative T cells.
Fig. 2
Fig. 2. Single-cell interaction networks in high-dimensional histopathology images represent clinical subgroups of patients with brain tumours.
a, Cell frequency comparisons between clinical subgroups of patients, corresponding to data in b and Supplementary Fig. 6. Within each row, the bubble colour indicates the clinical subgroup with the higher cell type representation (A term versus B term, right), and the bubble size indicates the P-value. Two-sided Student’s t-test, unpaired unless indicated otherwise; paired analyses are from patient-matched samples. LMD, leptomeningeal disease; Meth, methylated; unmeth, unmethylated; recur, recurrence. b, T cell frequencies as a percentage of total cells across clinical subgroups. Data are mean ± s.e.m.; all data points overlaid; n refers to the number of images. Resect, resection. c, Heat map of pairwise interaction–avoidance scores for glioblastoma (top rows, n = 192 images), BrM-cores (middle rows, n = 59 images) and BrM-margins (bottom rows, n = 40 images). Associations should be read row-to-column. d, Ki67:CC3 ratio in cancer cells interacting with (red; n = 107 cells across 6 images) or avoiding (blue; n = 11,163 cells across 67 images) endothelial cells in glioblastoma. Data are median ± interquartile range; two-sided Mann–Whitney test. e, Ki67:CC3 ratio in MDMs interacting with (red; n = 270 cells across 51 images) or avoiding (blue; n = 2,808 cells across 94 images) endothelial cells in glioblastoma. Data are mean ± s.e.m.; two-sided Student’s t-test. f, Ki67 expression in endothelial cells interacting with (red) or avoiding (blue) cancer cells in BrM-cores. Data are mean ± s.e.m.; n = 347 cells across 61 images per group; two-sided Student’s t-test. g, Ki67 expression in endothelial cells interacting with (red) or avoiding (blue) cancer cells in BrM-margins. Data are mean ± s.e.m.; n = 156 cells across 45 images per group; two-sided Student’s t-test. h, Ki67 expression in endothelial cells interacting with (red) or avoiding (blue) Tc cells in BrM-cores. Data are mean ± s.e.m.; n = 235 cells across 41 images per group; two-sided Student’s t-test. In dh, images with zero cells of interest or lacking pairwise interactions of interest were excluded from analysis.
Fig. 3
Fig. 3. Spatial cellular neighbourhoods relate to survival in glioblastoma.
a, Schematic of cellular neighbourhood (CN) assignments. CNs are projected as a Voronoi diagram (right). b, Heat map of cell types represented across 9 CNs discovered in glioblastoma and BrM-cores (n = 251 images; N = 10 nearest neighbours, CN = 9 neighbourhoods). c, The distribution of CNs across glioblastoma (n = 192 images) and BrM-cores (n = 59 images). For each image, the percentage of cells from each CN was determined and then averaged for each disease type. di, Analysis of a controlled glioblastoma cohort of LTS (overall survival >3 years) and STS (overall survival <1 year) (see Extended Data Fig. 9f). d, The distribution of CNs in the LTS and STS glioblastoma cohort. CN frequencies were averaged where there were multiple samples from the same patient. Data are median ± interquartile range; n = 16 patients per group; two-sided Mann–Whitney test. e, Kaplan–Meier analysis of the LTS and STS glioblastoma cohort based on the median CN frequency. CN frequencies were averaged where there were multiple samples from the same patient. Log-rank (Mantel–Cox) test; n = 16 patients per group. f, t-SNE unsupervised clustering of macrophages and monocytes from all glioblastoma images (n = 93,513 cells across 192 images). g, t-SNE projection of monocytes and macrophages from patients with glioblastoma, with cells in clusters CL1–3 outlined in red. LTS, n = 17,752 cells across 32 images; STS, n = 10,456 cells across 28 images. h, Relative expression of functional markers (left) and the distribution of cell types (right) across 15 monocyte and macrophage clusters (CL1–15). i, The number of cells from CL1–3 found within each cellular neighbourhood in the LTS and STS glioblastoma cohort.
Fig. 4
Fig. 4. MPO+ macrophages are enriched in LTS tumours and are associated with enhanced cytotoxic functions.
a, Heat map of MPO expression projected onto a t-SNE map (Fig. 3f) of monocytes and macrophages from patients with glioblastoma (n = 93,513 cells across 192 images). b, Representative immunohistofluorescence (IHF) images showing MPO and IBA1 (a macrophage marker) co-localization in glioblastoma tumours. Expanded regions show examples of MPO+ macrophages (n = 5 images). c, Ingenuity pathway analysis of enriched pathways in MPO+ versus MPO macrophages from three publicly available datasets. d, HIF1α expression projected onto a t-SNE map of monocytes and macrophages from patients with glioblastoma (n = 93,513 cells across 192 images). e, The number of cells per 1 mm2 core in glioblastoma samples with zero (n = 32 images), low (n = 79 images) or high (n = 81 images) MPO+ M1-like MDMs. The graph shows mean values (black horizontal line) and all data points; one-way ANOVA; data are presented in log scale, so images with 0 cells were assigned a value of 1. f, The raw number of cells in each cellular neighbourhood per 1 mm2 core from patients with glioblastoma with zero (n = 32 images), low (n = 79 images) or high (n = 81 images) numbers of MPO+ M1-like MDMs. The graph shows mean values (black horizontal line) and all data points; one-way ANOVA; images with 0 cells were assigned a value of 1. g, Pairwise interactions across two-sided permutation tests on individual images (1,000 permutations each) for patients with zero, low or high numbers of MPO+ M1-like MDMs. Red, interactions (interact); blue, avoidances (avoid). h, Kaplan–Meier analysis based on MPO+IBA1+ cell frequency as determined by IHF staining in 135 tumours from patients with glioblastoma (z-score). Cell frequencies were averaged when multiple samples corresponded to the same individual. Log-rank (Mantel–Cox) test.
Extended Data Fig. 1
Extended Data Fig. 1. Study cohort and cell lineage assignment.
a, Summary of patient samples. Patients underwent surgical resection and tumours were classified by a neuropathologist (M.C.G.). Gliomas were classified as: primary (first surgical resection), residual (second surgery to remove any remaining tumour), recurrent (surgical resection after tumour recurrence), or progression from grade II/III (resection of grade IV tumour that progressed from low grade glioma). Glioma samples were extracted from the tumour bulk or the tumour-adjacent normal. Brain metastasis samples were extracted from the tumour bulk (core) or the tumour/brain interface (margin). All clinical information was obtained from surgical and pathological reports. Number of cells acquired corresponds to the total number of cells segmented across all images. b, Schematic for cell lineage assignment strategy. Created with BioRender.com.
Extended Data Fig. 2
Extended Data Fig. 2. Cellular dynamics in primary & metastatic brain tumours.
a, Cell frequencies as a percentage of all TME cells in glioblastoma (n = 192 images), BrM-cores (n = 72 images) and BrM-margins (n = 47 images). Data are mean ± s.e.m.; two-way ANOVA; significant adjusted P-values are highlighted. b, Left: number of cells/image for each cell type in glioblastoma (n = 192 images), BrM-cores (n = 72 images) and BrM-margins (n = 47 images); data are mean ± s.e.m. Right: absolute number of cells (total across all images) in glioblastoma (n = 192 images), BrM-core (n = 72 images) and BrM-margin (n = 47 images).
Extended Data Fig. 3
Extended Data Fig. 3. Representative staining of control tissues and brain tumours.
a, Representative IMC images of expected co-staining patterns in tonsil, spleen or tumour margins. Blue, DNA (191Ir and 193Ir). b, Representative IMC images of major lineage markers (left, centre) and corresponding cell segmentation and lineage assignment (right). The colour code for the cell segmentation image is provided (right).
Extended Data Fig. 4
Extended Data Fig. 4. Single-cell frequencies correlate with clinical subgroups in patients with brain tumours.
a, Cell density comparisons between clinical subgroups of patients, corresponding to Supplementary Fig. 8. Within each row, bubble colour indicates the clinical subgroup (A term versus B term, right) with higher cell type representation; bubble size indicates P-value. Two-sided student’s t test, unpaired unless indicated otherwise; paired analyses are from patient-matched samples. b, Cell frequencies as a percentage of total cells per image in glioblastoma tumours with low T cells (<5% of TME, n = 144 images) versus high T cells (>5% of TME, n = 13 images). Data are mean ± s.e.m.; two-sided student’s t test. c, Mean overall survival time of glioblastoma patients (for whom this information was available) with low T cells (<5% of TME, n = 142 images) versus high T cells (>5% of TME, n = 13 images). Data are mean ± s.e.m.; two-sided student’s t test.
Extended Data Fig. 5
Extended Data Fig. 5. Cellular interactions in primary versus metastatic brain tumours.
a, Avoidance scores corresponding to Fig. 2c for cancer cell interactions with non-cancer lineages in glioblastoma (n = 192 images) and BrM-cores (n = 59 images). Data are mean ± s.e.m.; two-sided student’s t test. b, Statistical significance of cellular interaction/avoidance scores in glioblastoma (n = 192 images) and BrM-cores (n = 59 images) corresponding to Fig. 2c. P-values calculated by two-sided student’s t test. Colours indicate significantly greater interaction (red) or avoidance (blue) in BrM versus glioblastoma (upper table) or glioblastoma versus BrM (lower table).
Extended Data Fig. 6
Extended Data Fig. 6. Single-cell spatial interactions in patients with brain tumours.
a, IMC images of interacting cells in the perivascular niche of glioblastoma and BrM samples, representative of analysis in Fig. 2d–g. First row, perivascular cancer cell proliferation in glioblastoma; second row, perivascular macrophage proliferation in glioblastoma; third row, peritumoural endothelial proliferation in BrM-cores; fourth row, peritumoural endothelial proliferation in BrM-margins. High-magnification insets are provided to the right of each image. b, Heatmap of Spearman’s correlation between cell types in glioblastoma (top rows, n = 192 images), BrM-cores (middle rows, n = 59 images) and BrM-margins (bottom rows, n = 40 images). Red, positive correlation; blue, negative correlation. c, Frequency of CD40+ MDMs and CD40- MDMs interacting with Th. Data are mean ± s.e.m.; n = 1,048 cells across 74 images; two-sided student’s t test. d, CD40 in M1-like MDMs interacting with (red) or avoiding (blue) endothelial cells in glioblastoma. Data are mean ± s.e.m.; n = 415 cells across 188 images/group; two-sided student’s t test. e, Ox40L in M2-like MDMs interacting with (red) or avoiding (blue) endothelial cells in glioblastoma. Data are mean ± s.e.m.; n = 4,248 cells across 183 images/group; Two-sided student’s t test. f, Ki67 in endothelial cells interacting with (red) or avoiding (blue) Tc cells in BrM-margins. Data are mean ± s.e.m.; n = 98 cells across 28 images; two-sided student’s t test. g, Claudin-5 in endothelial cells interacting with (red) or avoiding (blue) cancer cells in BrM-cores and -margins. Data are mean ± s.e.m.; BrM-cores, n = 1,503 cells across 61 images; BrM-margins, n = 1507 cells across 45 images; two-sided student’s t test. h, Claudin-5 expression in endothelial cells interacting with (red) or avoiding (blue) cancer cells in BrM-cores subdivided by extent of peritumoural edema. Data are mean ± s.e.m.; none/low edema, n = 369 cells across 13 images; moderate/high edema, n = 1,046 cells across 42 images; two-sided student’s t test. All images lacking pairwise interactions of interest were excluded from analysis.
Extended Data Fig. 7
Extended Data Fig. 7. Survival associations of spatial cellular neighbourhoods in glioblastoma.
Heatmaps depicting the cellular composition of glioblastoma cellular neighbourhoods (CN), with N = 3, 5, 10, 20 or 30 nearest neighbours and CN = 9 neighbourhoods. Tables show P-values of survival analyses (Log-rank (Mantel-Cox) test) for samples based on median CN frequency. CNs enriched in M1-like MDM that are significantly associated with survival are highlighted in grey. CN frequencies were averaged when multiple samples corresponded to the same patient.
Extended Data Fig. 8
Extended Data Fig. 8. M1-like MDM enriched cellular neighbourhoods are associated with survival in glioblastoma.
a, Heatmap depicting the cellular composition of glioblastoma cellular neighbourhoods (CN), with N = 10 nearest neighbours and CN = 30 neighbourhoods (n = 192 images). 6 CNs are enriched with >3000 M1-like MDM (grey highlight; number of M1-like MDM in each CN is indicated). Of these, 2 (red text) are associated with prolonged survival. Table shows P-values of survival analyses (Log-rank (Mantel-Cox) test) for samples based on median CN frequency. CN frequencies were averaged when multiple samples corresponded to the same patient. b, Cell frequency correlation graphs of neutrophils, M1-like MDM and M1-like MG. Linear regression with 95% confidence interval is shown.
Extended Data Fig. 9
Extended Data Fig. 9. The spatial cellular neighbourhoods of glioblastoma and brain metastases.
a, Representative Voronoi diagrams of CNs mapped onto glioblastoma IMC images. b, Representative Voronoi diagrams of CNs mapped onto BrM-core IMC images. c, Kaplan-Meier analysis of BrM patients (lung, melanoma and breast primaries) based on median CN5 frequency in BrM-cores. CN frequencies were averaged when multiple samples corresponded to the same patient. Log-rank (Mantel-Cox) test, n = 13 patients/group. d, CD45 expression in undefined cells across glioblastoma and BrM samples (n = 389 images). e, Distribution of CNs across BrM samples. BrM-margins: melanoma n = 6 images, lung n = 22 images, breast n = 12 images; BrM-cores: melanoma n = 13 images, lung n = 29 images, breast n = 17 images. For each image, the percentage of cells from each CN was determined, then averaged for each group. f, Schematic of the glioblastoma LTS/STS cohort and inclusion/exclusion criteria, pertaining to Supplementary Table 2. Created with BioRender.com. g, Kaplan-Meier analysis of glioblastoma LTS/STS cohort based on median CN frequency. CN frequencies were averaged when multiple samples corresponded to the same patient. Log-rank (Mantel-Cox) test, n = 16 patients/group.
Extended Data Fig. 10
Extended Data Fig. 10. MPO+ macrophages are associated with enhanced cytotoxic functions.
a, Pie chart depicting the distribution of macrophage subsets within the total pool of MPO+ CD68+ macrophages in glioblastoma (n = 192 images). Percentages reflect the proportion of total MPO+ CD68+ cells. b, Representative IMC images of MPO+ MDMs in two glioblastoma samples. c, Normalized expression of MPO in glioblastoma and BrM immune cell subsets via RNA-seq (data from ref. ). Data are mean ± s.e.m.; n-values depicted indicate number of patients. d, Normalized expression of MPO in human blood immune cell subsets via RNA-seq (data from ref. ). e, Heatmap displaying the top 50 differentially expressed genes in MPO+ versus MPO- macrophages that were common to three independent publicly available glioblastoma scRNA-seq datasets (data from refs. ). f, Pairwise interaction/avoidance scores using two-sided permutation tests on individual images (1,000 permutations each) between endothelial cells and MPO+ versus MPO- M1-like MDMs (n = 192 images). Colour indicates interaction (red) or avoidance (blue) and circle size reflects the magnitude of the interaction score. g, Representative immunohistofluorescence images of MPO (green) and IBA1 (red; macrophage marker) co-localization in glioblastoma tumours. Examples of MPO+ IBA1+ macrophages are shown in insets, along with MPO+ IBA1- neutrophils or MPO- IBA1+ macrophages (n = 5 images). h, Pairwise interaction/avoidance scores using two-sided permutation tests on individual images (1,000 permutations each) for MPO+ M1-like MDM with other cell types (n = 192 images); interaction (red), avoidance (blue). i, Kaplan-Meier analysis of glioblastoma LTS/STS cohort based on median MPO+CD163-P2Y12-CD68+ macrophage enrichment. Cell frequencies were averaged when multiple samples corresponded to the same patient. Log-rank (Mantel-Cox) test, n = 16 patients/group. j, Frequency of MPO+ M1-like MDM as a percentage of total cells in the glioblastoma LTS/STS cohort (n = 16 patients/group) and recurrent glioblastoma (n = 10 patients). Frequencies were averaged when multiple samples corresponded to the same patient. Data are median ± interquartile range; two-sided Mann-Whitney test.

Comment in

References

    1. Quail DF, Joyce JA. Microenvironmental regulation of tumor progression and metastasis. Nat. Med. 2013;19:1423–1437. doi: 10.1038/nm.3394. - DOI - PMC - PubMed
    1. Binnewies M, et al. Understanding the tumor immune microenvironment (TIME) for effective therapy. Nat. Med. 2018;24:541–550. doi: 10.1038/s41591-018-0014-x. - DOI - PMC - PubMed
    1. Baslan T, Hicks J. Unravelling biology and shifting paradigms in cancer with single-cell sequencing. Nat. Rev. Cancer. 2017;17:557–569. doi: 10.1038/nrc.2017.58. - DOI - PubMed
    1. Ostrom QT, et al. CBTRUS statistical report: primary brain and other central nervous system tumors diagnosed in the United States in 2010–2014. Neuro Oncol. 2017;19:v1–v88. doi: 10.1093/neuonc/nox158. - DOI - PMC - PubMed
    1. Barnholtz-Sloan JS, et al. Incidence proportions of brain metastases in patients diagnosed (1973 to 2001) in the Metropolitan Detroit Cancer Surveillance System. J. Clin. Oncol. 2004;22:2865–2872. doi: 10.1200/JCO.2004.12.149. - DOI - PubMed

Publication types

Substances