. 2023 Feb;614(7946):48-53.
doi: 10.1038/s41586-022-05478-3. Epub 2023 Feb 1.

Measurement of the axial vector form factor from antineutrino-proton scattering

Affiliations

Measurement of the axial vector form factor from antineutrino-proton scattering

T Cai et al. Nature. 2023 Feb.

Abstract

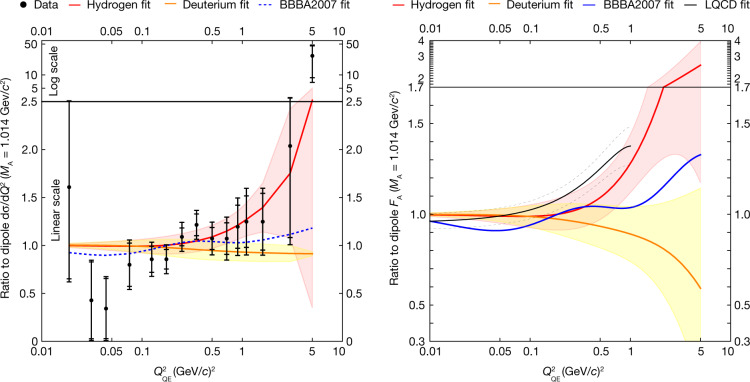
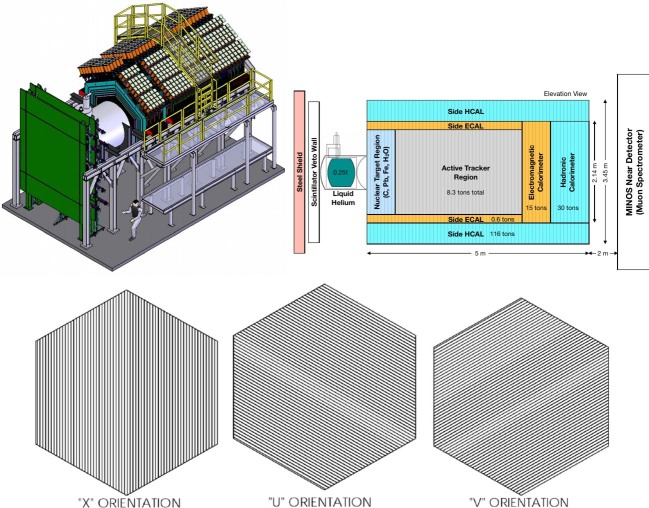
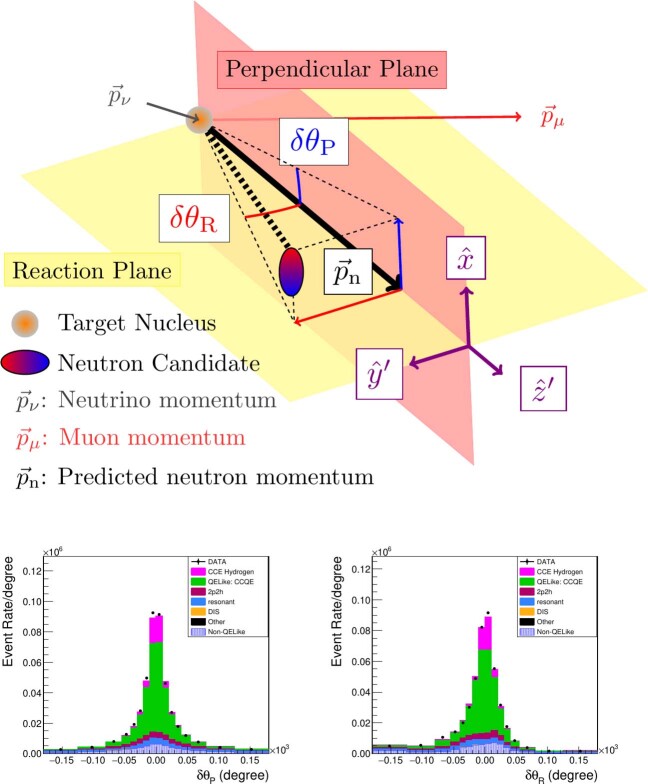
Scattering of high energy particles from nucleons probes their structure, as was done in the experiments that established the non-zero size of the proton using electron beams1. The use of charged leptons as scattering probes enables measuring the distribution of electric charges, which is encoded in the vector form factors of the nucleon2. Scattering weakly interacting neutrinos gives the opportunity to measure both vector and axial vector form factors of the nucleon, providing an additional, complementary probe of their structure. The nucleon transition axial form factor, FA, can be measured from neutrino scattering from free nucleons, νμn → μ-p and [Formula: see text], as a function of the negative four-momentum transfer squared (Q2). Up to now, FA(Q2) has been extracted from the bound nucleons in neutrino-deuterium scattering3-9, which requires uncertain nuclear corrections10. Here we report the first high-statistics measurement, to our knowledge, of the [Formula: see text] cross-section from the hydrogen atom, using the plastic scintillator target of the MINERvA11 experiment, extracting FA from free proton targets and measuring the nucleon axial charge radius, rA, to be 0.73 ± 0.17 fm. The antineutrino-hydrogen scattering presented here can access the axial form factor without the need for nuclear theory corrections, and enables direct comparisons with the increasingly precise lattice quantum chromodynamics computations12-15. Finally, the tools developed for this analysis and the result presented are substantial advancements in our capabilities to understand the nucleon structure in the weak sector, and also help the current and future neutrino oscillation experiments16-20 to better constrain neutrino interaction models.


Conflict of interest statement

The authors declare no competing interests.

Figures

Fig. 1
Fig. 1. Data rate and the predicted fractional interaction types in the angular plane.
Left, Data event rate in δθPδθR plane. The visible bins in positive δθP are representative of the event rate as the event rate is nearly symmetrical in δθP. Right, The projected Monte Carlo event fraction in different angular regions. CCE hydrogen (pink), QELike CCQE carbon (green), QELike other (2p2h, resonant, yellow and the non-QELike background (grey) all appear in the event selection. The CCE signal region is between −10° < δθR/δθP < 10°. Control regions are defined to measure events in regions where QE contributions, non-QE contributions and a mixture of non-QE and meson events are dominant. Two validation regions for the QE and non-QE contributions are defined to assess the background estimations. The background levels shown are constrained by the fit to the data as described in the text.
Fig. 2
Fig. 2. Fitted event distribution and ratio in the signal region.
Event rate (left) and ratio to the post-fit model (right). The vertical error bars around the data points and the error band around the model prediction account for statistical uncertainty (stat. unc.) based on the standard deviation of a Poisson distribution. Note that the (0,0.0125) (GeV/c)2 and (6.0,10) (GeV/c)2 bins are not reported due to low statistics. DIS refers to deep inelastic scattering.
Fig. 3
Fig. 3. Fitted event distributions and ratios in the control regions.
Fitted event distribution in the calculated Q2 (QQE2) bins in the QELike sample in the QE, non-QE, as well as non-QE and mesons, regions. Top, event rate per bin; Bottom, ratio to post-fit model. The vertical error bars around the data points and the error band around the model prediction account for 1 standard deviation due to large statistical uncertainties.
Fig. 4
Fig. 4. Ratios of data and fitted axial vector form factor to a dipole model.
Left, ratios of cross-sections to dipole cross-section with MA = 1.014 GeV/c2. The inner error bars on the data points account for 1 standard deviation due to statistical uncertainty only, and the full error bars include all sources of systematic uncertainties. Right, ratios to the dipole form factor. The hydrogen (this work) and deuterium FA fits use the z expansion formalism; BBBA2007 (ref. ) uses a different empirical fit to deuterium and π-electroproduction data; whereas LQCD is a recent fit to lattice QCD calculations.
Extended Data Fig. 1
Extended Data Fig. 1. Illustration of MINERvA detector.
A 3D illustration of the MINERvA detector (left), a flat cross-sectional portrayal (reproduced from ref ., right). The detector comprises 120 hexagonal modules, each consists of an Inner Detector (ID), side Electromagnetic Calorimeter (ECAL), and side Hadronic Calorimeter (HCAL) arranged outwards from the center. Horizontally along the beam direction in the ID region are four sub-detectors: nuclear target detector, active scintillator detector, the ECAL and the HCAL. Each scintillator plane in the detector is arranged in one of “X”, “U”, or “V” (bottom) orientations. A liquid helium tank is located upstream of the nuclear target detector. Downstream of the MINERvA detector is the magnetized MINOS near detector acting as MINERvA’s muon spectrometer.
Extended Data Fig. 2
Extended Data Fig. 2. Definition of δθP and δθR, and the event distributions.
(top) Angular variable definitions. The variables δθR and δθP are defined according to the rotated reference frame ((xˆ,yˆ,zˆ). Distributions of (bottom left) δθP and (bottom right) δθR in the QELike sample normalized to bin width, after sideband fits. The vertical error bars around the data points represent 1 standard deviation due to statistical uncertainty.
Extended Data Fig. 3
Extended Data Fig. 3. Simulated event rate in δθP − δθR plane in selected Q2 analysis bins.
Heat map showing Monte Carlo event rate for CCE, CCQE, QELike 2p2h, and QELike Resonant interaction models in the δθR-δθP plane at a few slices of Q2. CCE events are concentrated around origin, while the CCQE events have broader spread. Both QELike 2p2h and resonant events show diffused structure going out to larger δθR and δθP regions. The color scales in the heat maps are different because of different event rates for each subsample.
Extended Data Fig. 4
Extended Data Fig. 4. Post-fit event rates and ratios in the validation regions.
The “Non-QE validation” region is shown separated into two sub-regions. “Non-QE Val. 1” spans ∣δθP∣ < 20°, “Non-QE Val. 2” occupies 20° < ∣δθP∣ < 55°. The vertical error bars around the data points and the error band around the model prediction account for 1 standard deviation due to statistical uncertainty. The CCE signal and the regions used in the background fits are shown in Figs. 2 and 3, respectively.
Extended Data Fig. 5
Extended Data Fig. 5. Background constraint method tested on a neutrino sample.
(Top left) Signal and (top right) QE region distributions of the neutrino sample that looks for proton final states after fit. The vertical error bars around the data points and the error band around the model prediction account for 1 standard deviation due to statistical and systematic uncertainties. (Bottom) Application of ± 100% shift in 2p2h (gray band) on δθR for events in a − 10° < δθP < 10° and 0.2 (GeV/c)2 < Q2 < 0.4 (GeV/c)2 slice. The analog to the CCE selection selects between − 10° and 10° in δθR.
Extended Data Fig. 6
Extended Data Fig. 6. Signal event selection efficiency.
CCE signal efficiency as a function of Q2. The inner error bar on each data point accounts for the statistical effect of a Poisson standard deviation, while the full error bar account for all sources of systematic uncertainties.
Extended Data Fig. 7
Extended Data Fig. 7. Fractional uncertainties.
Fractional statistical and systematic uncertainties, as a function of Q2 uncertainties. Systematic uncertainties in the “other” category, including the neutron and proton interaction uncertainties, are shown on the right. The neutron interaction systematic accounts for the neutron secondary interaction uncertainties in detector. The leading interaction channels, such as (nC, Bnp),(nC, 3α), and (nC,nCγ), are assigned 10% to 15% uncertainties below a kinetic energy of 100 MeV.
Extended Data Fig. 8
Extended Data Fig. 8. Cross section and the Q2-dependent flux cut.
(left) Measured cross-section and theory predictions, (right) Regions of neutrino energy and flux in signal selection at each Q2. The inner error bars on the data points account for 1 standard deviation due to statistical uncertainty only, and the full error bars include contribution from all sources of systematic uncertainties.

References

    1. Chambers EE, Hofstadter R. Structure of the proton. Phys. Rev. 1956;103:1454–1463. doi: 10.1103/PhysRev.103.1454. - DOI
    1. Ernst FJ, Sachs RG, Wali KC. Electromagnetic form factors of the nucleon. Phys. Rev. 1960;119:1105–1114. doi: 10.1103/PhysRev.119.1105. - DOI
    1. Mann WA, et al. Study of the reaction ν + n → μ− + p. Phys. Rev. Lett. 1973;31:844–847. doi: 10.1103/PhysRevLett.31.844. - DOI
    1. Barish SJ, et al. Study of neutrino interactions in hydrogen and deuterium. Description of the experiment and study of the reaction neutrino ν + d → μ− + p + ps. Phys. Rev. D. 1977;16:3103. doi: 10.1103/PhysRevD.16.3103. - DOI
    1. Baker NJ, et al. Quasielastic neutrino scattering: a measurement of the weak nucleon axial vector form-factor. Phys. Rev. D. 1981;23:2499–2505. doi: 10.1103/PhysRevD.23.2499. - DOI

Publication types

LinkOut - more resources