. 2023 Feb 1;14(1):542.
doi: 10.1038/s41467-023-35974-7.

Evidence of a causal effect of genetic tendency to gain muscle mass on uterine leiomyomata

Collaborators, Affiliations

Evidence of a causal effect of genetic tendency to gain muscle mass on uterine leiomyomata

Eeva Sliz et al. Nat Commun. .

Abstract

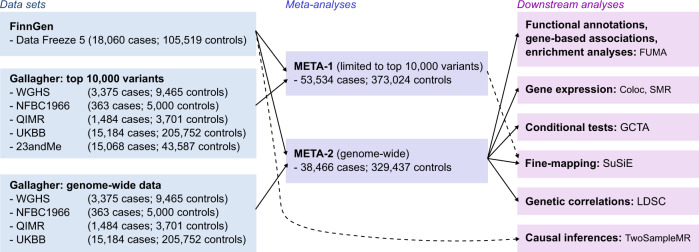
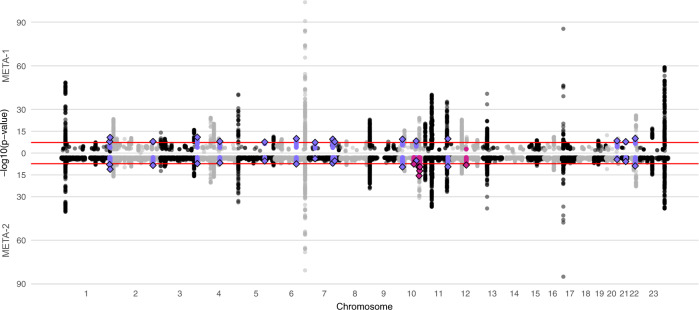
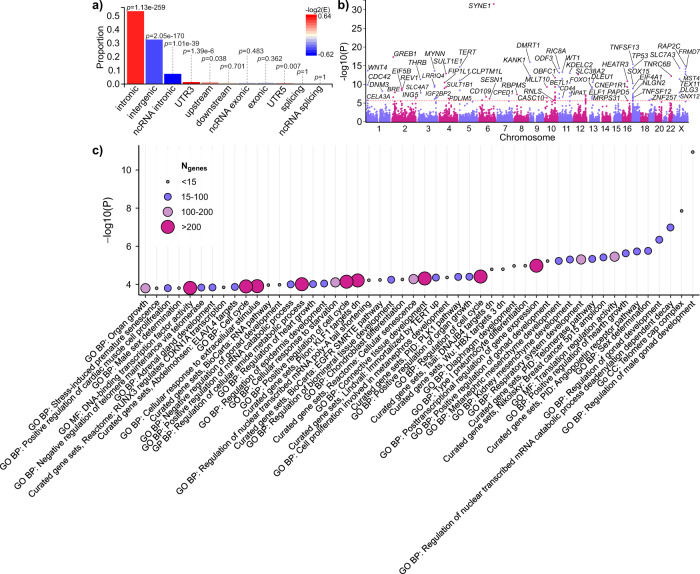
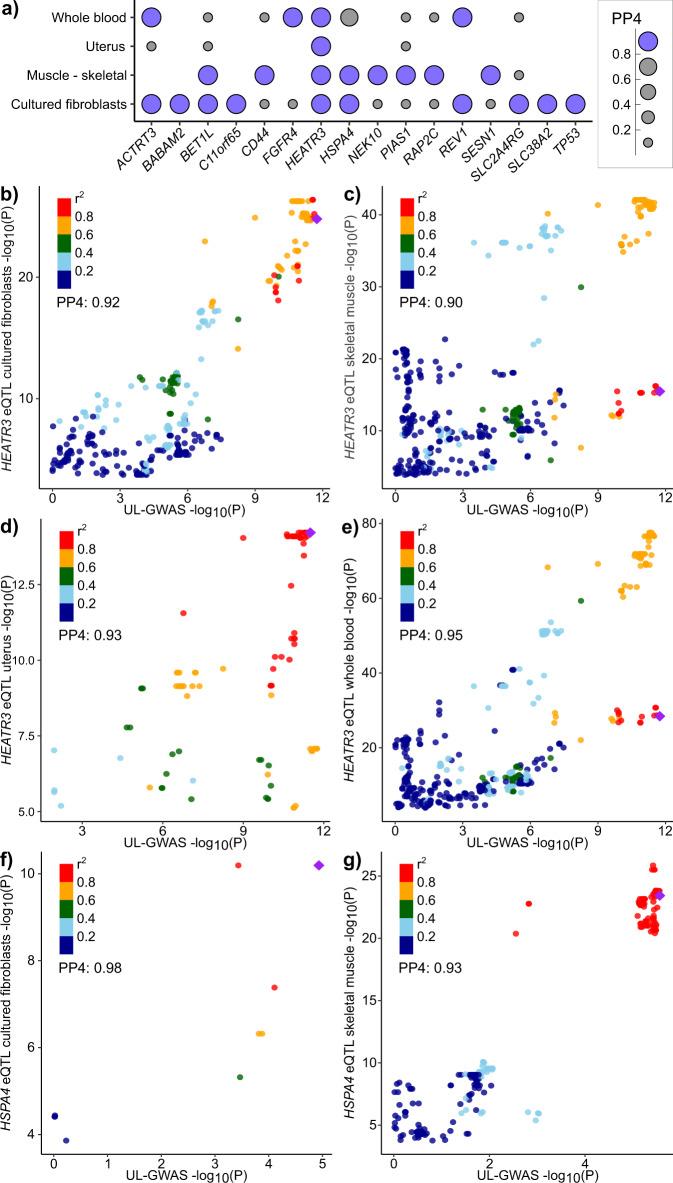
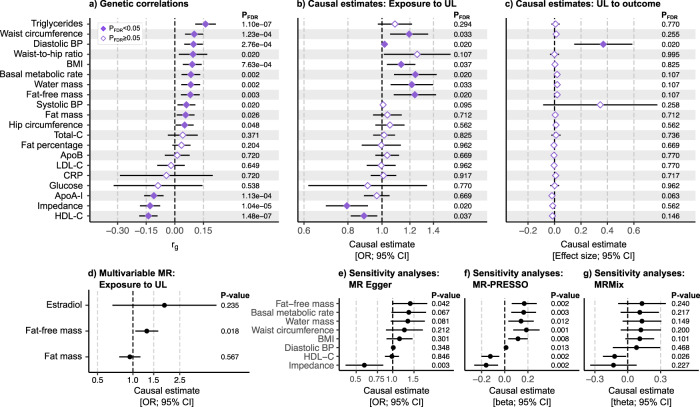
Uterine leiomyomata (UL) are the most common tumours of the female genital tract and the primary cause of surgical removal of the uterus. Genetic factors contribute to UL susceptibility. To add understanding to the heritable genetic risk factors, we conduct a genome-wide association study (GWAS) of UL in up to 426,558 European women from FinnGen and a previous UL meta-GWAS. In addition to the 50 known UL loci, we identify 22 loci that have not been associated with UL in prior studies. UL-associated loci harbour genes enriched for development, growth, and cellular senescence. Of particular interest are the smooth muscle cell differentiation and proliferation-regulating genes functioning on the myocardin-cyclin dependent kinase inhibitor 1 A pathway. Our results further suggest that genetic predisposition to increased fat-free mass may be causally related to higher UL risk, underscoring the involvement of altered muscle tissue biology in UL pathophysiology. Overall, our findings add to the understanding of the genetic pathways underlying UL, which may aid in developing novel therapeutics.


Conflict of interest statement

K.T.Z.: Competing financial interests: Scientific collaborations (grant funding) with Bayer AG, Roche Diagnostics Inc, MDNA Life Sciences, and Evotec. Competing non-financial interests: Board memberships of the World Endometriosis Society, World Endometriosis Research Foundation, and research advisory committee member of Wellbeing of Women UK. CMB: Competing financial interests: Scientific collaborations (grant funding) with Bayer AG, Roche Diagnostics Inc, MDNA Life Sciences, and Evotec. Scientific board Myovant; IDDM Member ObsEva. Competing non-financial interests: Chair ESHRE Endometriosis Guideline Development Group. The remaining authors declare no competing interests.

Figures

Fig. 1
Fig. 1. Study setting.
The flow diagram illustrates the data usage and analytical steps of our study. We conducted a GWAS of uterine leiomyomata (UL) in 18,060 cases and 150,519 female controls from the FinnGen project. Subsequently, we meta-analysed the FinnGen-based results with summary statistics from a previous UL meta-GWAS. META-1 included 53,534 cases and 373,024 female controls and was restricted to the top 10,000 variants from the previous study. META-2 was conducted genome-widely in 38,466 cases and 329,437 female controls, excluding 23andMe data due to the data usage policy. Downstream analyses assessing functional annotations, gene-based associations, pathway enrichment, conditional association tests, fine-mapping, and genetic correlations were conducted using genome-wide summary statistics from META-2. In addition, fine-mapping was also conducted for the results of META-1. In Mendelian randomisation analyses evaluating causal inferences between UL and other, mostly UKBB-based traits, we extracted instruments for UL from the FinnGen-based summary statistics to avoid possible bias from overlapping UKBB samples.
Fig. 2
Fig. 2. A combined Manhattan plot of uterine leiomyomata (UL) associations in two sets of meta-analyses.
We conducted UL GWAS in FinnGen and, subsequently, two sets of meta-analyses with data from a previously published UL meta-analysis: META-1 (top) was limited to the top 10,000 most significant variants from the previous study, and included up to 53,534 UL cases and 373,024 female controls whereas META-2 (bottom) was conducted genome-widely in 38,466 UL cases and 329,437 female controls. The purple colour denotes UL risk loci identified in META-1 that have not been described in prior studies, and the pink color indicates loci identified in META-2 that were not associated previously with UL risk in prior GWASs or META-1. Black and grey colours indicate odd and even chromosome numbers, respectively. The red dashed lines correspond to the threshold for genome-wide significance (p < 5 × 10−8).
Fig. 3
Fig. 3. Variant summary and gene set-based results using genome-wide summary statistics from META-2.
a The proportions of ‘independent genome-wide significant variants’ and ‘variants in LD with independent significant variants’ having corresponding functional annotation. Bars are coloured according to −log2(enrichment) relative to all variants in the reference panel. P values are obtained using Fisher’s exact test (two-sided). b A Manhattan plot of the gene-based test computed by MAGMA. The input variants were mapped to 19,920 protein-coding genes and, thus, significance was considered at p < 2.51 × 10−6 (0.05/19,920). Purple and pink colours indicate odd and even chromosome numbers, respectively. Thirty-seven gene symbols are omitted. c MAGMA gene-set enrichment analysis was performed for curated gene sets and GO terms available at MsigDB. The plot shows the results for significantly enriched pathways (pFDR < 0.05). All data plotted in Fig. 3a–c were produced using FUMA.
Fig. 4
Fig. 4. Colocalizations between UL-GWAS signals and eQTL signals.
We estimated approximate Bayes factor colocalizations of UL association signals from META-2 and gene expression in GTEx v8 (cultured fibroblasts, skeletal muscle, uterus, and whole blood) using coloc.abf function from the coloc R library. Altogether 92 genes, including the genes closest to the association lead variant at each UL-associated locus and biologically plausible candidate genes, when different from the closest genes, were included in the analysis (Table S2). The figure illustrates a all genes, the expression of which colocalizes with UL signal (posterior probability for a single causal variant [PP4] >0.8) in at least one of the studied tissues, as well as colocalization signals for HEATR3 in b cultured fibroblasts, c skeletal muscle, d uterus, and e whole blood, and for HSPA4 in f cultured fibroblasts, and g skeletal muscle.
Fig. 5
Fig. 5. Genetic correlations and causal relationships between uterine leiomyomata and metabolic and anthropometric traits.
We estimated a genetic correlations (rg) between uterine leiomyomata (UL) and 20 metabolic and anthropometric traits using UL-GWAS data from META-2 (n = 367,903) and summary statistics for other traits as provided by the MRC Integrative Epidemiology Unit (IEU) GWAS database (n ranges from 33,231 to 757,601; the trait-specific sample sizes are provided in Table S11). The analysis software was LDSC. To dissect the causal relationships, we performed bi-directional two-sample Mendelian randomisation (MR) implemented in the TwoSampleMR R library,; the plots (b, c) show the causal estimates obtained using the inverse variance-weighted (IVW) method. We further estimated d the multivariable effects of whole-body fat-free mass, whole-body fat mass, and estradiol level on UL risk using the same TwoSampleMR R library,. In sensitivity analyses, we derived causal estimates using e MR Egger (as implemented in TwoSampleMR), f outlier-corrected MR-PRESSO, and g MRMix methods for the traits showing a significant IVW-based causal effect on UL. For all MR analyses, genetic instruments for UL were extracted from the GWAS completed in FinnGen (n = 123,579) and for other, mostly UKBB-based, traits from the MRC IEU GWAS database (n ranges from 33,231 to 757,601; Table S11) except for estradiol, for which the instruments were extracted from a study by ref. . (n = 206,927). In all Mendelian randomisation analyses, LD pruning was completed using a European population reference, the threshold of r2 = 0.001, and a clumping window of 10 kb. False discovery rate (FDR)-corrected p values <0.05 were considered significant in primary analyses (ac). Multivariable MR and sensitivity analyses (dg) were considered exploratory, and no multiple testing correction was applied. The error bars represent the corresponding 95% confidence intervals (CI). Numerical details are provided in Tables S12–S15, and scatter plots and the results of the leave-one-out analyses are shown in Figs. S25, 26 and S28–35, respectively.

References

    1. Baird DD, Dunson DB, Hill MC, Cousins D, Schectman JM. High cumulative incidence of uterine leiomyoma in black and white women: Ultrasound evidence. Am. J. Obstet. Gynecol. 2003;188:100–107. - PubMed
    1. Walker CL, Stewart EA. Uterine fibroids: the elephant in the room. Science. 2005;308:1589–1592. - PubMed
    1. Stewart, E. A. et al. Uterine fibroids. Nat. Rev. Dis. Prim. 2, 16043 (2016). - PubMed
    1. Mäkinen N, et al. MED12, the mediator complex subunit 12 gene, is mutated at high frequency in uterine leiomyomas. Science. 2011;334:252–255. - PubMed
    1. Luoto R, et al. Heritability and risk factors of uterine fibroids - The Finnish Twin Cohort Study. Maturitas. 2000;37:15–26. - PubMed

Publication types