. 2023 Feb 1;21(1):19.
doi: 10.1186/s12915-023-01519-z.

Integrative single-cell RNA-seq and ATAC-seq analysis of myogenic differentiation in pig

Affiliations

Integrative single-cell RNA-seq and ATAC-seq analysis of myogenic differentiation in pig

Shufang Cai et al. BMC Biol. .

Abstract

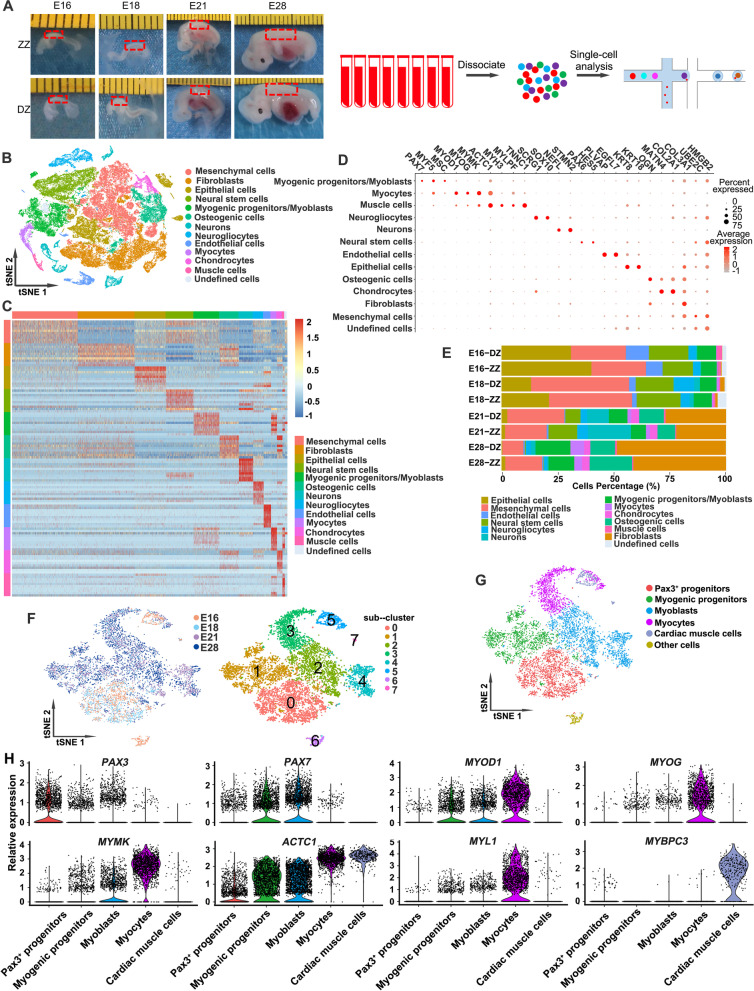
Background: Skeletal muscle development is a multistep process whose understanding is central in a broad range of fields and applications, from the potential medical value to human society, to its economic value associated with improvement of agricultural animals. Skeletal muscle initiates in the somites, with muscle precursor cells generated in the dermomyotome and dermomyotome-derived myotome before muscle differentiation ensues, a developmentally regulated process that is well characterized in model organisms. However, the regulation of skeletal muscle ontogeny during embryonic development remains poorly defined in farm animals, for instance in pig. Here, we profiled gene expression and chromatin accessibility in developing pig somites and myotomes at single-cell resolution.

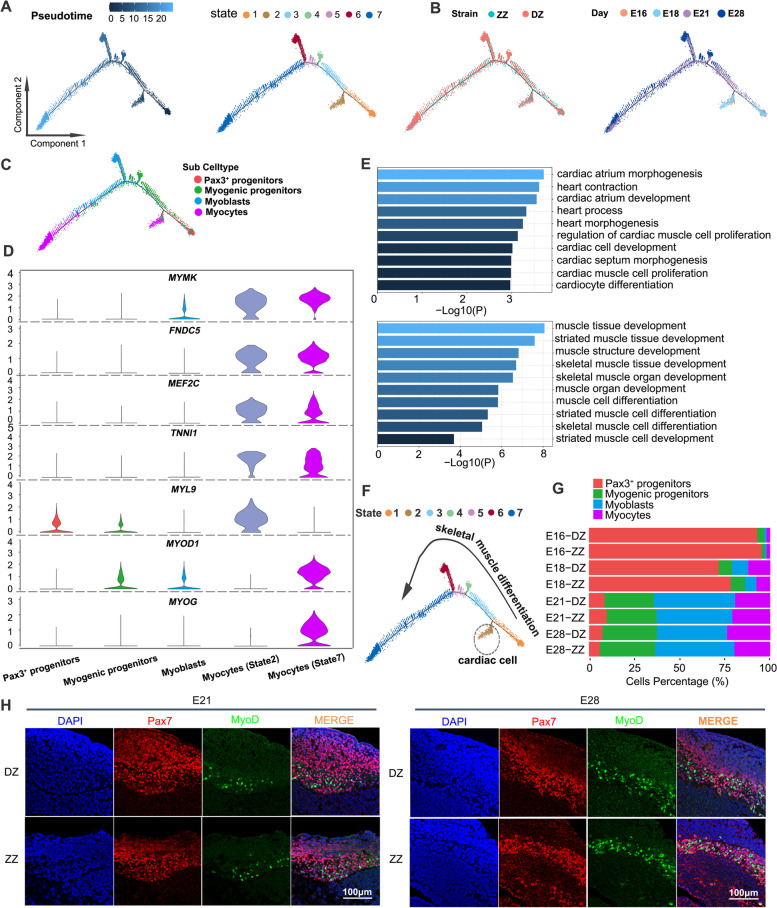
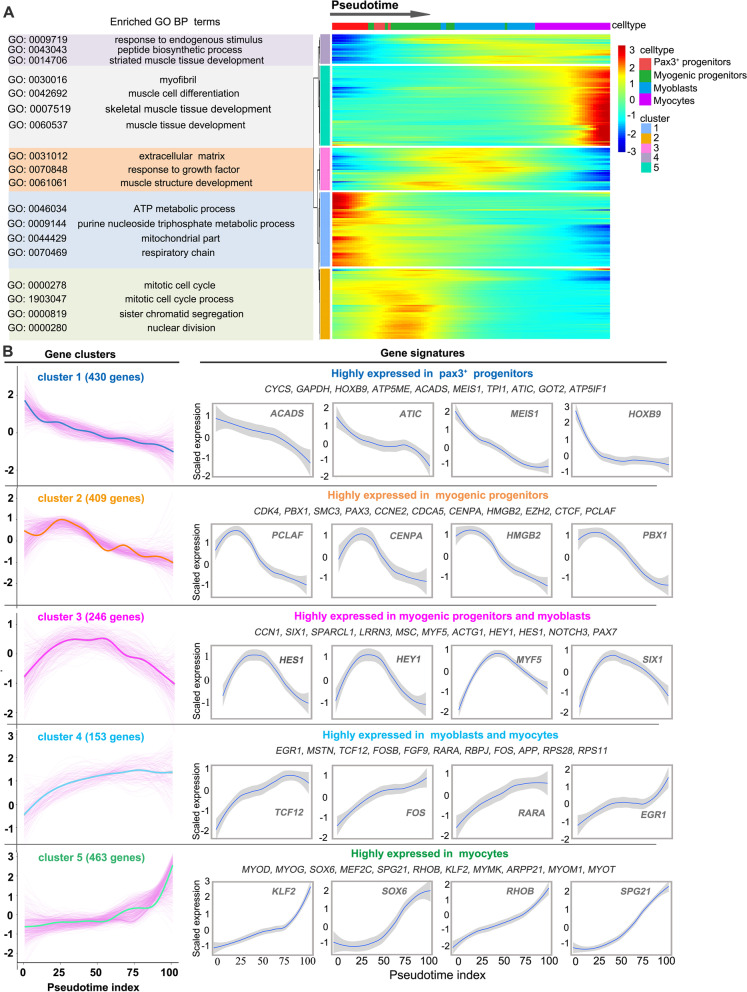
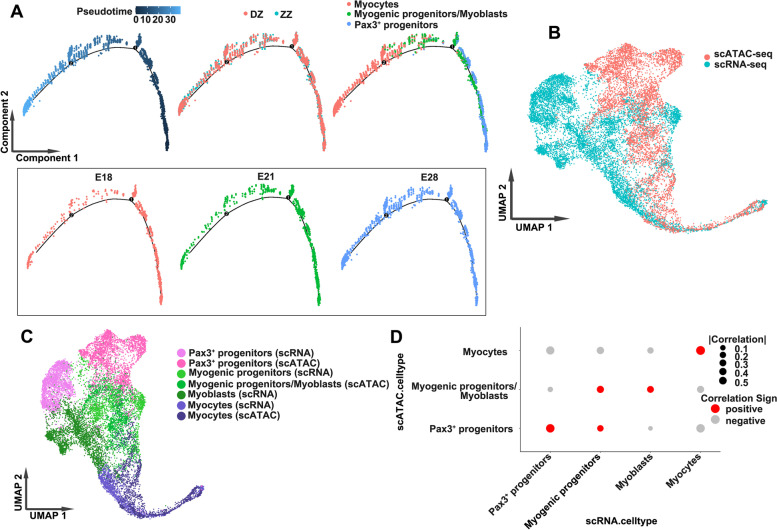
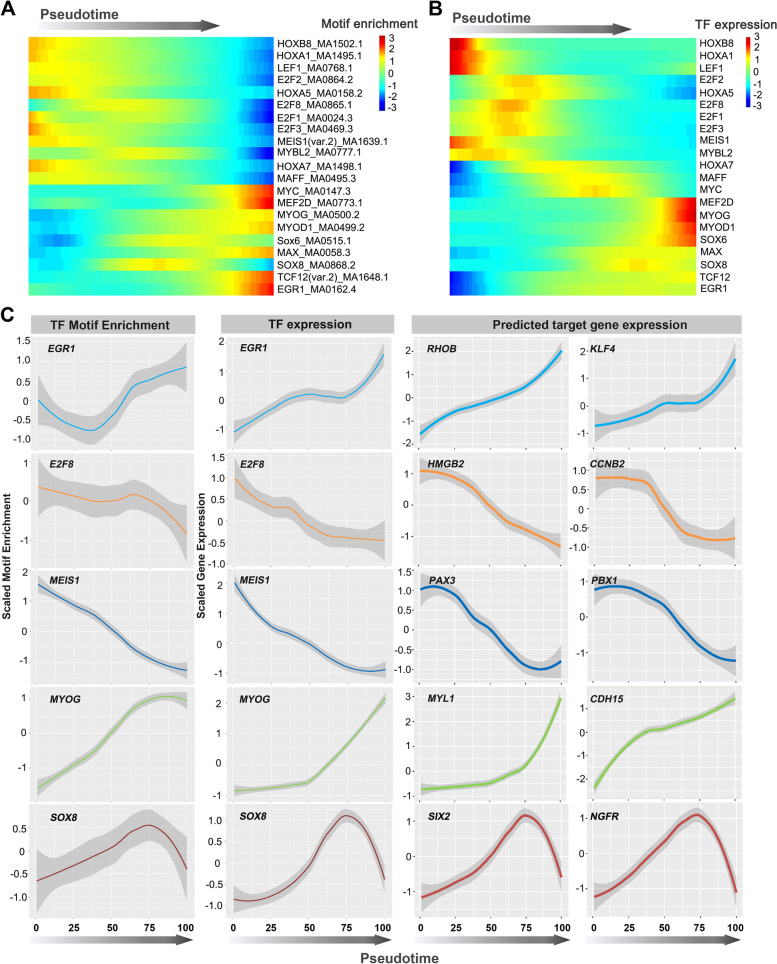
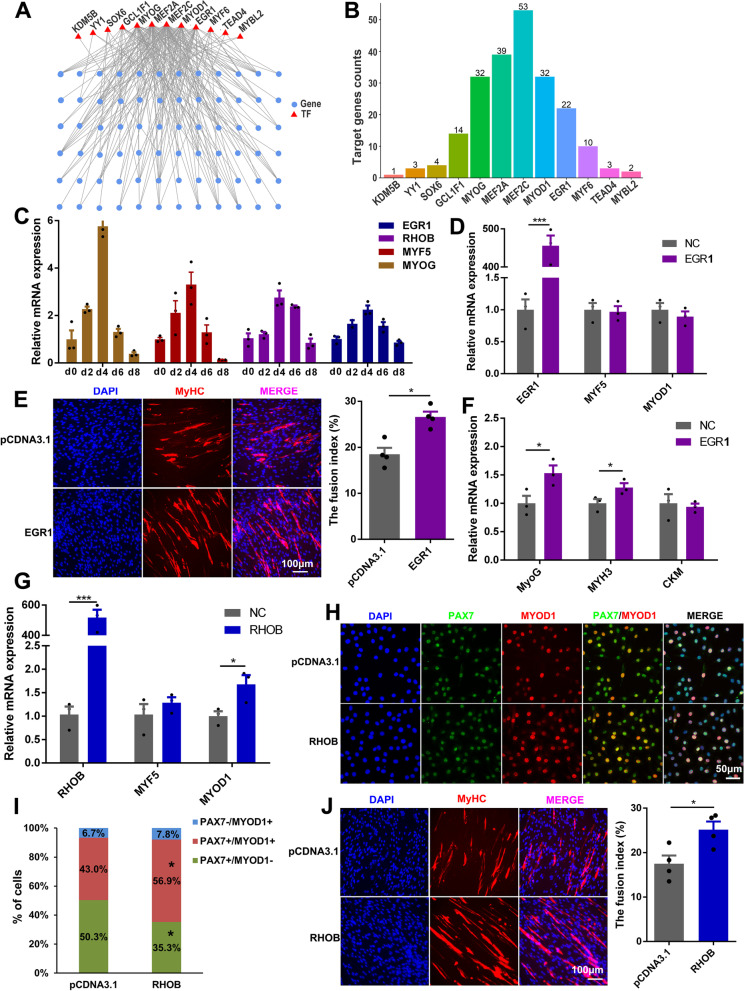
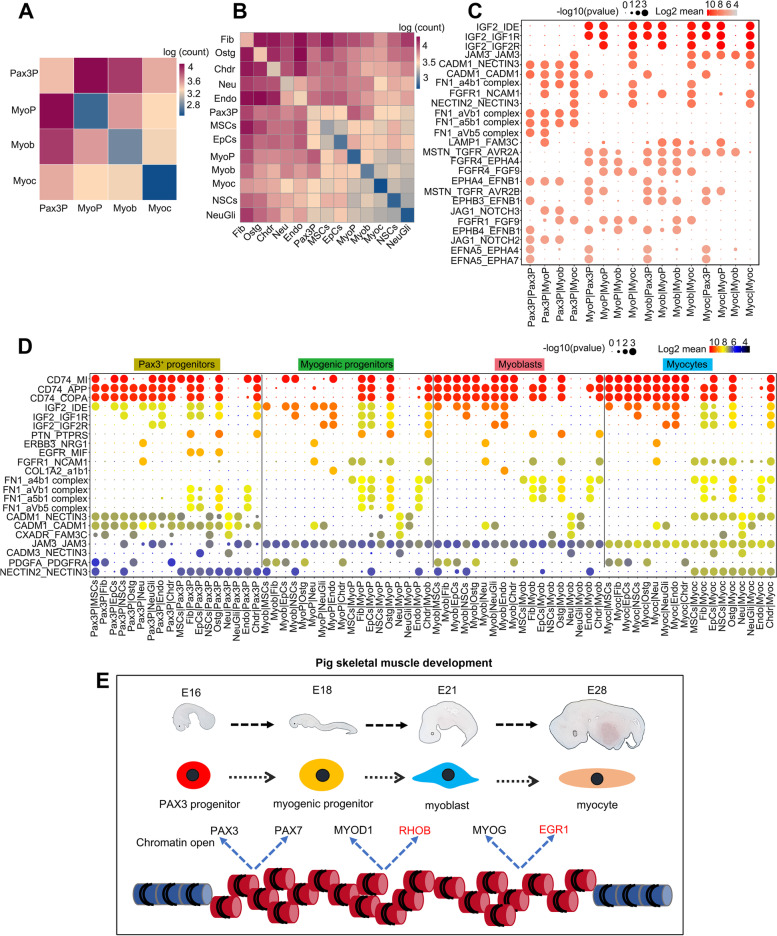
Results: We identified myogenic cells and other cell types and constructed a differentiation trajectory of pig skeletal muscle ontogeny. Along this trajectory, the dynamic changes in gene expression and chromatin accessibility coincided with the activities of distinct cell type-specific transcription factors. Some novel genes upregulated along the differentiation trajectory showed higher expression levels in muscular dystrophy mice than that in healthy mice, suggesting their involvement in myogenesis. Integrative analysis of chromatin accessibility, gene expression data, and in vitro experiments identified EGR1 and RHOB as critical regulators of pig embryonic myogenesis.

Conclusions: Collectively, our results enhance our understanding of the molecular and cellular dynamics in pig embryonic myogenesis and offer a high-quality resource for the further study of pig skeletal muscle development and human muscle disease.

Keywords: Myogenic differentiation; Pig; Skeletal muscle; scATAC-seq; scRNA-seq.


Conflict of interest statement

The authors declare that they have no competing interests.

Figures

Fig. 1
Fig. 1
scRNA-seq identified major cell types in developing pig somites. A Experimental workflow schematic. Somite tissues [a mixture of embryos (n=5) from the same sow] of ZZ and DZ at E16, E18, E21, and myotome tissues [a mixture of embryos (n=5) from the same sow] at E28 were isolated. Tissue samples were dissociated into a single-cell solution and then single-cell transcriptomes were captured and analyzed using 10×Genomics. The minimum scale of the ruler in the embryo photograph is 1 mm. B t-Stochastic neighbor embedding (tSNE) plots showing the distribution of the main cell populations using the scRNA-seq. Using marker genes, cells were annotated as mesenchymal cells, fibroblasts, epithelial cells, neural stem cells, myogenic progenitors/myoblasts, osteogenic cells, neurons, neurogliocytes, endothelial cells, myocytes, chondrocytes, or muscle cells. Colors indicate cell types. Each dot represents one cell. C Heatmap showing the top 20 markers for each of the 12 cell populations. D Dot plot of the mean expression of canonical marker genes for 12 cell populations. E Bar plot showing the percentage of different cell types within each sample. F Visualization of myogenic cell (including myogenic progenitors/myoblasts, myocytes, and muscle cells in Fig. 1B) sub-clusters via t-SNE by developmental stage (left) and sub-cluster number (right). G tSNE plots showing the cell identities of myogenic cell sub-clusters. H Violin plots showing feature gene expression in each cell sub-cluster. Colors represent sub-clusters described in Fig. 1G
Fig. 2
Fig. 2
Reconstruction of the myogenic differentiation trajectory in a pseudotime manner. A Pseudotime analysis of myogenic cells (including Pax3+ progenitors, myogenic progenitors, myoblasts, and myocytes in Fig. 1E) was performed by Monocle 2 and revealed seven different cell states (states 1~7). The distributions of cell states were presented along with pseudotime flows. Each dot is a cell. B Visualization of myogenic differentiation trajectory by cell origins (left) and developmental stages (right). C Visualization of myogenic differentiation trajectory by cell identity. D Violin plots showing feature gene expression in each cell cluster. MYMK, FNDC5, MEF2C, and TNNI1 are muscle development-related genes. MYL9 is a cardiomyocyte-specific marker. MYOD1 and MYOG are skeletal muscle cell-specific markers. E Gene Ontology (GO) analysis of the differentially expressed genes with high levels in myocytes (state 2) and myocytes (state 7). F Visualization of myogenic differentiation trajectory by cell state, with cardiac cells distinguished from differentiating skeletal muscle cells. G Bar plot showing the percentage of cells within each sample assigned to the annotated myogenic cell types. H Immunofluorescence staining for Pax7 and MyoD on somite cross sections of ZZ and DZ at E21 and E28. Scale bar = 100μm
Fig. 3
Fig. 3
Transcriptome dynamics of the myogenic differentiation. A Heatmap showing the expression changes of the 1700 top differentially expressed genes (DEGs) in a pseudotemporal order, with the DEGs, were cataloged into 5 five major clusters in characterized patterns (right). The GO analysis was performed for each gene cluster, and the representative enriched biological process (BP) terms are presented (left). B The expression dynamics of DEGs in gene clusters. Thick lines indicate the average gene expression patterns in each cluster (left). Gene signatures and expression dynamics of representative genes in each gene cluster (right)
Fig. 4
Fig. 4
Single-cell chromatin accessibility analysis of pig myogenic cells. A The myogenic cells in the scATAC-seq dataset are shown in the Uniform Manifold Approximation and Projection (UMAP) space, colored by cluster. B Top: Bar plot showing the average accessibility of 13 selected marker genes from our scRNA-seq data considering all myogenic cells. Bottom: dot plot of the standardized accessibility of the marker genes (gene body ± 2 kb) in each of the seven clusters. For each gene, the minimum accessibility value is subtracted, and the result is divided by its maximum accessibility value. The dot size indicates the percentage of cells in each cluster in which the gene of interest is accessible. The standardized accessibility level is indicated by color intensity. C UMAP visualization of the myogenic cells in the scATAC-seq dataset, colored by cell identity. D Percentage distribution of open chromatin elements in each scATAC-seq sample. E Percentage distribution of open chromatin elements in scATAC-seq myogenic cell types. F Heatmap showing cell type-specific differentially accessible peaks (DAPs) (yellow: open chromatin, purple: closed chromatin). G Distribution of open chromatin elements among DAPs in myogenic cell types. H Number of shared and unique peaks among snATAC-seq cell types
Fig. 5
Fig. 5
Cell type-specific gene regulatory landscape of pig embryonic skeletal muscle. A Heatmap showing motif enrichment analysis on the cell type-specific open chromatin regions using 10× Genomics (full results are shown in Additional file 7: Table S6). B TF expression z score heatmap that corresponding to the motif enrichment in each cell type. C Heatmap of cell type-specific regulons, as inferred by the SCENIC algorithm. Regulon activity was binarized to “on” (black) or “off” (white). D tSNE depiction of regulon activity (“on-blue”, “off-gray”), TF gene expression (red scale), and expression of predicted target genes (purple scale) of exemplary regulons for Pax3+ progenitors (MEIS1), myogenic progenitors (EZH2 and HDAC2), myoblasts (EGR1), and myocytes (MYOG). Examples of target gene expression of the TFs (PAX3, PCNA, SRSF7, RHOB, and SPG21) are shown in purple scale. Additional examples are given in Figure S6. The full list of regulons and their respective predicted target genes can be found in Additional file 11: Table S10
Fig. 6
Fig. 6
Integrated analysis of scATAC-seq and scRNA-seq data. A The pseudotime trajectory in the scATAC-seq dataset. B UMAP representation of scATAC-scRNA integration results. Cells are colored by technology (scATAC=red, scRNA=blue). C UMAP representation of scATAC-scRNA integration results. Cells are colored by cell type assignment. D Dot plot showing scATAC-scRNA integration cell type assignment using confusion matrix. Each column represents the original cell type assignment of scRNA-seq data, and each row represents the cell type assignment predicted after integration with scATAC-seq data. The size of the dots represents the absolute value of the correlation, and the red and gray dots represent the positive and negative correlations, respectively
Fig. 7
Fig. 7
Activity and RNA expression dynamics of TFs along the pseudotime trajectory. A Heatmap showing the activity of TFs along the differentiation trajectory. B TF expression heatmap corresponding to the motif enrichment along the differentiation trajectory. C Pseudotime-dependent chromatin accessibility and gene expression changes along the myogenic lineages. The first column shows the dynamics of the 10× Genomics TF enrichment score. The second column shows the dynamics of TF gene expression values, and the third and fourth columns represent the dynamics of SCENIC-reported target gene expression values of corresponding TFs. Error bars denote 95% confidence intervals of local polynomial regression fitting. Additional examples are given in Additional file 1: Figure S7
Fig. 8
Fig. 8
Functional analysis of EGR1 and RHOB in myogenesis. A To explore the connection network between TFs and targets in skeletal muscle development, 172 genes associated with muscle development (http://wiki.geneontology.org/index.php/Muscle biology) were extracted as target genes. Then, 215 high-confidence annotation TF-target pairs were selected from regulon activity network to construct the regulatory network. B Target genes counts of TFs. C The mRNA levels of EGR1, RHOB, and myogenic markers during the differentiation of pig primary myogenic cells (PPMCs) at several indicated time points. When the cells were cultured in growth medium (GM) at sub-confluent density, it was defined as day 0 (day 0); when the cells reached 100% confluence, GM was changed to differentiation medium (DM). D The mRNA levels of EGR1, Myf5, and MyoD in proliferating C2C12 cells at 36 h after transfection with the pcDNA3.1-EGR1 vector. E Immunofluorescence staining for MyHC in PPMCs after transfection with the pcDNA3.1-EGR1 vector and differentiation induction for 5 days. The fusion index (the percentage of nuclei in fused myotubes out of the total nuclei) was calculated. F The mRNA levels of myogenic differentiation markers in C2C12 cells after transfection with the pcDNA3.1-EGR1 vector and induction of differentiation for 3 days. G The mRNA levels of RHOB, Myf5, and MyoD1 in proliferating C2C12 cells at 36 h after transfection with the pcDNA3.1-RHOB vector. H Immunofluorescence co-staining for Pax7 and MyoD in C2C12 cells transfected with the pcDNA3.1-EGR1 vector and cultured in growth medium for 36 h. I Statistical analysis was performed to quantify the percentages of the three myogenic cell populations. J Immunofluorescence staining for MyHC in PPMCs after transfection with the pcDNA3.1-RHOB vector and induced differentiation for 5 days. The fusion index was calculated. *P < 0.05, **P < 0.01, ***P < 0.001
Fig. 9
Fig. 9
Cell–cell communication analysis in the developing pig somite. AB Heatmaps showing the number of cellcell interactions in the scRNA-seq dataset of myogenic cells (A) and all somite cells (B), as inferred by CellPhoneDB. Dark blue and dark red colors denote low and high numbers of cellcell interactions, respectively. C CellPhoneDB-derived measures of cellcell interaction scores and p values among myogenic cells. Each row shows a ligandreceptor pair, and each column shows the two interacting cell types binned by cell type. Columns are sub-ordered by first interacting cell type into Pax3+ progenitors, myogenic progenitors, myoblasts, and myocytes. The color scale denotes the mean values for all the interacting partners, where the mean value refers to the total mean of the individual partner average expression values in the interacting cell-type pairs. D CellPhoneDB-derived measures of cellcell interaction scores and p values between myogenic cells and non-myogenic cells. Columns are sub-ordered by interacting myogenic cell type into Pax3+ progenitors, myogenic progenitors, myoblasts, and myocytes. E A diagram demonstrating the regulation of pig skeletal muscle ontogeny during embryonic development. In this model, during E16 to E 28, chromatin accessibility regulates the expression of classical and newly identified myogenic-related genes, which in turn promotes myogenic lineage fate determination and further myogenic differentiation

References

    1. Buckingham M, Rigby PWJ. Gene regulatory networks and transcriptional mechanisms that control myogenesis. Dev Cell. 2014;28:225–238. - PubMed
    1. Bentzinger CF, Wang YX, Rudnicki MA. Building muscle: molecular regulation of myogenesis. Cold Spring Harb Perspect Biol. 2012;4(2):a008342. - PMC - PubMed
    1. Buckingham M, Montarras D, Relaix F, Cumano A, Mansouri A, Morgan J, et al. Pax3 and Pax7 mark a major population of muscle progenitor cells that contribute to skeletal muscle formation and regeneration. Neuromuscul Disord. 2006;16:S48–S48. - PubMed
    1. Murani E, Muraniova M, Ponsuksili S, Schellander K, Wimmers K. Identification of genes differentially expressed during prenatal development of skeletal muscle in two pig breeds differing in muscularity. BMC Dev Biol. 2007;7:109. - PMC - PubMed
    1. Picard B, Berri C, Lefaucheur L, Molette C, Sayd T, Terlouw C. Skeletal muscle proteomics in livestock production. Brief Funct Genomics. 2010;9:259–278. - PubMed

Publication types