. 2023 May;102(5):525-535.
doi: 10.1177/00220345221147908. Epub 2023 Feb 1.

High-Resolution Transcriptomic Landscape of the Human Submandibular Gland

Affiliations

High-Resolution Transcriptomic Landscape of the Human Submandibular Gland

E Horeth et al. J Dent Res. 2023 May.

Abstract

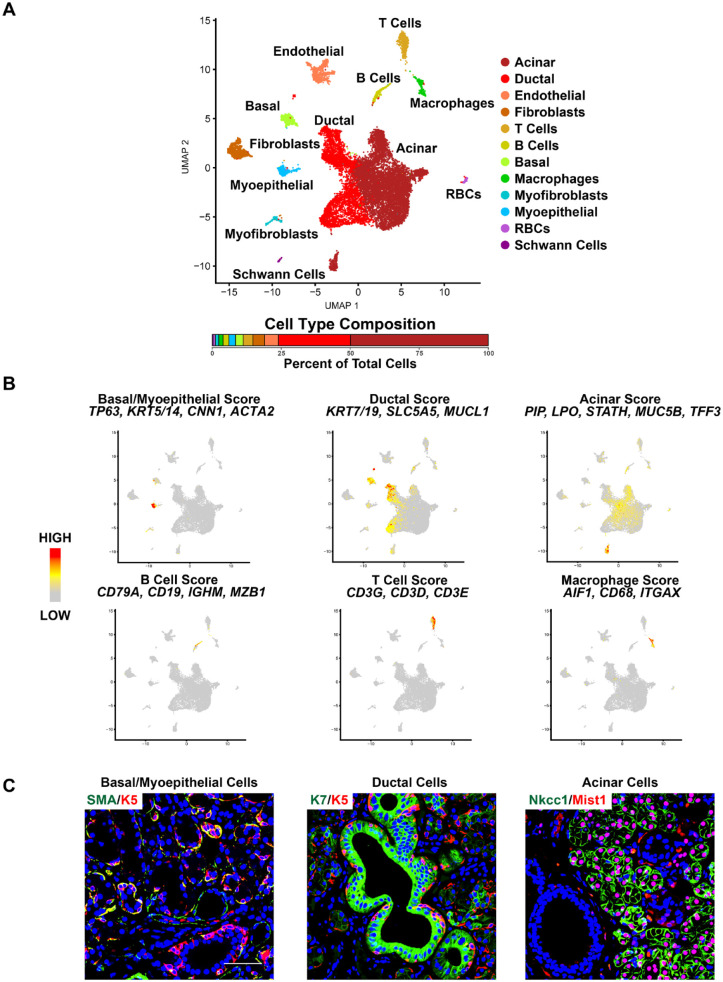
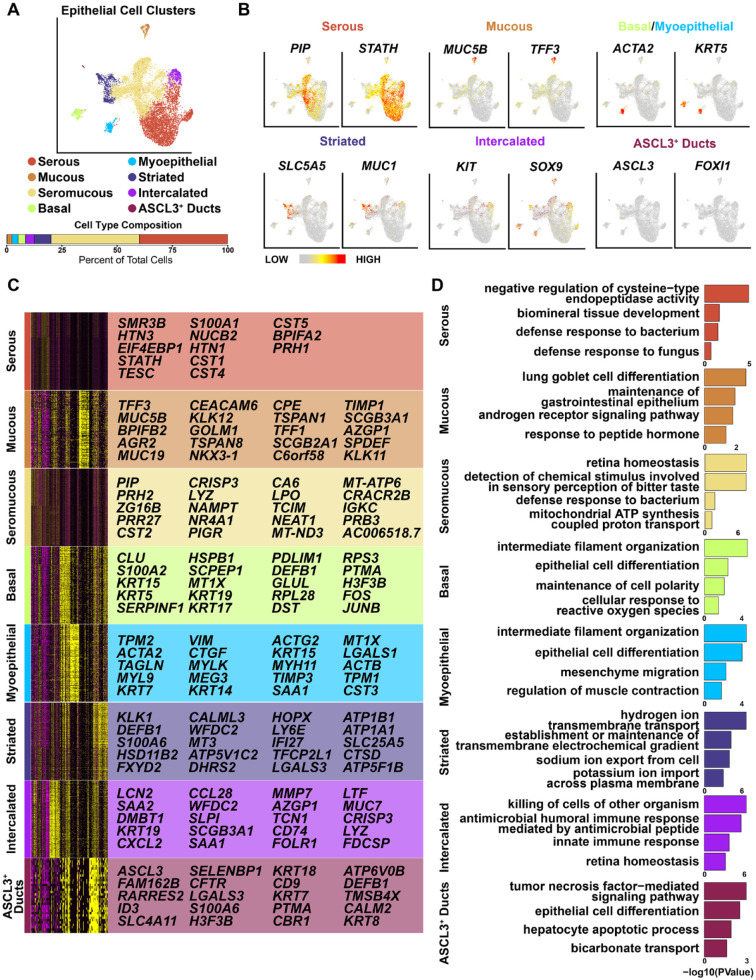
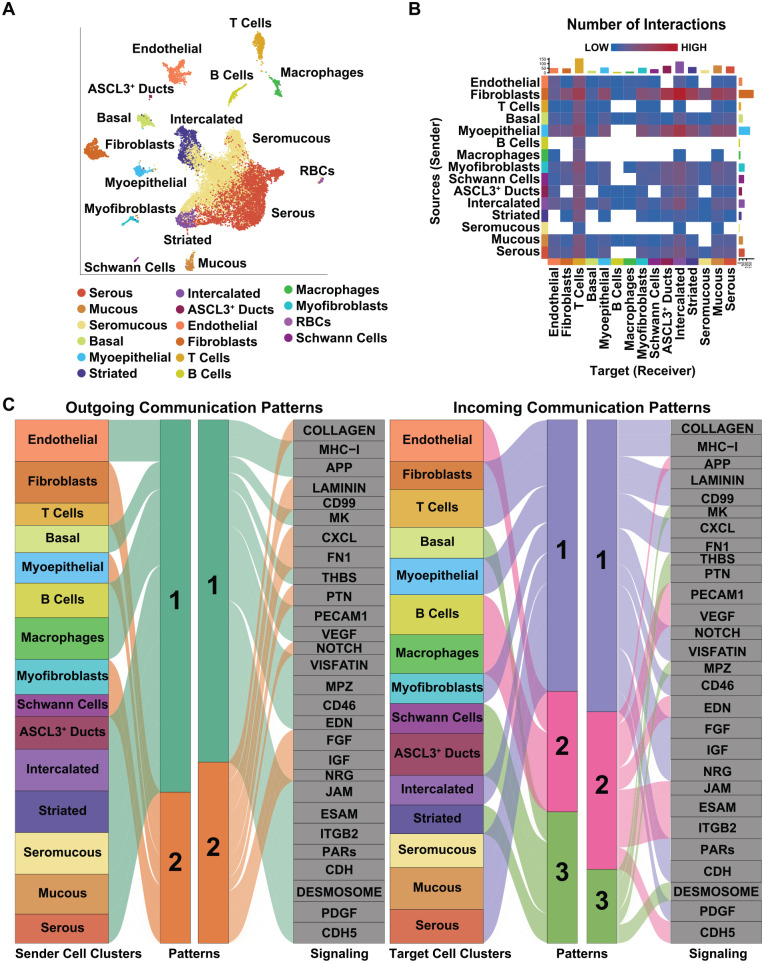
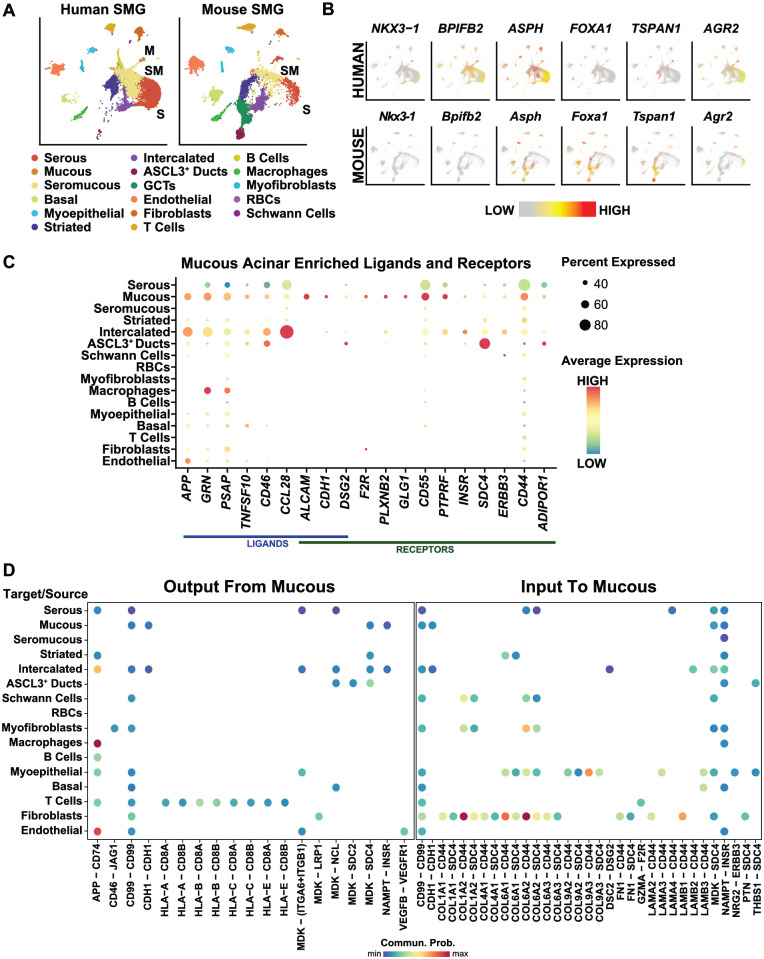
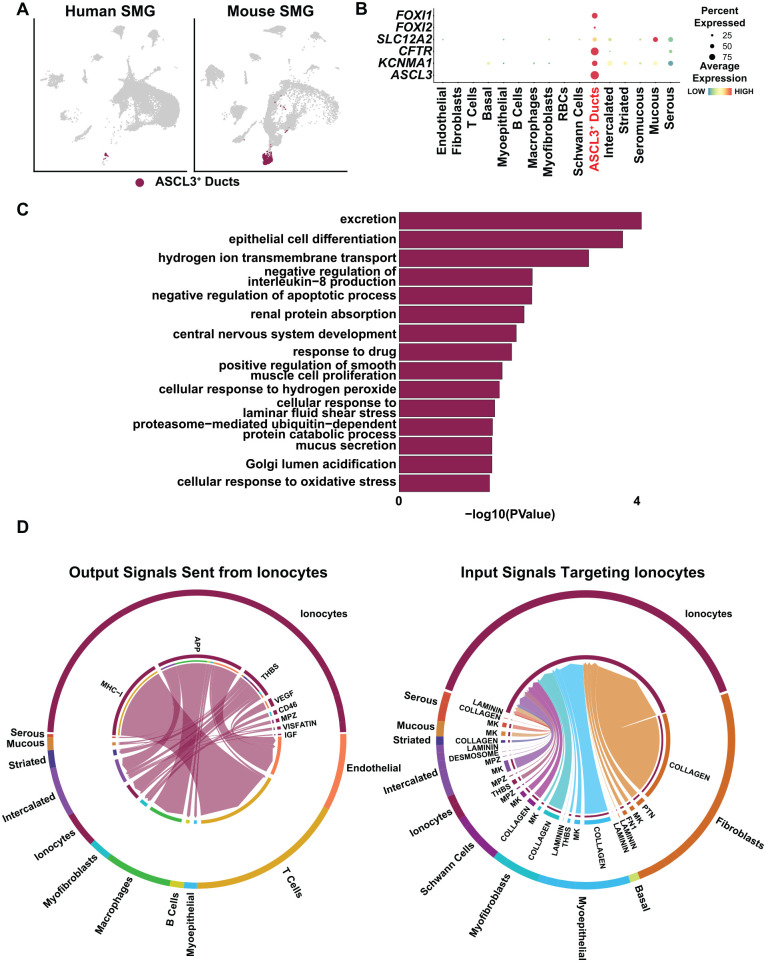
Saliva-secreting and transporting cells are part of the complex cellular milieu of the human salivary gland, where they play important roles in normal glandular physiology and diseased states. However, comprehensive molecular characterization, particularly at single-cell resolution, is still incomplete, in part due to difficulty in procuring normal human tissues. Here, we perform an in-depth analysis of male and female adult human submandibular gland (SMG) samples by bulk RNA sequencing (RNA-seq) and examine the molecular underpinnings of the heterogeneous cell populations by single-cell (sc) RNA-seq. Our results from scRNA-seq highlight the remarkable diversity of clusters of epithelial and nonepithelial cells that reside in the SMG that is also faithfully recapitulated by deconvolution of the bulk-RNA data sets. Our analyses reveal complex transcriptomic heterogeneity within both the ductal and acinar subpopulations and identify atypical SMG cell types, such as mucoacinar cells that are unique to humans and ionocytes that have been recently described in the mouse. We use CellChat to explore ligand-receptor interactome predictions that likely mediate crucial cell-cell communications between the various cell clusters. Finally, we apply a trajectory inference method to investigate specific cellular branching points and topology that offers insights into the dynamic and complex differentiation process of the adult SMG. The data sets and the analyses herein comprise an extensive wealth of high-resolution information and a valuable resource for a deeper mechanistic understanding of human SMG biology and pathophysiology.

Keywords: gene expression; salivary glands; single-cell RNA-sequencing; transcription factors; transcriptomics.


Conflict of interest statement

The authors declared no potential conflicts of interest with respect to the research, authorship, and/or publication of this article.

Figures

Figure 1.
Figure 1.
Single-cell RNA sequencing reveals the cellular heterogeneity in the human submandibular gland (SMG). (A) Uniform manifold approximation and projection (UMAP) of the human SMG. Cell cluster identities are also shown. RBCs- red blood cells. (B) Feature plots demonstrating the expression of several well-established cell type–specific markers across the various cell populations as indicated. Red indicates maximum gene expression, and gray indicates low or no expression. (C) Representative immunofluorescence images of adult human SMGs stained with K5 and SMA to mark the basal/myoepithelial cells, K7 to mark the ductal cells, and MIST1 and NKCC1 to mark the acinar cells. Blue = nuclear staining. Scale bar: 37.5 µm.
Figure 2.
Figure 2.
Analysis of human submandibular gland (SMG) epithelium. (A) Uniform manifold approximation and projection visualization of the epithelial cell populations based on hierarchical clustering analysis performed in Figure 1A. Epithelial cell clusters are shown. (B) Feature plots illustrating the expression patterns of select marker genes representing the various clusters. (C) Heatmap depicts the top 20 genes enriched in each epithelial cell cluster as identified in panel A. (D) Gene Ontology (GO) analysis of genes enriched in each epithelial cell cluster as identified in panel A/B.
Figure 3.
Figure 3.
Network and cell–cell communication signaling patterns of submandibular gland (SMG) cell populations. (A) Uniform manifold approximation and projection visualization of the 16 human cell population cluster identities. (B) Heatmap visualization of the number of possible interactions between any 2 cell populations. Red (high) and blue (low) represent stronger and lower interaction strengths, respectively. (C) Alluvial plot showing outgoing signaling patterns of sender (secreting) cells, which demonstrates the correspondence between the inferred latent patterns and cell clusters, as well as signaling pathways. The thickness of the flow indicates the contribution of the cell cluster or cell signaling pathway to each latent pattern. Height of each pattern is proportional to the number of associated cell clusters or signaling pathways. The right panel shows incoming signaling patterns of target cells demonstrating how target cells coordinate with each other and certain signaling pathways, to respond to incoming signaling.
Figure 4.
Figure 4.
Comparative analysis and associated signaling of a unique population of human mucous acinar cells. (A) Uniform manifold approximation and projection visualization of human (left panel) and mouse (right panel) submandibular gland (SMG) cell populations (Horeth et al. 2021). Cell cluster identities are shown. (B) Feature plot visualization of genes enriched in human mucous acinar cells with corresponding expression in mouse SMG. (C) Dot plot showing ligands and receptors significantly enriched in human mucous cells. (D) Dot plot showing outgoing communication probability of ligand–receptor pairs contributing to the signaling from mucous cells to other cell types (left panel). Right panel is a dot plot showing incoming communication probability of ligand–receptor pairs contributing to the signaling from other cell types to mucous cells. M, mucous; S, serous; SM, seromucous.
Figure 5.
Figure 5.
Ionocyte-associated signaling in human submandibular gland (SMG). (A) Uniform manifold approximation and projection visualization of the ASCL3+ cell population in human (left panel) and mouse (right panel) (Horeth et al. 2021). (B) Dot plot showing expression of genes known to be highly expressed in ionocytes and that are enriched in the ASCL3+ cell cluster. (C) Gene Ontology analysis showing biological processes associated with the top enriched genes in the human ionocyte cell cluster. (D) Chord diagrams of inferred outgoing signaling pathways sent from ionocytes to other cell types (left panel). Right panel shows inferred incoming signaling pathways from other cell types targeting ionocytes. Signaling sources are zoomed out and shown on the outer ring with the colored segments representing cell identity information. Segment size is proportional to the total outgoing or incoming interaction strength associated with each pathway in the corresponding cell population.

References

    1. Chen M, Lin W, Gan J, Lu W, Wang M, Wang X, Yi J, Zhao Z. 2022. Transcriptomic mapping of human parotid gland at single-cell resolution. J Dent Res. 101(8):972–982. - PubMed
    1. Chenevert J, Duvvuri U, Chiosea S, Dacic S, Cieply K, Kim J, Shiwarski D, Seethala RR. 2012. DOG1: a novel marker of salivary acinar and intercalated duct differentiation. Mod Pathol. 25(7):919–929. - PubMed
    1. Chibly AM, Aure MH, Patel VN, Hoffman MP. 2022. Salivary gland function, development and regeneration. Physiol Rev. 102(3):1495–1552. - PMC - PubMed
    1. Chu T, Wang Z, Pe’er D, Danko CG. 2022. Cell type and gene expression deconvolution with BayesPrism enables Bayesian integrative analysis across bulk and single-cell RNA sequencing in oncology. Nat Cancer. 3(4):505–517. - PMC - PubMed
    1. Costa-da-Silva AC, Aure MH, Dodge J, Martin D, Dhamala S, Cho M, Rose JJ, Bassim CW, Ambatipudi K, Hakim FT, et al.. 2022. Salivary ZG16B expression loss follows exocrine gland dysfunction related to oral chronic graft-versus-host disease. iScience. 25(1):103592. - PMC - PubMed

Publication types