. 2023 Jan 13:12:1060508.
doi: 10.3389/fonc.2022.1060508. eCollection 2022.

Identification of an unfolded protein response-related signature for predicting the prognosis of pancreatic ductal adenocarcinoma

Affiliations

Identification of an unfolded protein response-related signature for predicting the prognosis of pancreatic ductal adenocarcinoma

Lishan Fang et al. Front Oncol. .

Abstract

Background: Pancreatic ductal adenocarcinoma (PDAC) is a highly aggressive lethal malignancy. An effective prognosis prediction model is urgently needed for treatment optimization.

Methods: The differentially expressed unfolded protein response (UPR)‒related genes between pancreatic tumor and normal tissue were analyzed using the TCGA-PDAC dataset, and these genes that overlapped with UPR‒related prognostic genes from the E-MTAB-6134 dataset were further analyzed. Univariate, LASSO and multivariate Cox regression analyses were applied to establish a prognostic gene signature, which was evaluated by Kaplan‒Meier curve and receiver operating characteristic (ROC) analyses. E‒MTAB‒6134 was set as the training dataset, while TCGA-PDAC, GSE21501 and ICGC-PACA-AU were used for external validation. Subsequently, a nomogram integrating risk scores and clinical parameters was established, and gene set enrichment analysis (GSEA), tumor immunity analysis and drug sensitivity analysis were conducted.

Results: A UPR-related signature comprising twelve genes was constructed and divided PDAC patients into high- and low-risk groups based on the median risk score. The UPR-related signature accurately predicted the prognosis and acted as an independent prognostic factor of PDAC patients, and the AUCs of the UPR-related signature in predicting PDAC prognosis at 1, 2 and 3 years were all more than 0.7 in the training and validation datasets. The UPR-related signature showed excellent performance in outcome prediction even in different clinicopathological subgroups, including the female (p<0.0001), male (p<0.0001), grade 1/2 (p<0.0001), grade 3 (p=0.028), N0 (p=0.043), N1 (p<0.001), and R0 (p<0.0001) groups. Furthermore, multiple immune-related pathways were enriched in the low-risk group, and risk scores in the low-risk group were also associated with significantly higher levels of tumor-infiltrating lymphocytes (TILs). In addition, DepMap drug sensitivity analysis and our validation experiment showed that PDAC cell lines with high UPR-related risk scores or UPR activation are more sensitive to floxuridine, which is used as an antineoplastic agent.

Conclusion: Herein, we identified a novel UPR-related prognostic signature that showed high value in predicting survival in patients with PDAC. Targeting these UPR-related genes might be an alternative for PDAC therapy. Further experimental studies are required to reveal how these genes mediate ER stress and PDAC progression.

Keywords: pancreatic cancer; prognostic model; risk score; survival analysis; unfolded protein response.


Conflict of interest statement

The authors declare that the research was conducted in the absence of any commercial or financial relationships that could be construed as a potential conflict of interest.

Figures

Figure 1
Figure 1
Flowchart of the study design.
Figure 2
Figure 2
Identification of differentially expressed UPR-related genes and functional annotation. (A) A heatmap showing the expression of differentially expressed UPR-related genes in normal and cancer tissues in the TCGA. (B) The correlation network of selected candidate genes. (C) GO enrichment analysis. (D) KEGG pathway enrichment analysis.
Figure 3
Figure 3
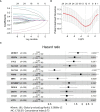
Construction of a UPR-related signature. (A, B) Candidate genes were screened using LASSO regression analysis. (C) Multivariate Cox regression analysis of candidate genes. *P<0.05, **P<0.01 and ***P<0.001.
Figure 4
Figure 4
Prognostic performance of the UPR-related signature in the training dataset (E-MTAB-6134) and three validation datasets (TCGA, GSE21501, ICGC-PACA-AU). (A) Kaplan‒Meier survival curves, risk score distribution and survival status of patients in the high- and low-risk groups. (B) ROC curves were used to assess the predictive performance of the 1-, 2-, and 3-year OS.
Figure 5
Figure 5
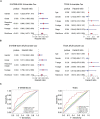
The predictive performance of the risk score and other clinicopathological parameters. (A, B) Validation of the risk score as an independent prognostic factor using univariate Cox analysis and multivariate Cox analysis in E-MTAB-6134 cohort and TCGA cohort. (C) ROC curves indicate the difference in AUC between clinical pathological features.
Figure 6
Figure 6
The survival outcomes of PDAC cancer patients in different risk groups. (A) Correlation between risk score and clinicopathological parameters. (B) Stratified analysis of the E-MTAB-6134 cohort. The survival outcomes of PDAC cancer patients with different risk scores in subgroups based on clinicopathological parameters.
Figure 7
Figure 7
Nomogram for predicting 1-,2-, and 3-year OS. (A, B) Construction of a nomogram based on risk scores and other clinical factors. (C, D) The predictive accuracy of the nomogram verified by calibration curves. (E, F) DCA curves were used to compare the net survival benefit of the nomogram, risk score, and clinical parameters.
Figure 8
Figure 8
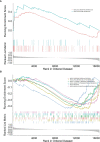
GSEA functional pathway analysis. (A, B) Top enriched biological pathways in high- and low-risk group patients.
Figure 9
Figure 9
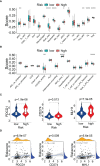
Analysis of immune cell infiltration and immune checkpoint genes. (A, B) Comparison of immune cells and immune-related pathways between the high- and low-risk groups. (C) Expression of immune checkpoint genes (PDCD1 and CD274) and the DNA mismatch repair gene MLH1 between the high- and low-risk groups. (D) The correlation between the risk score and the expression of PDCD1, CD274, and MLH1. *P<0.05, **P<0.01 and ***P<0.001.
Figure 10
Figure 10
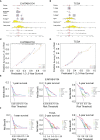
Drug sensitivity analysis. (A) Risk scores of pancreatic cancer cell lines. (B) Drug sensitivity values of floxuridine from the PRISM repurposing secondary screen of all pancreatic cancer cell lines.
Figure 11
Figure 11
Cell proliferation assay. (A) Real-time RT‒PCR analysis of the mRNA levels of PDIA6, ZBTB17, ATF3, and SLC1A4 in the indicated cells. (B) Cell viability assay of the indicated cells treated with floxuridine. *P<0.05, **P<0.01. and ns=not significantly different (p > 0.05).

References

    1. Sung H, Ferlay J, Siegel RL, Laversanne M, Soerjomataram I, Jemal A, et al. . Global cancer statistics 2020: Globocan estimates of incidence and mortality worldwide for 36 cancers in 185 countries. CA: A Cancer J Clin (2021) 71(3):209–49. doi: 10.3322/caac.21660 - DOI - PubMed
    1. Siegel RL, Miller KD, Jemal A. Cancer statistics, 2015. CA Cancer J Clin (2015) 65(1):5–29. doi: 10.3322/caac.21254 - DOI - PubMed
    1. Siegel RL, Miller KD, Fuchs HE, Jemal A. Cancer statistics, 2022. CA Cancer J Clin (2022) 72(1):7–33. doi: 10.3322/caac.21708 - DOI - PubMed
    1. Hilmi M, Bartholin L, Neuzillet C. Immune therapies in pancreatic ductal adenocarcinoma: Where are we now? World J Gastroenterol (2018) 24(20):2137–51. doi: 10.3748/wjg.v24.i20.2137 - DOI - PMC - PubMed
    1. He J, Ahuja N, Makary MA, Cameron JL, Eckhauser FE, Choti MA, et al. . 2564 Resected periampullary adenocarcinomas at a single institution: Trends over three decades. HPB (Oxford) (2014) 16(1):83–90. doi: 10.1111/hpb.12078 - DOI - PMC - PubMed

LinkOut - more resources