. 2023 Apr;29(2):417-432.
doi: 10.3350/cmh.2022.0205. Epub 2022 Nov 21.

Single-cell phenotypes of peripheral blood immune cells in early and late stages of non-alcoholic fatty liver disease

Affiliations

Single-cell phenotypes of peripheral blood immune cells in early and late stages of non-alcoholic fatty liver disease

Kathryn Jane Waller et al. Clin Mol Hepatol. 2023 Apr.

Abstract

Background/aims: Immune and inflammatory cells respond to multiple pathological hits in the development of nonalcoholic steatohepatitis (NASH) and fibrosis. Relatively little is known about how their type and function change through the non-alcoholic fatty liver disease (NAFLD) spectrum. Here we used multi-dimensional mass cytometry and a tailored bioinformatic approach to study circulating immune cells sampled from healthy individuals and people with NAFLD.

Methods: Cytometry by time of flight using 36 metal-conjugated antibodies was applied to peripheral blood mononuclear cells (PBMCs) from biopsy-proven NASH fibrosis (late disease), steatosis (early disease), and healthy patients. Supervised and unsupervised analyses were used, findings confirmed, and mechanisms assessed using independent healthy and disease PBMC samples.

Results: Of 36 PBMC clusters, 21 changed between controls and disease samples. Significant differences were observed between diseases stages with changes in T cells and myeloid cells throughout disease and B cell changes in late stages. Semi-supervised gating and re-clustering showed that disease stages were associated with fewer monocytes with active signalling and more inactive NK cells; B and T cells bearing activation markers were reduced in late stages, while B cells bearing co-stimulatory molecules were increased. Functionally, disease states were associated with fewer activated mucosal-associated invariant T cells and reduced toll-like receptor-mediated cytokine production in late disease.

Conclusion: A range of innate and adaptive immune changes begin early in NAFLD, and disease stages are associated with a functionally less active phenotype compared to controls. Further study of the immune response in NAFLD spectrum may give insight into mechanisms of disease with potential clinical application.

Keywords: Mass cytometry; NAFLD.


Conflict of interest statement

Conflicts of Interest

WA has received honoraria for speaking and consultancy from Gilead Sciences, Glaxosmithkline, Intercept and Coherus, and competitive funding from Gilead Sciences and Glaxosmithkline. He is supported by grant funding from the Medical Research Council. Other authors have no conflict of interest to declare.

Figures

Figure 1.
Figure 1.
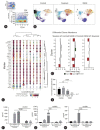
(A) PARC live cell clusters visualised on a two-dimensional UMAP plot. UMAP plots show changes in PARC clusters at the single cell level in the control, steatosis, and NASH patients. In the combined UMAP, grey represents single cells in steatosis and NASH that overlap with control. Yellow represents unique cells in steatosis compared to control, and red represents unique cells in NASH compared to control. An equal number (500,000) of cells from each group (control, steatosis, NASH) have been subsampled. (B) Heatmap representing z-score normalised cluster abundance across all patient groups and all live cell clusters. Rows represent the z-normalised cluster abundance across all clusters for each patient, columns patient expression profiles across clusters. Columns are coloured by either green (control patients), blue (steatosis patients), and pink (NASH patients). (C) PCA plot based on cluster abundance across patient groups. Green circles represent control patients (n=3), blue circles represent steatosis patients (n=6), and red circles represents NASH patients (n=10). PARC, phenotyping by accelerated refined community-partitioning; UMAP, Uniform Manifold Approximation and Projection; NASH, non-alcoholic steatohepatitis; PCA, principal components analysis.
Figure 2.
Figure 2.
(A) Balloon plot representing relative and median intensity profiles across live cell clusters for all markers. The size of each circle represents the relative expression of each marker across all clusters. Each circle is coloured based on the median intensity of each marker in a given cluster. Markers with shared expression profiles across clusters are located together (right dendrogram) and clustering of cells with shared median marker expression profiles across markers are located together (top dendrogram). Dark brown circles represent high relative expression and high median intensities. (B) Differential cluster abundance analysis between control, steatosis, and NASH patients. A bar plot to show the log2 fold change in cluster abundance. Log2 fold change refers to the change in cluster abundance between steatosis patients compared to control patients, NASH patients compared to control patients, and NASH patients compared to steatosis patients, respectively. Coloured bars represent clusters that reach statistical significance (FDR <0.05). Grey bars represent clusters that do not reach statistical significance (FDR >0.05). NASH, non-alcoholic steatohepatitis; FDR, false discovery rate.
Figure 3.
Figure 3.
(A) CD3+CD19- gating strategy. (B) CD3+CD19- clusters visualised on a two-dimensional UMAP plot. UMAP plots show changes in CD3+CD19- single cell clusters between control, steatosis, and NASH patients. Each colour represents a single cluster. Circle labels indicate cluster numbers. (C) Balloon plot representing relative and median intensity profiles across CD3+CD19- clusters for all markers. The size of each circle represents the relative expression of each marker across all clusters. Each circle is coloured based on the median intensity of each marker in a given cluster. Markers with shared expression profiles across clusters are located together (right dendrogram), and clustering of cells with shared median marker expression profiles across markers are located together (top dendrogram). (D) Differential CD3+CD19- cluster abundance analysis between control, steatosis, and NASH patients. A bar plot to show the log2 fold change in cluster abundance. Log2 fold change refers to the change in cluster abundance between steatosis patients compared to control patients, NASH patients compared to control patients, and NASH patients compared to steatosis patients, respectively. Coloured bars represent clusters that reach statistical significance (FDR <0.05). Grey bars represent clusters that do not reach statistical significance (FDR >0.05). UMAP, Uniform Manifold Approximation and Projection; NASH, non-alcoholic steatohepatitis; FDR, false discovery rate.
Figure 4.
Figure 4.
(A) CD3-CD19+ gating strategy. (B) CD3-CD19+ clusters visualised on a two-dimensional UMAP plot. UMAP plots show changes in CD3-CD19+ single cell clusters between control, steatosis, and NASH patients. Each colour represents a single cluster. Circle labels indicate cluster numbers. (C) Balloon plot representing relative and median intensity profiles across CD3-CD19+clusters for all markers. The size of each circle represents the relative expression of each marker across all clusters. Each circle is coloured based on the median intensity of each marker in a given cluster. Markers with shared expression profiles across clusters are located together (right dendrogram), and clustering of cells with shared median marker expression profiles across markers are located together (top dendrogram). (D) Differential CD3-CD19+ cluster abundance analysis between control, steatosis, and NASH patients. A bar plot to show the log2 fold change in cluster abundance. Log2 fold change refers to the change in cluster abundance between steatosis patients compared to control patients, NASH patients compared to control patients, and NASH patients compared to steatosis patients, respectively. Coloured bars represent clusters that reach statistical significance (FDR <0.05). Grey bars represent clusters that do not reach statistical significance (FDR >0.05). UMAP, Uniform Manifold Approximation and Projection; NASH, non-alcoholic steatohepatitis; FDR, false discovery rate.
Figure 5.
Figure 5.
(A) CD3-CD19-CD14-CD56+ gating strategy. (B) CD3-CD19-CD14-CD56+ clusters visualised on a two-dimensional UMAP plot. UMAP plots show changes in CD3-CD19-CD14-CD56+ single cell clusters between control, steatosis, and NASH patients. Each colour represents a single cluster. Circle labels indicate cluster numbers. (C) Balloon plot representing relative and median intensity profiles across CD3-CD19-CD14-CD56+ clusters for all markers. The size of each circle represents the relative expression of each marker across all clusters. Each circle is coloured based on the median intensity of each marker in a given cluster. Markers with shared expression profiles across clusters are located together (right dendrogram), and clustering of cells with shared median marker expression profiles across markers are located together (top dendrogram). (D) Differential CD3-CD19-CD14-CD56+ cluster abundance analysis between control, steatosis, and NASH patients. A bar plot to show the log2 fold change in cluster abundance. Log2 fold change refers to the change in cluster abundance between steatosis patients compared to control patients, NASH patients compared to control patients, and NASH patients compared to steatosis patients, respectively. Coloured bars represent clusters that reach statistical significance (FDR <0.05). Grey bars represent clusters that do not reach statistical significance (FDR >0.05).
Figure 6.
Figure 6.
(A) CD3-CD19-CD14+ gating strategy. (B) CD3-CD19-CD14+ clusters visualised on a two-dimensional UMAP plot. UMAP plots show changes in single cell CD3-CD19-CD14+ clusters between control, steatosis, and NASH patients. Each colour represents a single cluster. Circle labels indicate cluster numbers. (C) Balloon plot representing relative and median intensity profiles across CD3-CD19-CD14+ clusters for all markers. The size of each circle represents the relative expression of each marker across all clusters. Each circle is coloured based on the median intensity of each marker in a given cluster. Markers with shared expression profiles across clusters are located together (right dendrogram), and clustering of cells with shared median marker expression profiles across markers are located together (top dendrogram). (D) Differential CD3-CD19-CD14+ cluster abundance analysis between control, steatosis, and NASH patients. A bar plot to show the log2 fold change in cluster abundance. Log2 fold change refers to the change in cluster abundance between steatosis patients compared to control patients, NASH patients compared to control patients, and NASH patients compared to steatosis patients, respectively. Coloured bars represent clusters that reach statistical significance (FDR <0.05). Grey bars represent clusters that do not reach statistical significance (FDR >0.05). (E) Flow cytometry analysis of phosphorylated NFкB. PBMCs sampled from patients with NASH with fibrosis and healthy controls were stimulated with medium, LPS (1 μg/ mL) or flagellin (1 μg/mL), for 15 minutes and analysed by flow cytometry. (F) IL-6 production, (G) TNFα production, and (H) IL-10 production measured by ELISA. PBMCs sampled from patients with NASH with fibrosis and healthy controls were stimulated with medium, LPS (20 ng/mL) or flagellin (100 ng/mL), for 24 h before supernatants were collected for ELISA.
None

References

    1. Paik JM, Kabbara K, Eberly KE, Younossi Y, Henry L, Younossi ZM. Global burden of NAFLD and chronic liver disease among adolescents and young adults. Hepatology. 2022;75:1204–1217. - PubMed
    1. Ekstedt M, Hagström H, Nasr P, Fredrikson M, Stål P, Kechagias S, et al. Fibrosis stage is the strongest predictor for disease-specific mortality in NAFLD after up to 33 years of follow-up. Hepatology. 2015;61:1547–1554. - PubMed
    1. Dulai PS, Singh S, Patel J, Soni M, Prokop LJ, Younossi Z, et al. Increased risk of mortality by fibrosis stage in nonalcoholic fatty liver disease: Systematic review and meta-analysis. Hepatology. 2017;65:1557–1565. - PMC - PubMed
    1. Lin SZ, Fan JG. Peripheral immune cells in NAFLD patients: a spyhole to disease progression. EBioMedicine. 2022;75:103768. - PMC - PubMed
    1. Lambrecht J, Tacke F. Controversies and opportunities in the use of inflammatory markers for diagnosis or risk prediction in fatty liver disease. Front Immunol. 2021;11:634409. - PMC - PubMed