. 2023 Jun 1;108(6):1515-1529.
doi: 10.3324/haematol.2022.282250.

Somatic genetic alterations predict hematological progression in GATA2 deficiency

Affiliations

Somatic genetic alterations predict hematological progression in GATA2 deficiency

Laetitia Largeaud et al. Haematologica. .

Abstract

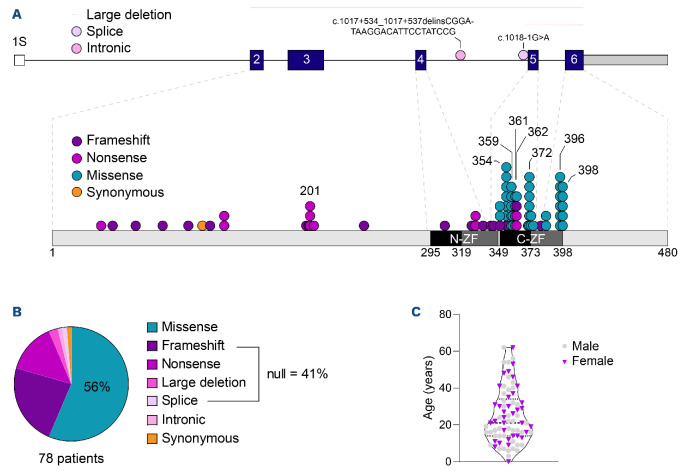
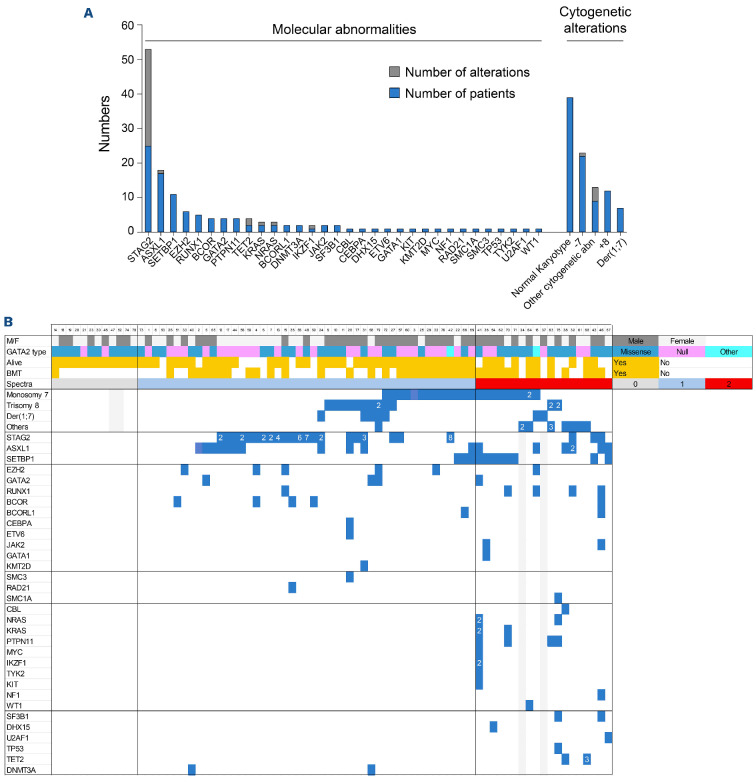
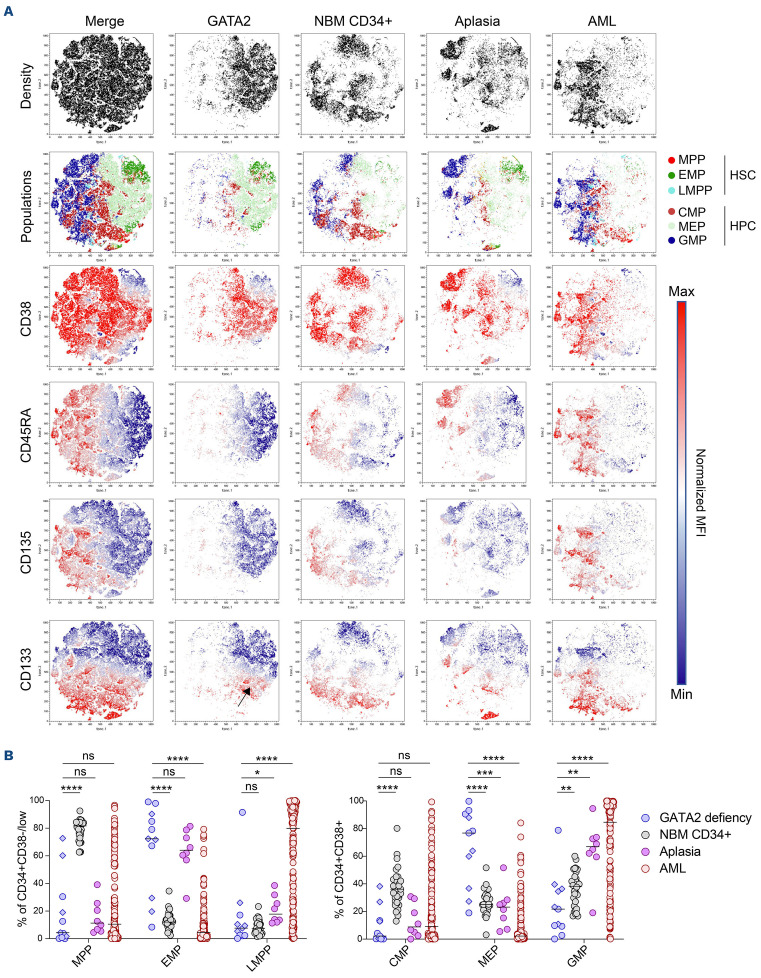
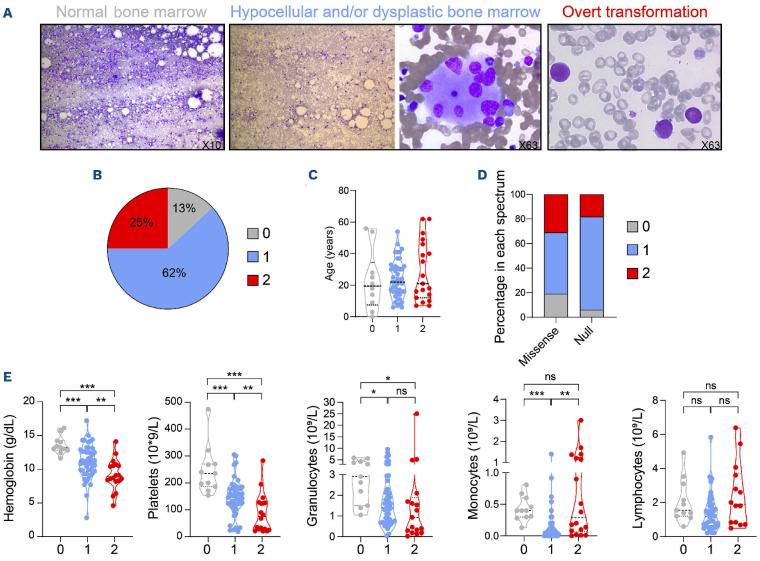
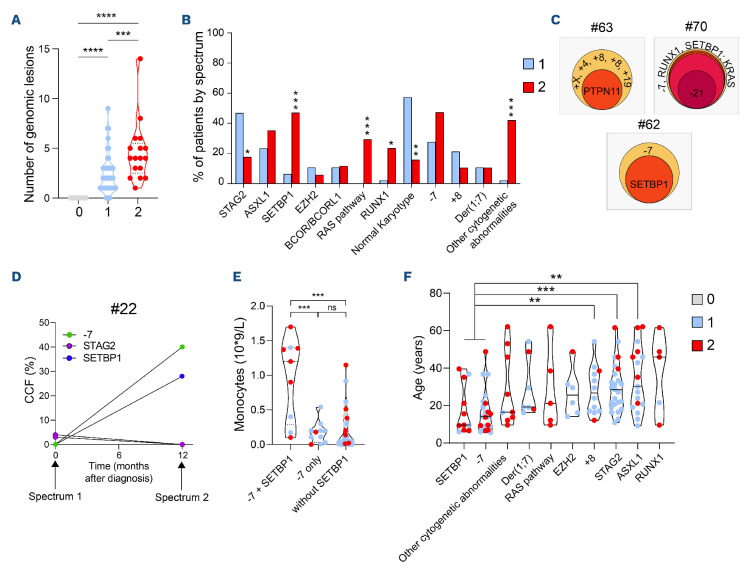
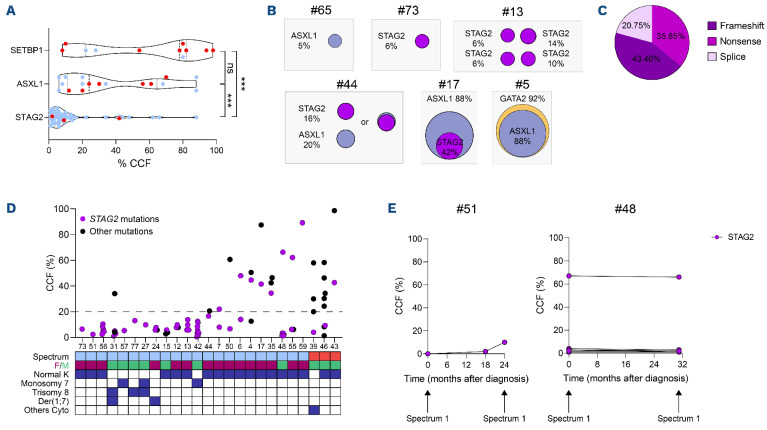
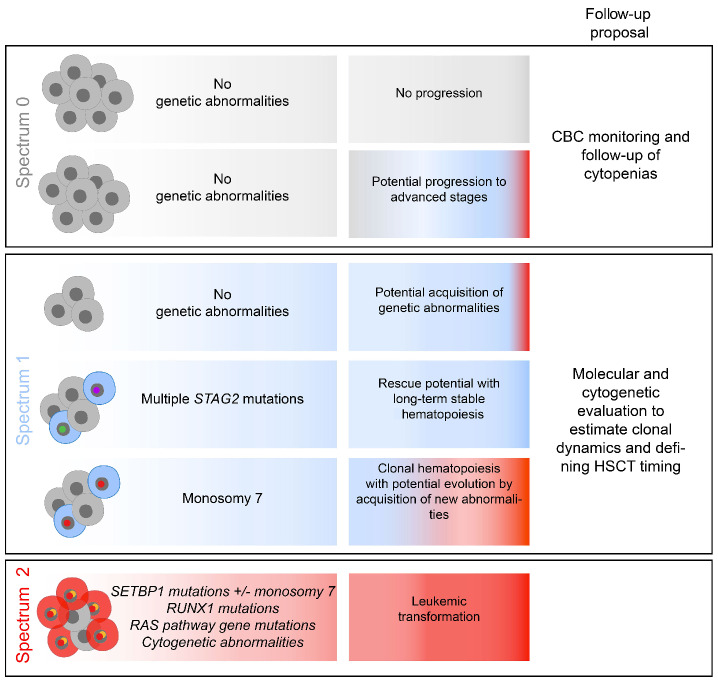
Germline GATA2 mutations predispose to myeloid malignancies resulting from the progressive acquisition of additional somatic mutations. Here we describe clinical and biological features of 78 GATA2-deficient patients. Hematopoietic stem and progenitor cell phenotypic characterization revealed an exhaustion of myeloid progenitors. Somatic mutations in STAG2, ASXL1 and SETBP1 genes along with cytogenetic abnormalities (monosomy 7, trisomy 8, der(1;7)) occurred frequently in patients with GATA2 germline mutations. Patients were classified into three hematopoietic spectra based on bone marrow cytomorphology. No somatic additional mutations were detected in patients with normal bone marrow (spectrum 0), whereas clonal hematopoiesis mediated by STAG2 mutations was frequent in those with a hypocellular and/or myelodysplastic bone marrow without excess blasts (spectrum 1). Finally, SETBP1, RAS pathway and RUNX1 mutations were predominantly associated with leukemic transformation stage (spectrum 2), highlighting their implications in the transformation process. Specific somatic alterations, potentially providing distinct selective advantages to affected cells, are therefore associated with the clinical/hematological evolution of GATA2 syndrome. Our study not only suggests that somatic genetic profiling will help clinicians in their management of patients, but will also clarify the mechanism of leukemogenesis in the context of germline GATA2 mutations.


Figures

Figure 1.
Figure 1.
Characterization of germline GATA2 mutations. (A) Distribution of coding germline GATA2 mutations across GATA2 protein. Predicted protein domains are indicated inside each bar (dark: link zinc finger domain, grey: enlarged zinc finger domain); each dot represents 1 single patient. Each color indicates a type of mutations (frameshift: purple; nonsense: magenta; missense: teal; synonymous: orange). (B) Proportion of germline GATA2 mutation types. (C) Distribution of patients (males, females) according to their age in years at the time of analysis.
Figure 2.
Figure 2.
GATA2 deficiency syndrome defines a distinct entity regarding molecular profiles. (A) Molecular and cytogenetic abnormalities in the cohort of 78 GATA2-mutated patients. (B) Somatic mutation occurrence. Summary of patients with GATA2 deficiency (n=78) organized by spectra (spectrum 0: grey, spectrum 1: blue and spectrum 2: red), germline GATA2 mutation type (missense: teal, null: fuchsia, other including synonymous and intronic mutations: turquoise), survival and bone marrow transplantation status and somatic mutation and cytogenetic status. Each vertical row represents 1 patient. Grey boxes indicate no data for that parameter. Cytogenetic abnormalities are grouped together in the same manner as the main molecular abnormalities (STAG2, ASXL1 and SETBP1). The number of abnormalities is indicated in each square. The other mutations are listed below including genes encoding transcription factors, splicing factors, chromatin modifiers, cohesin members, signaling pathway genes.
Figure 3.
Figure 3.
Phenotypical characterization of hematopoietic stem and progenitor cells revealed loss of heterogeneity associated with common myeloid and granulocyte macrophage progenitors exhaustion. (A) Comparison of hematopoietic stem and progenitor cell (HSPC) phenotypic profiles visualized by a non-linear dimensionality reduction technique (t-SNE) between GATA2 deficiency patients (GATA2, blue, n=11) and control patients without hematological diseases (normal bone marrow [NBM] CD34+, grey, n=22) or acute myeloid leukemia (AML) (red, n=155) or aplasia (purple, n=6) patients without germline GATA2 mutations. Merged samples are localized at the left plots. The first plot line represents density of each condition, the second line the distribution of the different HSC and hematopoietic progenitor cells (HPC) subpopulations, the lines below show normalized mean fluorescent intensity (MFI) according the color scale of markers (CD38, CD45RA, CD135 and CD133). The black arrow on the CD133 plot of GATA2 condition identifies of megakaryocyte erythroid progenitors (MEP)-expressing CD133 marker. (B) Proportion of HSPC populations in CD34+ CD38- compartment (erythroid/myeloid progenitors [EMP]: CD135- CD45RA-; multipotent progenitors [MPP]: CD135+ CD45RA-; lymphoid/myeloid primed progenitors [LMPP]: CD135+ CD45RA+) and CD34+ CD38+ compartment (MEP: CD135-CD45RA-; common myeloid progenitors [CMP]: CD135+ CD45RA-; granulocyte macrophage progenitors [GMP]: CD135+ CD45RA+) of GATA2-deficient patients (blue) compared with NBM CD34+ (grey), AML (red) and aplastic (purple) patients. Spectrum 0 (diamond), spectrum 1 (round); median and P values are calculated using non-parametric unpaired Mann-Whitney test ****P<0.001,***P<0.005 **, P<0.01, *P<0.05.
Figure 4.
Figure 4.
Classification in three hematological spectra based on cytological evaluation. (A) Representative pictures of normal density bone marrow defining spectrum 0 (left, objective 10x), hypocellular bone marrow (objective 10x) and an example of myelodysplastic-related changes: multinuclear megakaryocyte (objective 63x) reported in patients in spectrum 1 (middle), blast cells defining overt transformation for spectrum 2 including myelodysplastic syndromes (MDS) with excess of blasts, acute myeloid leukemia (AML) and chronic myelomonocytic leukemia (CMML) (objective 63x, right). (B) Proportion of patients in each spectrum (0, 1 and 2), P=not significant. (C) Distribution of patient age in each spectrum. (D) Percentage of patients with missense or null mutations in each spectrum. (E) Blood count parameters (hemoglobin level, platelet, granulocyte, monocyte and lymphocytes counts) of 78 patients in each spectrum. All data points represent each patient values according to spectra with median (wide dots) ± quartiles (small dots). P values are calculated using unpaired t-tests ***P<0.001, **P<0.01, *P<0.05.
Figure 5.
Figure 5.
Stratification of genetic abnormalities according hematological spectra. (A) Distribution of genomic alterations including molecular and cytogenetic abnormalities in each spectrum. (B) Proportion of patients in each spectrum according to their mutational and cytogenetic abnormalities (blue: spectrum 1; red: spectrum 2). (C) Clonal hierarchy of 3 patients at spectrum 2, evaluated thanks to cancer cell fraction (CCF). (D) Clonal dynamics evaluated by molecular and cytogenetic follow-up of one patient with two STAG2 mutations at diagnosis (spectrum 1) which disappeared 1 year later (spectrum 2), concomitantly to the appearance of a clone with monosomy 7 and a SETBP1 mutation. CCF (%) was evaluated using variant allelic frequency for mutations and polymorphisms located on chromosome 7 for monosomy 7. (E) Monocyte count in patients with the association of SETBP1 mutation and monosomy 7 (n=9) or the monosomy 7 only (n=11) or patients without SETBP1 mutations (n=45). (F) Median age in years of patients according their genetic profiles. Patients harboring the association monosomy 7 and SETBP1 mutation were compared to STAG2-mutated patients, patients with trisomy 8 and with ASXL1 mutation. All data points represent each patient values according to hematological spectra with median ± quartiles and P values are calculated using unpaired t-tests ***P<0.001, **P<0.01, *P<0.05.
Figure 6.
Figure 6.
Clonal hematopoiesis mediated by STAG2 mutations and clonal selection. (A) Comparison of cancer cell fraction (CCF) of the 3 main molecular abnormalities: SETBP1 (n=11), ASXL1 (n=17) and STAG2 (n=53) mutations. Blue and red dots correspond to spectra 1 and 2, respectively. (B) Representative examples of clonal hierarchy evaluated by CCF. (C) Proportion of the different STAG2 mutation types (n=53). (D) Percentage of STAG2 (purple) and the other (dark) mutation CCF from the 25 STAG2-mutated patients associated with the hematological spectrum (blue: spectrum 1; red: spectrum 2), sex (female: burgundy; male: green) and the cytogenetic profile (normal karyotype, monosomy 7, trisomy 8, der(1;7) and other cytogenetic abnormalities). The dotted line allows to visualize mutations with CCF less than or equal to 20%. (E) Clonal dynamic evaluated by longitudinal follow-up of 2 patients mutated only for STAG2.
Figure 7.
Figure 7.
Distinct pathways of somatic clonal progression in GATA2 deficient patients. Summary of the different possibilities of evolution according to the spectra. Proposal of a personalized follow-up of patients from each spectrum.

References

    1. Song WJ, Sullivan MG, Legare RD, et al. . Haploinsufficiency of CBFA2 causes familial thrombocytopenia with propensity to develop acute myelogenous leukaemia. Nat Genet. 1999;23(2):166-175. - PubMed
    1. Smith ML, Cavenagh JD, Lister TA, Fitzgibbon J. Mutation of CEBPA in familial acute myeloid leukemia. N Engl J Med. 2004;351(23):2403-2407. - PubMed
    1. Dickinson RE, Griffin H, Bigley V, et al. . Exome sequencing identifies GATA-2 mutation as the cause of dendritic cell, monocyte, B and NK lymphoid deficiency. Blood. 2011;118(10):2656-2658. - PMC - PubMed
    1. Hahn CN, Chong CE, Carmichael CL, et al. . Heritable GATA2 mutations associated with familial myelodysplastic syndrome and acute myeloid leukemia. Nat Genet. 2011;43(10):1012-1017. - PMC - PubMed
    1. Hsu AP, Sampaio EP, Khan J, et al. . Mutations in GATA2 are associated with the autosomal dominant and sporadic monocytopenia and mycobacterial infection (MonoMAC) syndrome. Blood. 2011;118(10):2653-2655. - PMC - PubMed

Publication types

Substances