Observational Study
. 2023 Mar 15;133(6):e166032.
doi: 10.1172/JCI166032.

Host immunological responses facilitate development of SARS-CoV-2 mutations in patients receiving monoclonal antibody treatments

Affiliations
Observational Study

Host immunological responses facilitate development of SARS-CoV-2 mutations in patients receiving monoclonal antibody treatments

Akshita Gupta et al. J Clin Invest. .

Abstract

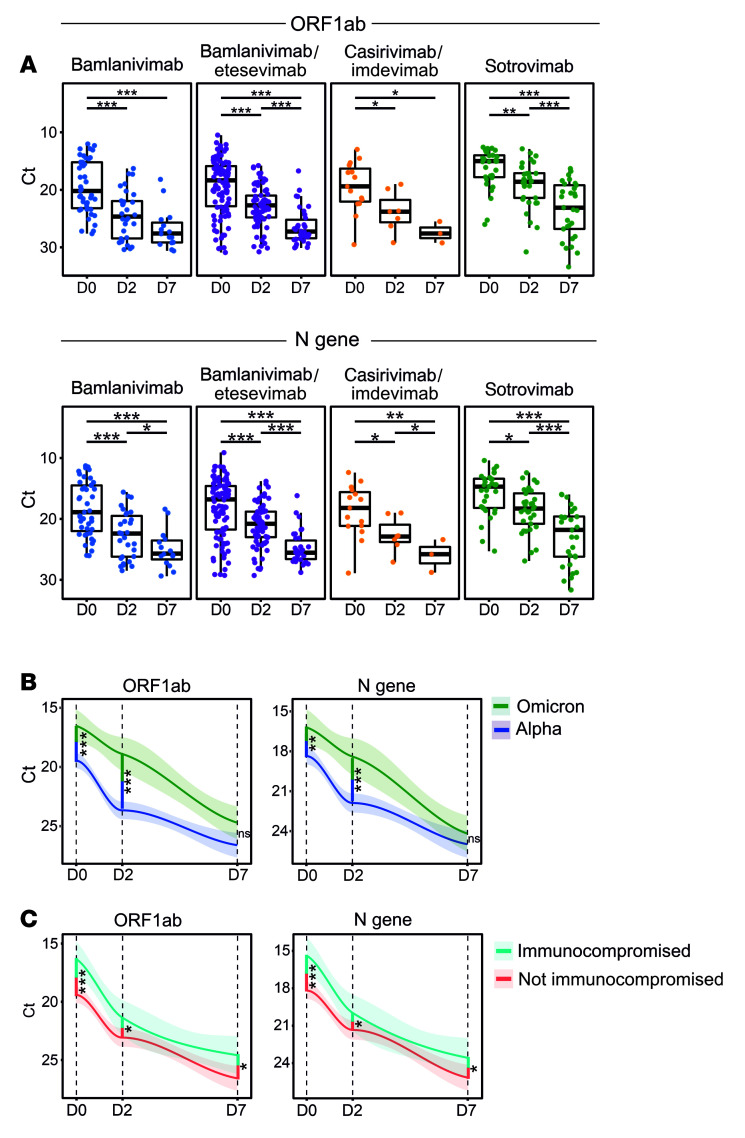
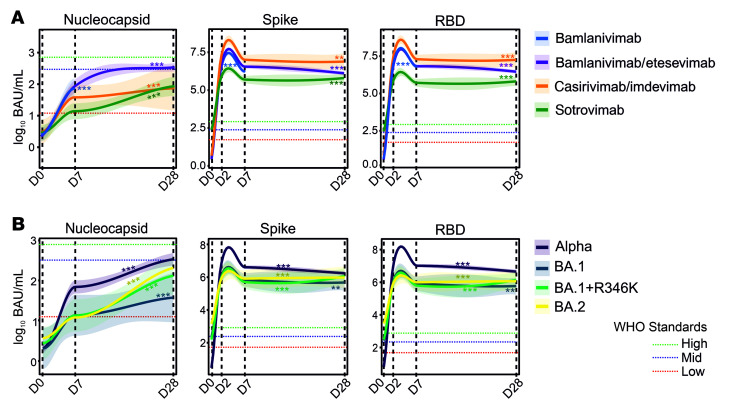
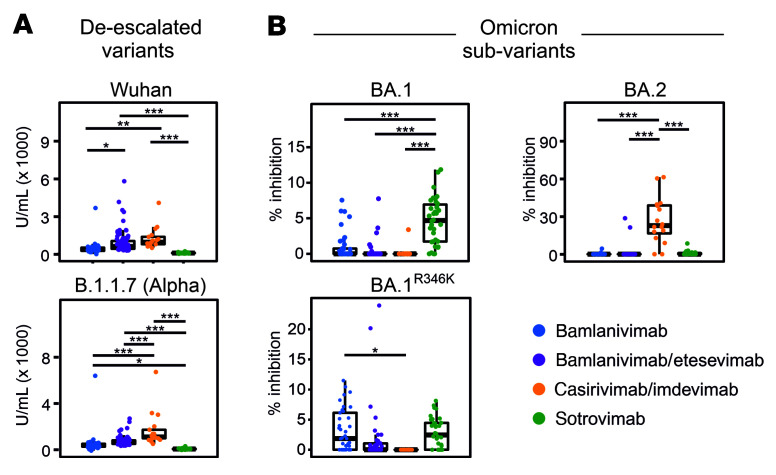
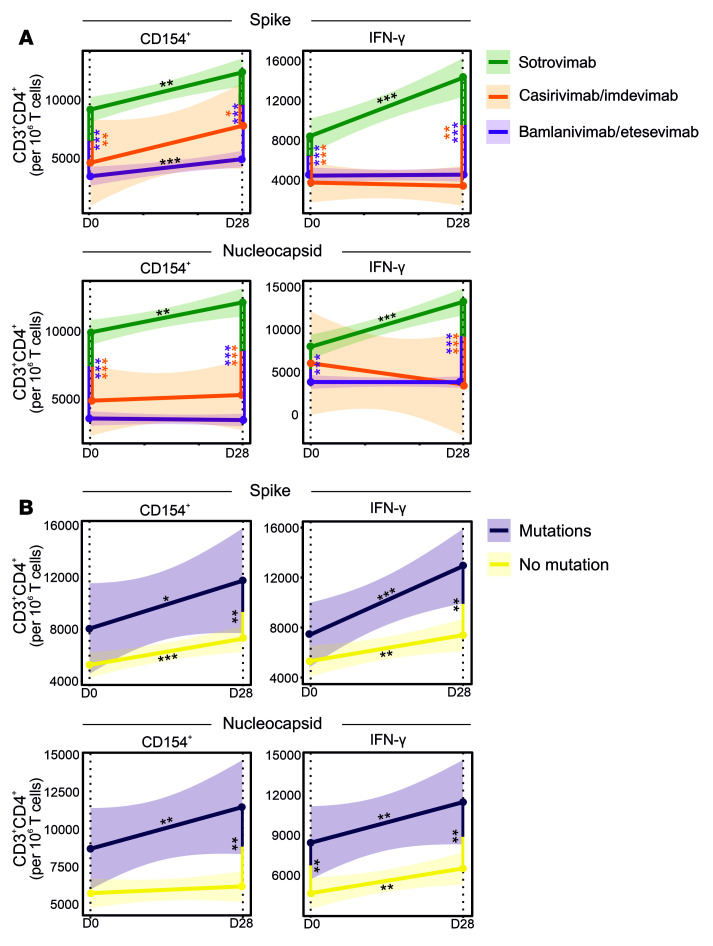
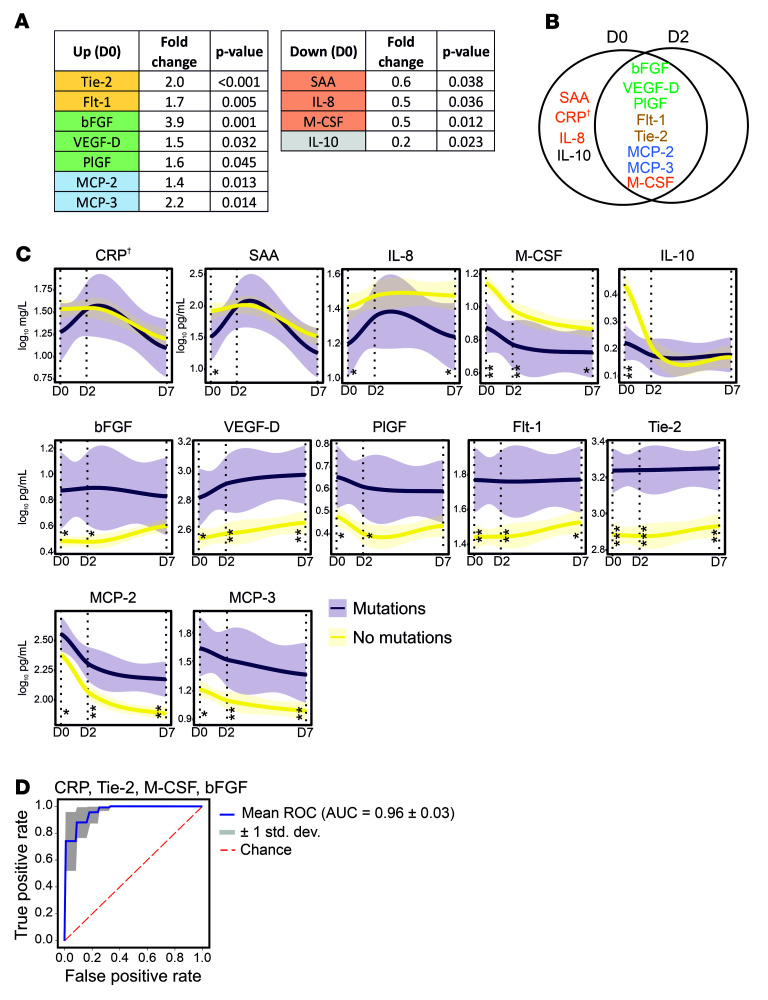
BackgroundThe role of host immunity in emergence of evasive SARS-CoV-2 Spike mutations under therapeutic monoclonal antibody (mAb) pressure remains to be explored.MethodsIn a prospective, observational, monocentric ORCHESTRA cohort study, conducted between March 2021 and November 2022, mild-to-moderately ill COVID-19 patients (n = 204) receiving bamlanivimab, bamlanivimab/etesevimab, casirivimab/imdevimab, or sotrovimab were longitudinally studied over 28 days for viral loads, de novo Spike mutations, mAb kinetics, seroneutralization against infecting variants of concern, and T cell immunity. Additionally, a machine learning-based circulating immune-related biomarker (CIB) profile predictive of evasive Spike mutations was constructed and confirmed in an independent data set (n = 19) that included patients receiving sotrovimab or tixagevimab/cilgavimab.ResultsPatients treated with various mAbs developed evasive Spike mutations with remarkable speed and high specificity to the targeted mAb-binding sites. Immunocompromised patients receiving mAb therapy not only continued to display significantly higher viral loads, but also showed higher likelihood of developing de novo Spike mutations. Development of escape mutants also strongly correlated with neutralizing capacity of the therapeutic mAbs and T cell immunity, suggesting immune pressure as an important driver of escape mutations. Lastly, we showed that an antiinflammatory and healing-promoting host milieu facilitates Spike mutations, where 4 CIBs identified patients at high risk of developing escape mutations against therapeutic mAbs with high accuracy.ConclusionsOur data demonstrate that host-driven immune and nonimmune responses are essential for development of mutant SARS-CoV-2. These data also support point-of-care decision making in reducing the risk of mAb treatment failure and improving mitigation strategies for possible dissemination of escape SARS-CoV-2 mutants.FundingThe ORCHESTRA project/European Union's Horizon 2020 research and innovation program.

Keywords: COVID-19; Cellular immune response.


Figures

Figure 1
Figure 1. Immunocompromised and Omicron-infected COVID-19 patients display higher viral loads after mAb administration.
RT-qPCR detection of SARS-CoV-2 was performed on nasopharyngeal swab samples collected on D0, D2, and D7 from patients treated with different therapeutic mAbs. (A) A steady increase in Ct values was observed over 7 days for all mAb-treated groups. Box-and-whisker plots indicate median (middle line), 25th and 75th percentiles (box boundary), and 5th and 95th percentiles (whiskers). All data points, including outliers, are displayed. (B) Overall, patients carrying Omicron (BA.1, BA1+R346K, or BA.2) displayed higher viral loads than patients carrying Alpha subvariants (B.1.1.7 or Q4). (C) Immunocompromised patients carried higher viral loads, irrespective of the infecting SARS-CoV-2 variant and mAb treatment. Line graphs in B and C represent smoothed conditional means, with shaded areas displaying 95% CIs for all measured time points. Cross-sectional and longitudinal statistical comparisons were performed using Mann-Whitney followed by Bonferroni’s post hoc correction. *P < 0.05; **P < 0.01; ***P < 0.001. NS, nonsignificant; D0, sample collected prior to mAb infusion; D2, 2 ± 1 days after mAb infusion; D7, 7 ± 2 days after mAb infusion. A limited number of nasopharyngeal swab samples were collected on D28 (n = 9) across all 4 mAb therapy groups and were therefore excluded from this analysis. See Supplemental Tables 2 and 3 for details on Ct values at each time point.
Figure 2
Figure 2. De novo SARS-CoV-2 S RBD mutations evolving under mAb pressure.
(A) Schematic quaternary structure of the SARS-CoV-2 S RBD protein when bound to the human (h)ACE2 receptor (PDB: 6M0J). Key RBD-binding sites of bamlanivimab, etesevimab, and sotrovimab are highlighted in the protein structure with corresponding colors. Binding sites common to all mAbs, including casirivimab and imdevimab, are indicated in red, whereas hACE2 is highlighted in blue. (B) SARS-CoV-2 genomes longitudinally isolated from patients receiving mAb therapy were screened for the emergence of de novo mutations resulting in amino acid substitutions in the S RBD region. Most commonly, escape mutants occurred in residues harbored within the respective mAb binding site. Pt, patient. (C) Patients developing S RBD mutations were found to harbor significantly higher viral loads at all time points. Cross-sectional statistical comparisons were performed using the Mann-Whitney test. Lines represent smoothed conditional means and shaded areas display 95% CIs for all measured time points. ***P < 0.005. For more details on nonsynonymous de novo changes and sample numbers, see Supplemental Figures 1 and 7 and Supplemental Table 4.
Figure 3
Figure 3. Temporal evolution of anti-N, anti-S, and anti-RBD serology titers in patients receiving mAb therapies.
(A) Natural immunity was assessed based on anti-N titers, revealing a gradual increase through D28. High anti-S and anti-RBD titers due to therapeutic mAb administration persisted from D2 to D28 in patients in all treatment groups. (B) Similarly, high anti-S and anti-RBD titers were observed in patients carrying Omicron subvariants (BA.1, BA1+R346K, or BA.2) receiving sotrovimab monotherapy. Red, green, and blue dotted lines indicate SARS-CoV-2 WHO reference standard values for low, medium, and high antibody titers, respectively. Line graphs in A and B represent conditional means and shaded areas displaying 95% CIs for all measured time points. Linear mixed models were utilized to investigate evolution of antibody titers over time for different mAbs, with asterisks indicating significance of the slopes of the curves. **P < 0.01, ***P < 0.001. For more details on serology in patients with or without vaccination and sample numbers, see Supplemental Table 5 and Supplemental Figure 7.
Figure 4
Figure 4. Anti-S neutralization capacity of bamlanivimab, bamlanivimab/etesevimab, casirivimab/imdevimab, and sotrovimab.
Neutralization capacity was measured against (A) deescalated variants and (B) Omicron subvariants on D2. Sotrovimab monotherapy proved most effective in neutralizing BA.1. Bamlanivimab showed increased neutralizing activity against BA.1. Casirivimab/imdevimab combination therapy proved highly effective in neutralization of BA.2. Box-and-whisker plots indicate median (middle line), 25th and 75th percentiles (box boundary), and 5th and 95th percentiles (whiskers). All data points, including outliers, are displayed. Statistical assessments were performed using pairwise 2-tailed t tests with Bonferroni’s post hoc correction. *P < 0.05; **P < 0.01; ***P < 0.001. For details on tested variants of concern and sample numbers, see Supplemental Table 6 and Supplemental Figure 7.
Figure 5
Figure 5. Longitudinal T cell responses in patients receiving mAb therapy.
Evolution of IFN-γ and CD154 expression in SARS-CoV-2 S– and Nucleocapsid–stimulated CD4+ T cells in patients was studied over 28 days after receiving bamlanivimab/etesevimab, casirivimab/imdevimab, or sotrovimab. (A) Patients receiving sotrovimab therapy show a consistent significant increase in T cell expression during the first 28 days after mAb administration. For the utilized gating strategy, refer to Supplemental Figure 8. (B) Patients with de novo mutations in the SARS-CoV-2 S RBD region show an increased T cell expression compared with those without. Linear mixed models were utilized to investigate evolution of Th cell immunity over time between the different mAb groups. Regression curves represent smoothed conditional means and shaded areas display 95% CIs for all measured time points, with asterisks on lines representing the significance of the slopes. Vertical lines with asterisks represent the significance of pairwise comparisons between patients with or without de novo mutations before mAb treatment (D0) and after 28 days of treatment (D28). *P < 0.05; **P < 0.01; ***P < 0.001.
Figure 6
Figure 6. Circulating immune-related biomarkers (CIBs) in COVID-19 patients receiving mAb therapy.
(A) Several CIBs were significantly up- or downregulated on D0 in COVID-19 patients who developed SARS-CoV-2 S RBD mutations after administration of mAb treatments, compared with those who did not. (B) Eleven CIBs were significantly altered on D0 in patients with de novo S RBD mutations, for which the majority (n = 8) were also altered on D2. (C) Temporal evolution of CIBs altered in patients, with or without de novo mutations, receiving mAb therapy through day 7 after treatment. Lines represent smoothed conditional means and shaded areas display 95% CIs for all measured time points. P values refer to significance of the slope of the regression lines. Vertical lines with asterisks represent the significant difference between CIB levels at the specified time points. (D) Receiving operator characteristic (ROC) curve in a random forest classifier model with synthetic minority oversampling technique (SMOTE) for the prediction of mutation versus no-mutation are depicted for D0. *P < 0.05, **P < 0.01, ***P < 0.001. †Not significant. For details on the progression of CIBs from D0 to D7 and sample numbers, see Supplemental Figures 5 and 7.

Comment in

  • SARS-CoV-2 variants resistant to monoclonal antibodies in immunocompromised patients constitute a public health concern

References

    1. Harvey WT, et al. SARS-CoV-2 variants, spike mutations and immune escape. Nat Rev Microbiol. 2021;19(7):409–424. doi: 10.1038/s41579-021-00573-0. - DOI - PMC - PubMed
    1. Liu Z, et al. Identification of SARS-CoV-2 spike mutations that attenuate monoclonal and serum antibody neutralization. Cell Host Microbe. 2021;29(3):477–488. doi: 10.1016/j.chom.2021.01.014. - DOI - PMC - PubMed
    1. Ai J, et al. Antibody evasion of SARS-CoV-2 Omicron BA.1, BA.1.1, BA.2, and BA.3 sub-lineages. Cell Host Microbe. 2022;30(8):1077–1083. doi: 10.1016/j.chom.2022.05.001. - DOI - PMC - PubMed
    1. Huang M, et al. Atlas of currently available human neutralizing antibodies against SARS-CoV-2 and escape by Omicron sub-variants BA.1/BA.1.1/BA.2/BA.3. Immunity. 2022;55(8):1501–1514. doi: 10.1016/j.immuni.2022.06.005. - DOI - PMC - PubMed
    1. Andreano E, et al. SARS-CoV-2 escape from a highly neutralizing COVID-19 convalescent plasma. Proc Natl Acad Sci U S A. 2021;118(36):e2103154118. doi: 10.1073/pnas.2103154118. - DOI - PMC - PubMed

Publication types