. 2023 Apr 11;51(6):2655-2670.
doi: 10.1093/nar/gkad043.

SMAD3 promotes expression and activity of the androgen receptor in prostate cancer

Affiliations

SMAD3 promotes expression and activity of the androgen receptor in prostate cancer

Hee-Young Jeon et al. Nucleic Acids Res. .

Abstract

Overexpression of androgen receptor (AR) is the primary cause of castration-resistant prostate cancer, although mechanisms upregulating AR transcription in this context are not well understood. Our RNA-seq studies revealed that SMAD3 knockdown decreased levels of AR and AR target genes, whereas SMAD4 or SMAD2 knockdown had little or no effect. ChIP-seq analysis showed that SMAD3 knockdown decreased global binding of AR to chromatin. Mechanistically, we show that SMAD3 binds to intron 3 of the AR gene to promote AR expression. Targeting these binding sites by CRISPRi reduced transcript levels of AR and AR targets. In addition, ∼50% of AR and SMAD3 ChIP-seq peaks overlapped, and SMAD3 may also cooperate with or co-activate AR for AR target expression. Functionally, AR re-expression in SMAD3-knockdown cells partially rescued AR target expression and cell growth defects. The SMAD3 peak in AR intron 3 overlapped with H3K27ac ChIP-seq and ATAC-seq peaks in datasets of prostate cancer. AR and SMAD3 mRNAs were upregulated in datasets of metastatic prostate cancer and CRPC compared with primary prostate cancer. A SMAD3 PROTAC inhibitor reduced levels of AR, AR-V7 and AR targets in prostate cancer cells. This study suggests that SMAD3 could be targeted to inhibit AR in prostate cancer.


Figures

Figure 1.
Figure 1.
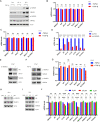
SMAD3 promotes the expression of AR and AR targets. (A) Volcano plot showing the differentially expressed genes between control and SMAD3-KD Rv1 cells in the RNA-seq analysis. (B) GO analysis of the downregulated genes after SMAD3 KD showing enrichment of the AR signaling pathway. (C) BART analysis of the downregulated genes after SMAD3 KD. AR is predicted to be a top transcription factor altered after SMAD3 KD. (D, E) Real-time RT-PCR results showing the reduced mRNA levels of AR, AR-V7 and example AR targets in the SMAD3-KD Rv1 (D) or C4-2 (E) cells. Quantification was presented as mean ± SD (n = 3), and t test was used for statistical analysis (***P < 0.001). (F) Western blots showing the reduced level of AR and AR-V7 in the SMAD3-KD Rv1 or C4-2 cells. (G) Real-time RT-PCR results showing the reduced mRNA level of AR and AR-V7 in the SMAD3-KD LN95 cells. Quantification was presented as mean ± SD (n = 3), and t test was used for statistical analysis (**P < 0.01; ***P < 0.001). (H) Western blots showing the reduced level of AR and AR-V7 in the SMAD3-KD LN95 cells.
Figure 2.
Figure 2.
SMAD4 or SMAD2 has little or no effect on the expression of AR and AR targets. (A, B) Volcano plot of RNA-seq results showing the differentially expressed genes upon KD of SMAD2 (A) or SMAD4 (B) in Rv1 cells. (C) Heatmap showing the altered level of AR and classic AR target genes in the RNA-seq analysis of SMAD3-KD, SMAD4-KD or SMAD2-KD Rv1 cells. The FPKM value of RNA-seq results was log2 transformed and used for the heatmap preparation using the pheatmap package in R. (D) GO analysis of the downregulated genes after SMAD2 KD. (E) BART analysis of the downregulated genes after SMAD2 KD to predict the altered transcription factors. (F) GO analysis of the downregulated genes after SMAD4 KD. (G) BART analysis of the downregulated genes after SMAD4 KD to predict the altered transcription factors.
Figure 3.
Figure 3.
TGF-β treatment has no effect on the expression of AR and AR targets. (A) TGF-β did not induce phospho-SMAD3 or phospho-SMAD2 in Rv1 or C4-2 cells. Indicated cells were treated with 10 ng/ml of TGF-β for 1 h. Western blot analysis was performed using the indicated antibodies. (B and C) Real-time RT-PCR results showing that TGF-β treatment (10 ng/ml for 6 h) of Rv1 (B) or C4-2 (C) cells had no effect on transcript levels of AR, AR-V7 and AR targets. Quantification was presented as mean ± SD (n = 3), and t test was used for statistical analysis (ns, not significant). (D) Real-time RT-PCR results showing the decreased transcript levels of AR, AR-V7 and AR targets in the SMAD3-KD VCaP cells. Quantification was presented as mean ± SD (n = 3), and t test was used for statistical analysis (***P < 0.001). (E) Western blots showing the decreased level of AR and AR-V7 in the SMAD3-KD VCaP cells. (F) Western blots showing the increased levels of phospho-SMAD3 and phospho-SMAD2 in VCaP cells after TGF-β treatment (10 ng/ml for 1 h). (G) Real-time RT-PCR analysis of VCaP cells showing no effect of TGF-β treatment (10 ng/ml for 6 h) on transcript levels of AR, AR-V7 and AR targets relative to untreated cells. Quantification was presented as mean ± SD (n = 3), and t test was used for statistical analysis (ns, not significant; *P < 0.05). (H) Decreased levels of phospho-SMAD3 after treating PC3 cells with SIS3 for 24 h. (I) No changes of AR or AR-V7 levels after treating Rv1 cells with SIS3 for 24 h. (J) Effect of SIS3 treatment on transcript levels of AR, AR-V7 and AR target genes. Rv1 cells were treated with indicated concentration of SIS3 for 24 h before real-time RT-PCR analysis. Quantification was presented as mean ± SD (n = 3), and ANOVA was used for statistical analysis (ns, not significant; ***P < 0.001).
Figure 4.
Figure 4.
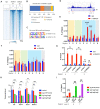
SMAD3 binds to intron 3 of AR gene to promote AR mRNA expression. (A) Heatmap showing two replicates of SMAD3 ChIP-seq peaks relative to IgG negative control antibody. (B) SMAD3 ChIP-seq peak annotation. (C) The Homer motif analysis showing the significant enrichment of SBE motifs on SMAD3 peaks. (D) Image showing the SMAD3 ChIP-seq peaks at the AR gene. The red lines and numbers indicate the nine regions analyzed by ChIP-PCR as described in (E). (E) ChIP-PCR of SMAD3 showing the enrichment of SMAD3 at regions 6 and 7 that are located at the center of the major SMAD3 ChIP-seq peak. ChIP assays were performed on Rv1 cells with control and SMAD3 antibodies. Precipitated chromatin was analyzed by qPCR for the nine regions of AR gene as indicated in D. % of input was calculated and presented as mean ± SD (n = 3), and t test was used for statistical analysis (***P < 0.001). The comparison at other regions (1–5,8,9) was not significant. (F) ChIP-PCR of SMAD4 showing no enrichment of SMAD4 at regions 6 and 7. ChIP assays were performed with control and SMAD4 antibodies as described in E. % of input was calculated and presented as mean ± SD (n = 3), and t test was used for statistical analysis. The comparison at each of the 9 regions was not significant. (G) ChIP-PCR of SMAD3 showing the similar SMAD3 enrichment at regions 6 and 7 of AR gene between control and SMAD4-KD Rv1 cells. % of input was calculated and presented as mean ± SD (n = 3), and ANOVA was used for statistical analysis (ns, not significant). Region 9 serves as a negative control region for SMAD3 binding. (H) Real-time RT-PCR results showing that CRISPRi constructs targeting region 6 or 7 reduced the mRNA levels of AR, AR-V7 and AR targets in Rv1 cells. 3 sgRNAs (sg1,sg2,sg3) were simultaneously used to target the three SBEs at or near region 6. Three sgRNAs (sg4,sg5,sg6) were simultaneously used to target the 4 SBEs at region 7. Rv1 cells expressing the indicated CRISPRi constructs were analyzed by the real-time RT-PCR analysis of indicated genes. Quantification was presented as mean ± SD (n = 3), and ANOVA was used for statistical analysis (ns, not significant; *P < 0.05; **P < 0.01; ***P < 0.001). (I) ChIP-PCR of Cas9 showing the enrichment of Cas9 at AR exon 2, region 6 or 7 in the CRISPRi-expressing Rv1 cells as described in H. % of input was calculated and presented as mean ± SD (n = 3), and t test was used for statistical analysis (ns, not significant; ***P < 0.001).
Figure 5.
Figure 5.
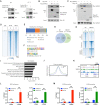
Overlaps of SMAD3 peaks and AR peaks in the ChIP-seq analysis. (A) Co-immunoprecipitation (Co-IP) of AR with SMAD3 in Rv1 or C4-2 cells. SMAD3 was immunoprecipitated from cells and analyzed by western blotting for co-precipitation of AR. Trueblot secondary antibodies were used in the western blots. (B) The C-terminal MH2 domain of SMAD3 interacted with AR. Myc-AR was co-expressed with Flag-tagged SMAD3 fragments (WT, Δ C mutant lacking the C-terminal MH2 domain, or Δ N mutant lacking the N-terminal MH1 domain) in 293T cells. Flag IP was performed and analyzed by western blotting with Flag or myc antibodies. (C) N-TAD domain of AR interacted with SMAD3. Myc-SMAD3 was co-expressed with the Flag-tagged AR fragments (N-terminal transactivation domain, N-TAD; DNA binding domain, DBD; Ligand-binding domain, LBD) in 293T cells, and analyzed as described in (B). (D) Heatmap showing two replicates of AR ChIP-seq peaks relative to IgG negative control antibody. (E) AR ChIP-seq peak annotation. (F) The Homer motif analysis showing the significant enrichment of ARE or AR half-site motifs on AR peaks. (G) Venn diagram showing the overlap of AR peaks and SMAD3 peaks in the ChIP-seq analysis. Cut&Run ChIP-seq studies were performed on Rv1 cells using AR or SMAD3 antibodies. Peak calling identified 12745 AR peaks and 11779 SMAD3 peaks. The overlapping of AR and SMAD3 peaks was determined by the ChIPpeakAnno package in R. (H) Heatmap showing the AR enriched peaks, common peaks and SMAD3 enriched peaks. (I) GO analysis of the genes associated with the common peaks between AR and SMAD3. (J) Distribution of AR (blue) and SMAD3 (green) ChIP-seq peak signal near the common peak center. (K) Example signal track image showing the SMAD3 peaks and AR peaks at the KLK3 enhancer or KLK2 promoter, which is indicated with an arrow. (L and M) ChIP-PCR showing the enrichment of AR and SMAD3 at KLK3 enhancer (L) or KLK2 promoter (M) of C4-2 cells after androgen treatment. ChIP assays were performed with control, AR or SMAD3 antibodies. Precipitated chromatin was analyzed by qPCR for KLK3 enhancer or KLK2 promoter. % of input was calculated and presented as mean ± SD (n = 3), and ANOVA was used for statistical analysis (ns, not significant; ***P < 0.001).
Figure 6.
Figure 6.
SMAD3 KD decreases the global ChIP-seq signal of AR. (A) Alteration of AR ChIP-seq peaks after SMAD3 KD in Rv1 cells. Cut&Run ChIP-seq studies were performed on Rv1 cells (control and SMAD3 KD) using AR antibodies. The alteration of AR peaks is shown in the Venn diagram including the control-enriched peaks, common peaks and SMAD3-KD-enriched peaks. (B) The genome distribution of AR peaks in control (n = 13073) and SMAD3-KD (n = 3997) Rv1 cells. (C) Heatmap showing the AR ChIP-seq peaks in control and SMAD3-KD Rv1 cells including the control-enriched peaks, common peaks and SMAD3-KD-enriched peaks. (D) Example signal track image showing the AR peak at KLK3 enhancer, KLK2 promoter or NKX3-1 promoter (indicated with an arrow) in control and SMAD3-KD Rv1 cells.
Figure 7.
Figure 7.
Re-expression of AR partly rescues the AR target expression and growth of SMAD3-KD PCa cells. (A) Western blot showing re-expression of AR and AR-V7 in the SMAD3-KD Rv1 cells. Optimal amounts of lentivirus were used to restore the expression of AR and AR-V7 in the SMAD3-KD cells to the levels seen in control cells. (B) Real-time RT-PCR results showing that re-expression of AR and AR-V7 in the SMAD3-KD Rv1 cells partly rescued the expression of example AR targets. Quantification was presented as mean ± SD (n = 3), and ANOVA was used for statistical analysis (**P < 0.01; ***P < 0.001). (C and D) Re-expression of AR and AR-V7 in the SMAD3-KD Rv1 cells partly rescued colony formation in cell-culture plates. The indicated cells were seeded at low density and maintained for 2 weeks. Colony numbers were scored in the 12 high-power fields. The example image represents 4 high-power fields. Colony number per field was presented as mean ± SD (n = 12), and ANOVA was used for statistical analysis (***P < 0.001). (E and F) Re-expression of AR and AR-V7 in the SMAD3-KD Rv1 cells partly rescued the colony formation in soft agar. The indicated cells were grown in soft agar for 3 weeks and colony numbers were scored in 12 high-power fields. The example image represents 1 high-power field. Colony number per field was presented as mean ± SD (n = 12), and ANOVA was used for statistical analysis (**P < 0.01; ***P < 0.001). (G) Western blot showing re-expression of AR in the SMAD3-KD C4-2 cells. (H) Real-time RT-PCR results showing that re-expression of AR in the SMAD3-KD C4-2 cells partly rescued the expression of example AR targets. Quantification was presented as mean ± SD (n = 3), and ANOVA was used for statistical analysis (**P < 0.01; ***P < 0.001). (I) Re-expression of AR in the SMAD3-KD C4-2 cells partly rescued the colony formation in cell-culture plates. The procedure is as described in C and D. Colony numbers were scored in 8 high-power fields. Colony number per field was presented as mean ± SD (n = 8), and ANOVA was used for statistical analysis (***P < 0.001). (J) Re-expression of AR in the SMAD3-KD C4-2 cells partly rescued the colony formation in soft agar. The procedure is as described in E and F. Colony number per field was presented as mean ± SD (n = 12), and ANOVA was used for statistical analysis (***P < 0.001). (K and L) Re-expression of AR and AR-V7 in the SMAD3-KD Rv1 cells partly rescued the xenograft tumor formation. The indicated cells (1 × 106) were subcutaneously injected into athymic nude mice (n = 10 per group). Xenograft tumors were collected at 5 weeks post injection. The image (K) and weight (L) of xenograft tumors are shown. Tumor weight was presented as mean ± SD (n = 10), and ANOVA was used for statistical analysis (**P < 0.01; ***P < 0.001).
Figure 8.
Figure 8.
SMAD3 promotes the expression of AR mRNA in human PCa and can be targeted with PROTAC inhibitor. (A) The SMAD3 peak in AR intron 3 overlapped with the H3K27ac peak in human PCa cells. The H3K27ac peaks in AR upstream enhancer are also shown. The indicated datasets of H3K27ac ChIP-seq were download from GEO database and visualized by IGV software. (B) H3K27ac peaks in AR upstream enhancer and AR intron 3 enhancer in a published dataset of 8 CRPC PDX samples. (C) ATAC-seq peaks in AR upstream enhancer and AR intron 3 enhancer in a published dataset of 6 PCa PDX samples. (D) Positive correlation (Pearson correlation, R = 0.29, P-value = 2.9e-11) between AR mRNA and SMAD3 mRNA in the TCGA PCa dataset (n = 492). The correlation analysis was performed using the web server of GEPIA2. (E and F) Upregulation of AR mRNA and SMAD3 mRNA in metastatic PCa (E) or CRPC (F) relative to the primary PCa. The indicated datasets of profiling array studies on human PCa tissues were downloaded from the GEO database. Cai dataset includes 22 primary PCa and 29 metastatic PCa. Chandra dataset includes 207 primary PCa and 13 CRPC. The intensity values of AR and SMAD3 were Log2 transformed, and the mean values of the indicated PCa groups were compared. Quantification was presented as mean ± SD, and t test was used for statistical analysis (**P < 0.01; ***P < 0.001). (G and H) Partial knockdown of SMAD3 reduced the levels of AR mRNA (G) and protein (H) in the enzalutamide-resistant C4-2B cells (EnzR). Quantification was presented as mean ± SD (n = 3), and ANOVA was used for statistical analysis (**P < 0.01; ***P < 0.001). (I and J) A SMAD3 PROTAC inhibitor decreased levels of AR, AR-V7 and AR targets. Rv1 cells were treated with the indicated concentration of SMAD3 PROTAC inhibitors for 24 hours before western blot (I) or real-time RT-PCR analysis (J). Quantification was presented as mean ± SD (n = 3), and ANOVA was used for statistical analysis (ns, not significant; *P < 0.05; **P < 0.01; ***P < 0.001).

References

    1. Fizazi K., Scher H.I., Molina A., Logothetis C.J., Chi K.N., Jones R.J., Staffurth J.N., North S., Vogelzang N.J., Saad F.et al. .. Abiraterone acetate for treatment of metastatic castration-resistant prostate cancer: final overall survival analysis of the COU-AA-301 randomised, double-blind, placebo-controlled phase 3 study. Lancet Oncol. 2012; 13:983–992. - PubMed
    1. Scher H.I., Fizazi K., Saad F., Taplin M.E., Sternberg C.N., Miller K., de Wit R., Mulders P., Chi K.N., Shore N.D.et al. .. Increased survival with enzalutamide in prostate cancer after chemotherapy. N. Engl. J. Med. 2012; 367:1187–1197. - PubMed
    1. Watson P.A., Arora V.K., Sawyers C.L.. Emerging mechanisms of resistance to androgen receptor inhibitors in prostate cancer. Nat. Rev. Cancer. 2015; 15:701–711. - PMC - PubMed
    1. Chen C.D., Welsbie D.S., Tran C., Baek S.H., Chen R., Vessella R., Rosenfeld M.G., Sawyers C.L.. Molecular determinants of resistance to antiandrogen therapy. Nat. Med. 2004; 10:33–39. - PubMed
    1. Robinson D., Van Allen E.M., Wu Y.M., Schultz N., Lonigro R.J., Mosquera J.M., Montgomery B., Taplin M.E., Pritchard C.C., Attard G.et al. .. Integrative clinical genomics of advanced prostate cancer. Cell. 2015; 161:1215–1228. - PMC - PubMed

Publication types

MeSH terms