. 2023 Apr;64(4):1074-1086.
doi: 10.1111/epi.17525. Epub 2023 Feb 17.

A library of quantitative markers of seizure severity

Affiliations

A library of quantitative markers of seizure severity

Sarah J Gascoigne et al. Epilepsia. 2023 Apr.

Abstract

Objective: Understanding fluctuations in seizure severity within individuals is important for determining treatment outcomes and responses to therapy, as well as assessing novel treatments for epilepsy. Current methods for grading seizure severity rely on qualitative interpretations from patients and clinicians. Quantitative measures of seizure severity would complement existing approaches to electroencephalographic (EEG) monitoring, outcome monitoring, and seizure prediction. Therefore, we developed a library of quantitative EEG markers that assess the spread and intensity of abnormal electrical activity during and after seizures.

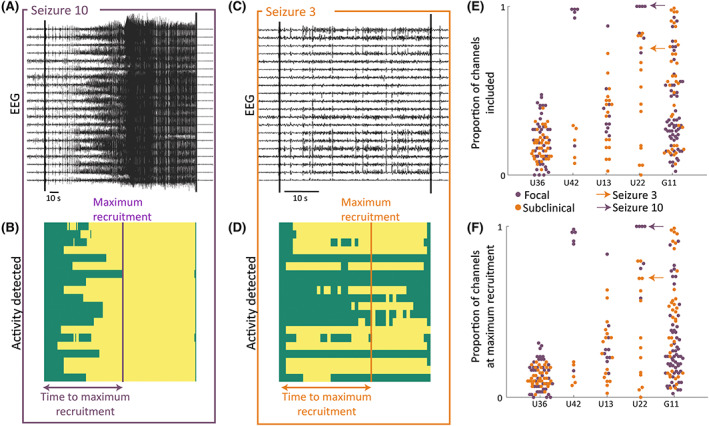
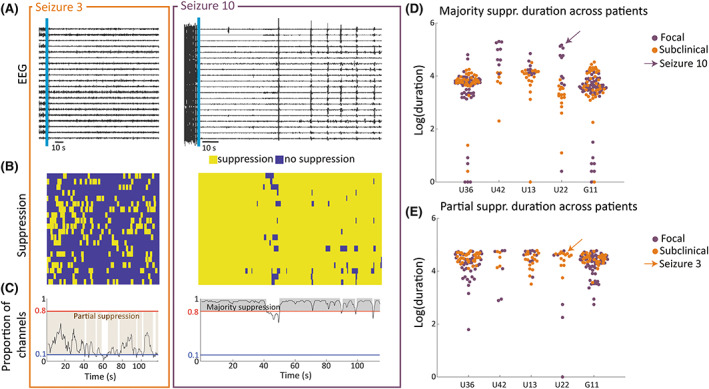
Methods: We analyzed intracranial EEG (iEEG) recordings of 1009 seizures from 63 patients. For each seizure, we computed 16 markers of seizure severity that capture the signal magnitude, spread, duration, and postictal suppression of seizures.

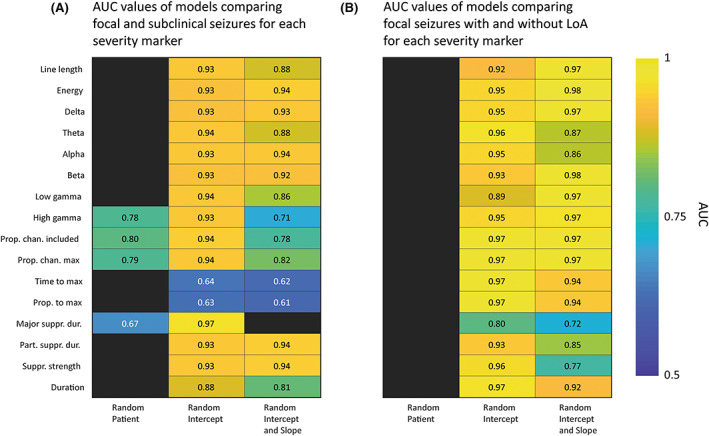
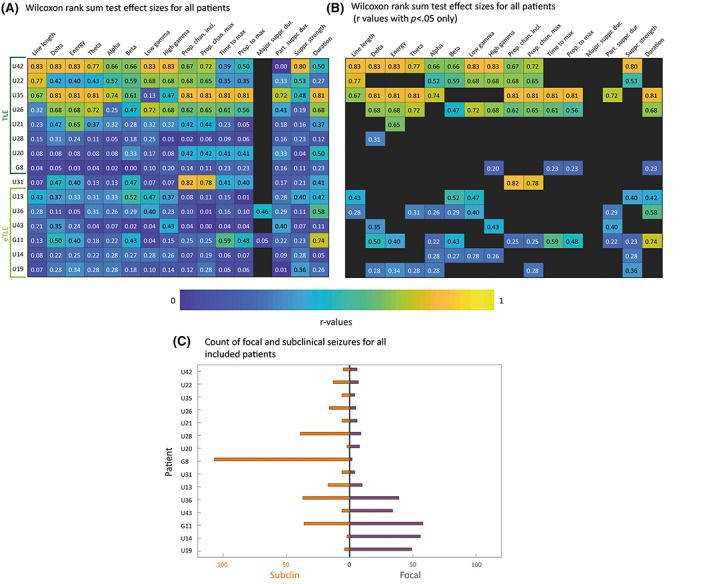
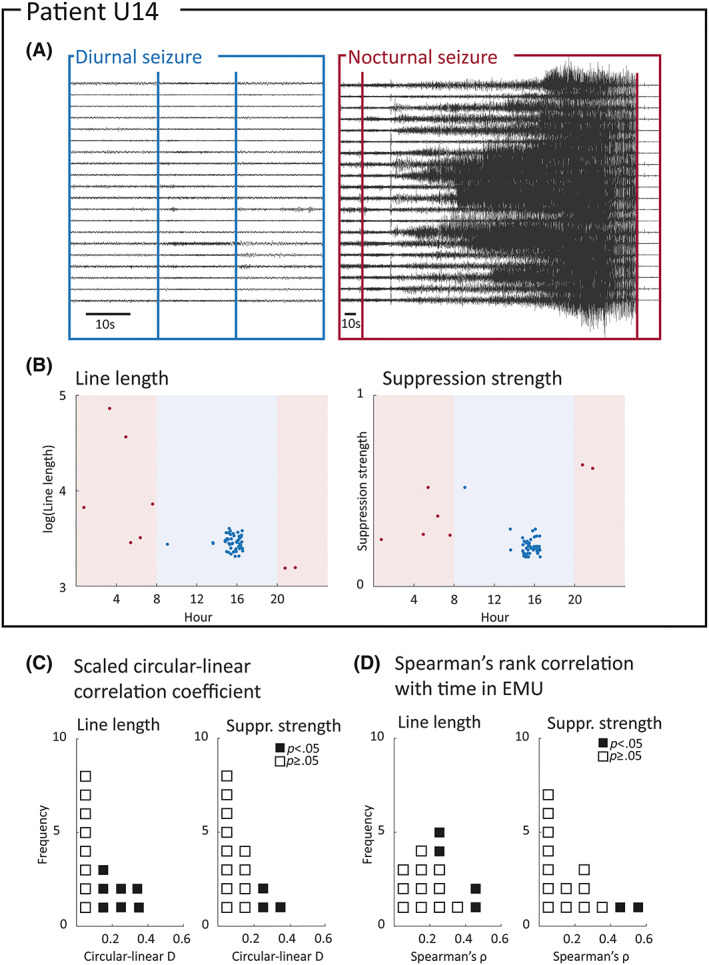
Results: Quantitative EEG markers of seizure severity distinguished focal versus subclinical seizures across patients. In individual patients, 53% had a moderate to large difference (rank sum r > .3 , p < .05 ) between focal and subclinical seizures in three or more markers. Circadian and longer term changes in severity were found for the majority of patients.

Significance: We demonstrate the feasibility of using quantitative iEEG markers to measure seizure severity. Our quantitative markers distinguish between seizure types and are therefore sensitive to established qualitative differences in seizure severity. Our results also suggest that seizure severity is modulated over different timescales. We envisage that our proposed seizure severity library will be expanded and updated in collaboration with the epilepsy research community to include more measures and modalities.

Keywords: computational neurophysiology; electroencephalography (EEG); seizure severity.


Conflict of interest statement

None of the authors has any conflict of interest to disclose.

Figures

FIGURE 1
FIGURE 1
Visualizing the workflow for calculating peak markers for example patient U22. (A) Intracranial electroencephalographic (EEG) traces for a subclinical (orange) and focal (purple) seizure in an example patient, with a subsection of recording channels for visualization. (B) Heat maps of the line length marker in 1‐s epochs for seizures in A. (C) Ninety‐fifth percentile of line length measures for each channel across time. (D) Bee‐swarm representation of the same data as C, also for a few more example seizures in this patient. Gray arrows point to the maximum value across channels; this is the peak value for the seizure. (E) Log‐transformed peak line length values (maximum channel value across 95th percentiles), as indicated by gray arrows in D in five example patients; each data point represents a seizure. Sz, seizure.
FIGURE 2
FIGURE 2
Visualizing spatial markers for example patient U22. (A, C) Intracranial electroencephalographic (EEG) traces of an example focal/subclinical seizure with a subset of recording channels. (B, D) Corresponding binary map of seizure imprint (yellow indicates seizure activity, green no seizure activity) across time in the same subset of channels as in A and C. (E) Swarm plot of the proportion of channels with seizure activity at any point in the seizure for all seizures in five example patients. (F) Swarm plot of the proportion of channels with seizure activity at the point of maximum recruitment for all seizures for five example patients.
FIGURE 3
FIGURE 3
Visualizing suppression markers for example patient U22. (A) Intracranial electroencephalographic (EEG) traces of example subclinical (orange) and focal (purple) postictal segments in a subset of recording channels. (B) Corresponding binary maps of channels with suppression (<5% of preictal activity levels) in the same subset of recording channels. (C) Proportion of suppressed channels across 120 s of postictal activity. Segments of majority suppression and partial suppression are highlighted. (D) Swarm plot of (log‐transformed) majority suppression duration for all seizures for five example patients. (E) Swarm plot of (log‐transformed) partial suppression duration for all seizures for five example patients.
FIGURE 4
FIGURE 4
Validating markers against International League against Epilepsy classification across patients. (A) Heat map of area under the curve (AUC) values for hierarchical logistic regression models comparing focal and subclinical seizures. (B) Heat map of AUC values for hierarchical logistic regression models comparing focal seizures with and without loss of awareness (LoA).
FIGURE 5
FIGURE 5
Validating markers against International League against Epilepsy (ILAE) classification on a within‐patient basis. (A) Wilcoxon rank sum test r‐values obtained through comparing focal and subclinical seizures. Each row is a patient, and each column is a marker. Patients were sorted by descending r‐values within the temporal lobe epilepsy (TLE) and extra‐temporal lobe epilepsy (eTLE) groups. (B) Same as in panel A, filtered by p < .05. (C) Paired bar chart displaying counts of focal and subclinical seizures for each patient included in within‐patient validation.
FIGURE 6
FIGURE 6
Detecting circadian and longer term modulation of seizure severity. (A) Intracranial electroencephalographic recordings for a daytime (blue) and night‐time (pink) seizure from example patient U14. (B) Plot of marker against time of day for line length and postictal suppression strength. Pink background indicates evening/night, whereas blue background indicates daytime. (C) Dot plot of scaled circular–linear correlation coefficients between markers and time of day across included patients. Probability values < .05 obtained through permutation tests are highlighted in black. (D) Dot plot of absolute Spearman rank correlation coefficient between markers and time in epilepsy monitoring unit (EMU) across included patients. Correlations with p‐values < .05 are highlighted in black.

References

    1. Bautista RED, Glen ET. Seizure severity is associated with quality of life independent of seizure frequency. Epilepsy Behav. 2009;16(2):325–9. - PubMed
    1. Duncan JS, Sander J. The chalfont seizure severity scale. J Neurol Neurosurg Psychiatry. 1991;54(10):873–6. - PMC - PubMed
    1. O'Donoghue M, Duncan J, Sander J. The national hospital seizure severity scale: a further development of the chalfont seizure severity scale. Epilepsia. 1996;37(6):563–71. - PubMed
    1. Baker GA, Smith DF, Dewey M, Morrow J, Crawford PM, Chadwick DW. The development of a seizure severity scale as an outcome measure in epilepsy. Epilepsy Res. 1991;8(3):245–51. - PubMed
    1. Cramer JA, Baker GA, Jacoby A. Development of a new seizure severity questionnaire: initial reliability and validity testing. Epilepsy Res. 2002;48(3):187–97. - PubMed

Publication types