. 2023 Feb 2:12:e80721.
doi: 10.7554/eLife.80721.

Arginase 1 is a key driver of immune suppression in pancreatic cancer

Affiliations

Arginase 1 is a key driver of immune suppression in pancreatic cancer

Rosa E Menjivar et al. Elife. .

Abstract

An extensive fibroinflammatory stroma rich in macrophages is a hallmark of pancreatic cancer. In this disease, it is well appreciated that macrophages are immunosuppressive and contribute to the poor response to immunotherapy; however, the mechanisms of immune suppression are complex and not fully understood. Immunosuppressive macrophages are classically defined by the expression of the enzyme Arginase 1 (ARG1), which we demonstrated is potently expressed in pancreatic tumor-associated macrophages from both human patients and mouse models. While routinely used as a polarization marker, ARG1 also catabolizes arginine, an amino acid required for T cell activation and proliferation. To investigate this metabolic function, we used a genetic and a pharmacologic approach to target Arg1 in pancreatic cancer. Genetic inactivation of Arg1 in macrophages, using a dual recombinase genetically engineered mouse model of pancreatic cancer, delayed formation of invasive disease, while increasing CD8+ T cell infiltration. Additionally, Arg1 deletion induced compensatory mechanisms, including Arg1 overexpression in epithelial cells, namely Tuft cells, and Arg2 overexpression in a subset of macrophages. To overcome these compensatory mechanisms, we used a pharmacological approach to inhibit arginase. Treatment of established tumors with the arginase inhibitor CB-1158 exhibited further increased CD8+ T cell infiltration, beyond that seen with the macrophage-specific knockout, and sensitized the tumors to anti-PD1 immune checkpoint blockade. Our data demonstrate that Arg1 drives immune suppression in pancreatic cancer by depleting arginine and inhibiting T cell activation.

Keywords: CD8 T cells; PDA; arginase; cancer biology; human; immunosuppression; immunotherapy; mouse; myeloid.


Conflict of interest statement

RM, ZN, WD, KD, HH, CE, KB, AV, WY, FL, AB, PK, DS, HC, FB, EC, YZ, CH, MP No competing interests declared, CL has received consulting fees from Astellas Pharmaceuticals, Odyssey Therapeutics, and T-Knife Therapeutics, and is an inventor on patents pertaining to Kras regulated metabolic pathways, redox control pathways in pancreatic cancer, and targeting the GOT1-pathway as a therapeutic approach (US Patent No: 2015126580-A1, 05/07/2015; US Patent No: 20190136238, 05/09/2019; International Patent No: WO2013177426-A2, 04/23/2015)

Figures
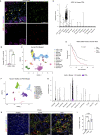
Figure 1.
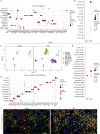
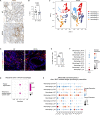
Figure 1.. Arginase 1 (Arg1) is highly expressed in human and mouse myeloid cells.
(A) Representative image of RNA in situ hybridization (ISH) of ARG1 (red) and co-immunofluorescence staining of immune (CD45, green) and epithelial (E-cadherin [ECAD], magenta) cells in human pancreatic ductal adenocarcinoma (PDA). Counterstain, DAPI (blue). White arrows point to ARG1-ISH in ECAD+ cells, and yellow arrows point to ARG1-ISH in CD45+ cells. Scale bar, 50 μm. (B) Quantification of average ARG1+ puncta in CK19 and CD45 cells. Unpaired t test with Welch’s correction was used to determine statistical significance. (C) Uniform manifold approximation and projection (UMAP) visualization of 13 identified cell populations from single-cell RNA sequencing (sc-RNA-seq) of 16 human PDA tumors. Data from Steele et al., 2020. (D) Violin plot of normalized gene expression of ARG1 in the identified cell populations from the human PDA sc-RNA-seq. (E) Survival analysis of a human PDA microarray data set (GSE71729) with low (n=62) and high (n=63) ARG1 expression. Statistical significance was determined using the Kaplan Meier overall survival Logrank test. (F) UMAP visualization of 11 identified populations from healthy and PDA merged mouse sc-RNA-seq. (G) Violin plot of normalized gene expression of Arg1 in the identified cell populations from mouse sc-RNA-seq. (H) Representative co-immunofluorescence staining for ARG1 (red), macrophages (F4/80, green), and epithelial (ECAD, blue) cells in mouse tissue at different stages of disease. Counterstain, DAPI (gray). Scale bar, 50 μm. Yellow arrows indicate ARG1 expression in F4/80+ cells. (I) Quantification of F4/80+ ARG1+ cells in healthy, PanIN, and PDA mouse tissue. Statistical significance was determined using an ordinary one-way ANOVA with multiple comparisons. p Value was considered statistically significant when p<0.05.
Figure 1—figure supplement 1.
Figure 1—figure supplement 1.. Arginase 1 (Arg1) expression in human and mouse myeloid cells.
(A) Dot plot showing the lineage markers used to identify the different cell populations in the human single-cell RNA sequencing (sc-RNA-seq). Dot color indicates average expression and dot size indicates expression frequency. (B) Dot plot showing normalized gene expression levels of ARG1 and ARG2 in the human sc-RNA-seq. (C) Uniform manifold approximation and projection (UMAP) visualizations comparing defined cell populations in healthy and pancreatic ductal adenocarcinoma (PDA) mouse sc-RNA-seq. (D) Dot plot showing the lineage markers used to identify the distinct cell populations in healthy and PDA mouse sc-RNA-seq. (E) Dot plot showing normalized gene expression levels of Arg1 and Arg2 in healthy and PDA mouse sc-RNA-seq. (F) Representative co-immunofluorescence staining for ARG1 (red), macrophages (F4/80, green), and epithelial (E-cadherin [ECAD], blue) cells in mouse tissue during PanIN and PDA stages of disease. Quantification of F4/80+ ARG1+ cells is shown in Figure 1I. Yellow dotted box marks the area shown in main Figure 1H. Scale bar for PanIN image is 100 μm; for PDA is 50 μm.
Figure 2.
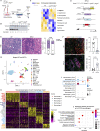
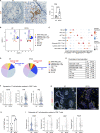
Figure 2.. Arginase 1 (Arg1) deletion in myeloid cells reduces tumor progression and induces macrophage repolarization in a spontaneous pancreatic ductal adenocarcinoma (PDA) mouse model.
(A) Schematic illustration for the generation of tumor-associated macrophages (TAMs) from wild-type (WT) and Lyz2Cre/+;Arg1f/f mice. (B) Representative image of western blot for ARG1 levels in WT and Lyz2Cre/+;Arg1f/f TAMs. Vinculin, loading control. (C) Heatmap of statistically significantly different extracellular metabolites from WT (lanes 1–4) and Lyz2Cre/+;Arg1f/f (lanes 5–8) TAM media. (D) Genetic makeup of the KrasFrt-STOP-Frt-G12D/+;Ptf1aFlpO/+;Lyz2Cre/+;Arg1f/f (KFCA) mouse model for the deletion of Arg1 in myeloid cells during PDA tumorigenesis. Data shown here from mice aged 9–16 mo, n=24–26/group. (E) Representative hematoxylin and eosin (H&E) staining from age matching KF and KFCA mice. Scale bar, 100 μm. Histopathology evaluation shown on the right (n=26 KF and 24 KFCA, age matched, 9–16 mo old). Statistical significance was determined using chi-square test. Statistically significant when P<0.05. (F) Representative image of co-immunofluorescence staining for ARG1 (red), macrophages (F4/80, green), epithelial (CK19, gray), and DAPI (blue) in KF and KFCA tissue. Scale bar, 50 μm. Quantification on the right, n=5–6/group. Significance was determined using unpaired t test with Welch’s correction. Statistically significant when p<0.05. (G) Uniform manifold approximation and projection (UMAP) visualization for the identified cell populations in merged KF and KFCA single-cell RNA sequencing. (H) Heatmap of top differentially expressed genes in the macrophage subclusters identified from KF and KFCA pancreata. (I) Dot plot visualization of Arg1 and Arg2 expression in KF and KFCA macrophage clusters. Average expression is shown by color intensity and expression frequency by dot size. (J) Reactome pathway enrichment analysis showing significantly upregulated pathways in KFCA macrophages.
Figure 2—figure supplement 1.
Figure 2—figure supplement 1.. Deletion of Arginase 1 (Arg1) in myeloid cells decreases cell proliferation and cell death during early stages of pancreatic ductal adenocarcinoma.
(A) Experimental design for KF and KFCA mice aged to 2 mo. (B) Representative images of co-immunofluorescence staining for ARG1 (red), macrophages (F4/80, green), epithelial (CK19, gray), and DAPI (blue) in KF and KFCA pancreata at 2 mo. Yellow staining shows co-localization of ARG1 and F4/80. Scale bar, 50 μm. Quantification on the right, n=4–6/group (C) Representative hematoxylin and eosin (H&E) images for KF and KFCA mice at 2 mo, n=6–7/group. Scale bar, 100 μm. On the right, percentage of ADM/PanIN lesions area in KF and KFCA tissue at 2 mo, n=6–7/group. (D) Representative immunohistochemistry staining for total cell proliferation (Ki67) and total cell death (cleaved caspase-3 [CC3]). Scale bar, 100 μm. Quantification on the right, n=6–7/group. (E) Representative immunofluorescence staining for immune cells (CD45, green) and epithelial cells (CK19, gray). Scale bar, 50 μm. Quantification on the right, n=4/group. (F) Representative immunohistochemistry staining for macrophages (F4/80) and CD8+ T cells (CD8) in KF and KFCA tissue at 2 mo. Scale bar, 100 μm. Positive staining quantification is shown on the right. Student’s t test was used to determine significance. Statistically significant when p<0.005.
Figure 2—figure supplement 2.
Figure 2—figure supplement 2.. Deletion of Arginase 1 (Arg1) in myeloid cells alters the immune cell infiltration in a spontaneous pancreatic ductal adenocarcinoma mouse model during late stages of disease.
(A) Left panel: co-immunofluorescence staining from Figure 2F showing ARG1 (red) and CK19 (gray) staining without DAPI; right panel: co-immunofluorescence staining for ARG1 (red), COX1 (green), and DAPI (blue) in KF and KFCA tissue. Scale bar, 50 μm. (B) Uniform manifold approximation and projection (UMAP) visualizations of single-cell RNA sequencing (sc-RNA-seq) comparing the identified cell populations in KF and KFCA. (C) Dot plot showing the lineage markers used to identify the distinct cell populations. Dot color indicates average expression, and dot size indicates expression frequency. (D) Pie charts comparing the proportion of the identified sc-RNA-seq populations between KF and KFCA. (E) Table showing the percentage of each identified population from total cells in KF and KFCA.
Figure 2—figure supplement 3.
Figure 2—figure supplement 3.. Deletion of Arginase 1 in myeloid cells decreases immune suppression in a spontaneous pancreatic ductal adenocarcinoma mouse model during late stages of the disease.
(A) Representative immunohistochemistry staining for macrophages (F4/80) in KF and KFCA tissue during late stage of disease at 20× magnification. (B) Quantification for F4/80+ staining, n=8/group. Student’s t test was used to determine significance. (C) Uniform manifold approximation and projection (UMAP) visualizations showing the distribution of the five identified macrophage subpopulations in KF and KFCA. (D) Representative immunofluorescence staining for APOE (green), F4/80 (red), E-cadherin (ECAD; purple), and DAPI (blue) in KF and KFCA pancreas tissue during late stages of the disease. Scale bar, 25 μm. (E) Quantification of F4/80+ APOE+ cells, n=3/group. Student’s t test was used to determine significance. (F) Dot plot visualization of Apoe expression in KF and KFCA macrophage clusters. Average expression is shown by color intensity, and percent expressed by dot size. (G) Reactome pathway enrichment analysis showing significantly downregulated pathways in KFCA macrophages. (H) Dot plot showing differentially expressed genes involved in MHC I-mediated antigen processing and presentation in macrophages.
Figure 3.
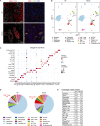
Figure 3.. Arginase 1 deletion in myeloid cells increases CD8+ T cell infiltration and activation in a spontaneous pancreatic ductal adenocarcinoma mouse model.
(A) Representative images of CD8 immunohistochemistry staining (brown) in KF and KFCA tissue. Scale bar, 50 μm. Quantification of positive area on the right, n=5–6/group. Student’s t test was used to determine statistical significance. (B) Uniform manifold approximation and projection (UMAP) visualization of defined T and natural killer (NK) cell clusters comparing single-cell RNA sequencing (sc-RNA-seq) data from KF and KFCA. (C) Dot plot of lineage markers used to identify the different types of lymphocytes. Dot size shows expression frequency, dot color shows average expression. (D) Pie charts showing the proportion of the identified lymphocyte populations in KF and KFCA sc-RNA-seq, percentage values are provided for populations that differ dramatically between KF and KFCA. (E) Table showing the percentage of each identified lymphocyte population in KF and KFCA sc-RNA-seq. (F) Violin plots showing normalized expression levels of T cell activation markers in all CD8+ T cell populations identified in KF and KFCA sc-RNA-seq data. (G) Representative images of co-immunofluorescence staining for CD8 (green), GZMB (red), CK19 (gray), and DAPI (blue). Scale bar, 100 μm. (H) Quantification of CD8+ GZMB+ cells, n=3/group. Student’s t test was used to determine significance. (I) Violin plots showing normalized expression levels of T cell exhaustion markers in all CD8+ T cell populations identified in KF and KFCA.
Figure 4.
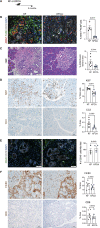
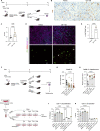
Figure 4.. Systemic inhibition of arginase by CB-1158 in combination with anti-PD1 reduces tumor growth in an orthotopic pancreatic ductal adenocarcinoma mouse model.
(A) Experimental timeline and design for orthotopic transplantation of 7940B KPC cells in syngeneic mice. (B) Representative images of immunohistochemistry staining for CD8 (brown). Scale bar, 50 μm. (C) Quantification of positive area of CD8 staining from B. Statistical significance was determined using unpaired t-test with Welch’s correction. (D) Representative images of co-immunofluorescence staining for CD8 (green), GZMB (red), ECAD (purple), and DAPI (blue) in the vehicle and CB-1158 treated group. Scale bar, 20 μm. White arrows point to co-localization of CD8 (green) with GZMB (red). (E) Percentage of CD8+ and GZMB+ cells. Statistical significance was determined using unpaired t-test with Welch’s correction. (F) Experimental timeline and design for orthotopic transplantation of 7940B KPC cells in syngeneic mice and different treatment groups. (G) Final tumor weight (mg) from the different treatment groups, n=10–12/group. Statistical significance was determined using two-way ANOVA with Tukey’s multiple comparisons correction test. (H) Metabolomic analysis showing relative arginine levels in the tumors of the different treatment groups. Two-way ANOVA was used to determine statistical significance, n=5–6/group. (I) Experimental scheme for CD8+ T cell isolation and growth in different media conditions. −Arg RPMI = RPMI lacking arginine, Orn = ornithine. (J) Percent of proliferated CD8+ T cells from flow cytometry analysis. (K) Percent of activated CD8+ T cells (CD44) from flow cytometry analysis. Two-way ANOVA with Tukey’s multiple comparisons correction test was used to determine significance. n=3/condition.
Figure 4—figure supplement 1.
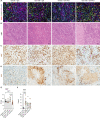
Figure 4—figure supplement 1.. Histological analysis of the multiple treatment groups in the orthotopic mouse model.
(A) Representative images of co-immunofluorescence staining for ARG1 (red), F4/80 (green), ECAD (purple), and DAPI (blue). Yellow shows co-localization of ARG1 with F4/80 macrophages. Scale bar, 50 μm. (B) Hematoxylin and eosin (H&E) staining for the indicated treatment groups. Scale bar, 50 μm. (C) Immunohistochemistry staining for cell proliferation (Ki67). Positive staining is shown in brown. Scale bar, 100 μm. (D) Immunohistochemistry staining for cell death (cleaved caspase-3 [CC3]). Positive staining is shown in brown. Scale bar, 100 μm. (E and F) Quantification of the positive staining area for Ki67 and CC3 from C and D. Significance was determined using unpaired t test with Welch’s correction.
Figure 4—figure supplement 2.
Figure 4—figure supplement 2.. Flow cytometry gating strategy for CD8+ T cell proliferation and activation.
(A) Representative gating strategy for cells cultured in RPMI control media. (B) Representative grating strategy for cells cultured in RPMI media lacking arginine (−Arg RPMI). (C) Proliferating lymphocytes. (D) Activated lymphocytes (CD44+).
Figure 5.
Figure 5.. Diagram depicting our working model.
(A) In pancreatic ductal adenocarcinoma (PDA), expression of Arg1 in myeloid cells is immune suppressive. (B) Deletion of Arg1 in myeloid cells in a spontaneous PDA mouse model induces macrophage repolarization and decreases tumor formation. (C) Systemic Arginase inhibition in combination with anti-PD1 immune checkpoint blockade further decreases tumor growth.

Comment in

References

    1. Aiello NM, Rhim AD, Stanger BZ. Orthotopic injection of pancreatic cancer cells. Cold Spring Harbor Protocols. 2016;2016:pdb.prot078360. doi: 10.1101/pdb.prot078360. - DOI - PubMed
    1. Arlauckas SP, Garren SB, Garris CS, Kohler RH, Oh J, Pittet MJ, Weissleder R. Arg1 expression defines immunosuppressive subsets of tumor-associated macrophages. Theranostics. 2018;8:5842–5854. doi: 10.7150/thno.26888. - DOI - PMC - PubMed
    1. Awad MM, Liu S, Rybkin II. Acquired resistance to KRAS(G12C) inhibition in cancer. The New England Journal of Medicine. 2021;384:2382–2393. doi: 10.1056/NEJMoa2105281. - DOI - PMC - PubMed
    1. Balachandran VP, Łuksza M, Zhao JN, Makarov V, Moral JA, Remark R, Herbst B, Askan G, Bhanot U, Senbabaoglu Y, Wells DK, Cary CIO, Grbovic-Huezo O, Attiyeh M, Medina B, Zhang J, Loo J, Saglimbeni J, Abu-Akeel M, Zappasodi R, Riaz N, Smoragiewicz M, Kelley ZL, Basturk O, Gönen M, Levine AJ, Allen PJ, Fearon DT, Merad M, Gnjatic S, Iacobuzio-Donahue CA, Wolchok JD, DeMatteo RP, Chan TA, Greenbaum BD, Merghoub T, Leach SD, Australian Pancreatic Cancer Genome Initiative. Garvan Institute of Medical Research. Prince of Wales Hospital. Royal North Shore Hospital. University of Glasgow. St Vincent’s Hospital. QIMR Berghofer Medical Research Institute. University of Melbourne, Centre for Cancer Research. University of Queensland, Institute for Molecular Bioscience. Bankstown Hospital. Liverpool Hospital. Royal Prince Alfred Hospital, Chris O’Brien Lifehouse. Westmead Hospital. Fremantle Hospital. St John of God Healthcare. Royal Adelaide Hospital. Flinders Medical Centre. Envoi Pathology. Princess Alexandria Hospital. Austin Hospital. Johns Hopkins Medical Institutes. ARC-Net Centre for Applied Research on Cancer Identification of unique neoantigen qualities in long-term survivors of pancreatic cancer. Nature. 2017;551:512–516. doi: 10.1038/nature24462. - DOI - PMC - PubMed
    1. Bayne LJ, Beatty GL, Jhala N, Clark CE, Rhim AD, Stanger BZ, Vonderheide RH. Tumor-Derived granulocyte-macrophage colony-stimulating factor regulates myeloid inflammation and T cell immunity in pancreatic cancer. Cancer Cell. 2012;21:822–835. doi: 10.1016/j.ccr.2012.04.025. - DOI - PMC - PubMed

Publication types

Associated data