. 2023 Mar 1;324(3):F301-F314.
doi: 10.1152/ajprenal.00231.2022. Epub 2023 Feb 2.

Circadian gene expression in mouse renal proximal tubule

Affiliations

Circadian gene expression in mouse renal proximal tubule

Molly A Bingham et al. Am J Physiol Renal Physiol. .

Abstract

Circadian variability in kidney function is well recognized but is often ignored as a potential confounding variable in physiological experiments. Here, we have created a data resource consisting of expression levels for mRNA transcripts in microdissected proximal tubule segments from mice as a function of the time of day. Small-sample RNA sequencing was applied to microdissected S1 proximal convoluted tubules and S2 proximal straight tubules. After stringent filtering, the data were analyzed using JTK-Cycle to detect periodicity. The data set is provided as a user-friendly webpage at https://esbl.nhlbi.nih.gov/Databases/Circadian-Prox2/. In proximal convoluted tubules, 234 transcripts varied in a circadian manner (4.0% of the total). In proximal straight tubules, 334 transcripts varied in a circadian manner (5.3%). Transcripts previously known to be associated with corticosteroid action and with increased flow were found to be overrepresented among circadian transcripts peaking during the "dark" portion of the day [zeitgeber time (ZT)14-22], corresponding to peak levels of corticosterone and glomerular filtration rate in mice. To ask whether there is a time-of-day dependence of protein abundances in the kidney, we carried out LC-MS/MS-based proteomics in whole mouse kidneys at ZT12 and ZT0. The full data set (n = 6,546 proteins) is available at https://esbl.nhlbi.nih.gov/Databases/Circadian-Proteome/. Overall, 293 proteins were differentially expressed between ZT12 and ZT0 (197 proteins greater at ZT12 and 96 proteins greater at ZT0). Among the regulated proteins, only nine proteins were found to be periodic in the RNA-sequencing analysis, suggesting a high level of posttranscriptional regulation of protein abundances.NEW & NOTEWORTHY Circadian variation in gene expression can be an important determinant in the regulation of kidney function. The authors used RNA-sequencing transcriptomics and LC-MS/MS-based proteomics to identify gene products expressed in a periodic manner. The data were used to construct user-friendly web resources.

Keywords: RNA sequencing; circadian variation; proteomics; proximal tubule; transcriptomics.


Conflict of interest statement

No conflicts of interest, financial or otherwise, are declared by the authors.

Figures

None
Graphical abstract
Figure 1.
Figure 1.
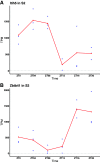
Two examples of time-course data for transcripts using images downloaded from the data-sharing webpage at https://esbl.nhlbi.nih.gov/Databases/Circadian-Prox/Circadian_Amplitude_PCT.html. Transcripts are indicated by official gene symbols. “S1” refers to the proximal convoluted tubule (PCT). “ZT” is zeitgeber time, representing the time point in hours since the lights on time. A: the transcript coding for solute carrier family 30 (zinc transporter) member 5 (Slc30a5) in the PCT has a phase of 8 h, corresponding to a peak amplitude 8 h after lights on. B: the transcript coding for zinc finger and BTB domain containing 43 (Zbtb43) in the PCT has a phase of 18 h (peak amplitude ∼6 h after lights off). TPM, transcripts per million.
Figure 2.
Figure 2.
Two examples of time-course data for transcripts using images downloaded from the data-sharing webpage at https://esbl.nhlbi.nih.gov/Databases/Circadian-Prox/Circadian_Amplitude_PST.html. Transcripts are indicated by official gene symbols. “S2” refers to the proximal straight tubule (PST). ZT is zeitgeber time, representing the time point in hours since the lights on time. A: the transcript coding for inter-α-trypsin inhibitor heavy chain H5 (Itih5) in the PST has a phase of 4 h, with a peak amplitude about 4 h after lights on. B: the transcript coding for zinc finger and BTB domain containing 41 (Zbtb41) in the PST has a phase of 20 h, peaking ∼8 h after lights off. TPM, transcripts per million.
Figure 3.
Figure 3.
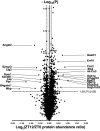
Volcano plot of proteomic data for 6,546 proteins in the mouse whole kidney. The horizontal axis shows the log2(ZT12/ZT0 protein abundance ratio) for individual proteins (where ZT is zeitgeber time). P values are from the t statistic calculated from a 3 vs. 3 comparison of log2(abundance) values. The horizontal dashed line indicates P = 0.05. The vertical dashed lines indicate 95% confidence limits for changes in control vs. control comparisons.
Figure 4.
Figure 4.
Nonproximal proteins showing differences in log2(ZT12/ZT0 protein abundance ratio) values in whole kidney samples (where ZT is zeitgeber time). Transcripts per million (TPM) values are from a prior paper reporting transcript abundances in microdissected mouse renal tubule segments. Values are highlighted with different shades of yellow to emphasize differences in gene expression. PTS1, initial segment of the proximal tubule; PTS2, proximal straight tubule in cortical medullary rays; PTS3, last segment of the proximal straight tubule; DTL1, short descending limb of the loop of Henle; DTL2, long descending limb of the loop of Henle in the outer medulla; DTL3, long descending limb of the loop of Henle in the inner medulla; ATL, thin ascending limb of the loop of Henle; MTAL, medullary thick ascending limb of the loop of Henle; CTAL, cortical thick ascending limb of the loop of Henle; DCT, distal convoluted tubule; CNT, connecting tubule; CCD, cortical collecting duct; OMCD, outer medullary collecting duct; IMCD, inner medullary collecting duct.

References

    1. Liu J, Ji H, Zheng W, Wu X, Zhu JJ, Arnold AP, Sandberg K. Sex differences in renal angiotensin converting enzyme 2 (ACE2) activity are 17β-oestradiol-dependent and sex chromosome-independent. Biol Sex Differ 1: 6, 2010. doi:10.1186/2042-6410-1-6. - DOI - PMC - PubMed
    1. Veiras LC, Girardi ACC, Curry J, Pei L, Ralph DL, Tran A, Castelo-Branco RC, Pastor-Soler N, Arranz CT, Yu ASL, McDonough AA. Sexual dimorphic pattern of renal transporters and electrolyte homeostasis. J Am Soc Nephrol 28: 3504–3517, 2017. doi:10.1681/ASN.2017030295. - DOI - PMC - PubMed
    1. Weiner ID, Verlander JW. Emerging features of ammonia metabolism and transport in acid-base balance. Semin Nephrol 39: 394–405, 2019. doi:10.1016/j.semnephrol.2019.04.008. - DOI - PMC - PubMed
    1. Hu R, McDonough AA, Layton AT. Functional implications of the sex differences in transporter abundance along the rat nephron: modeling and analysis. Am J Physiol Renal Physiol 317: F1462–F1474, 2019. doi:10.1152/ajprenal.00352.2019. - DOI - PMC - PubMed
    1. Bairey Merz CN, Dember LM, Ingelfinger JR, Vinson A, Neugarten J, Sandberg KL, Sullivan JC, Maric-Bilkan C, Rankin TL, Kimmel PL, Star RA; participants of the National Institute of Diabetes and Digestive and Kidney Diseases Workshop on “Sex and the Kidneys”. Sex and the kidneys: current understanding and research opportunities. Nat Rev Nephrol 15: 776–783, 2019. doi:10.1038/s41581-019-0208-6. - DOI - PMC - PubMed

Publication types

LinkOut - more resources