. 2023 Apr 1;43(4):616-623.
doi: 10.1097/IAE.0000000000003730.

DEFINING "STRONG" VERSUS "WEAK" RESPONSE TO ANTIVASCULAR ENDOTHELIAL GROWTH FACTOR TREATMENT FOR CENTER-INVOLVED DIABETIC MACULAR EDEMA

Affiliations

DEFINING "STRONG" VERSUS "WEAK" RESPONSE TO ANTIVASCULAR ENDOTHELIAL GROWTH FACTOR TREATMENT FOR CENTER-INVOLVED DIABETIC MACULAR EDEMA

Jennifer K Sun et al. Retina. .

Abstract

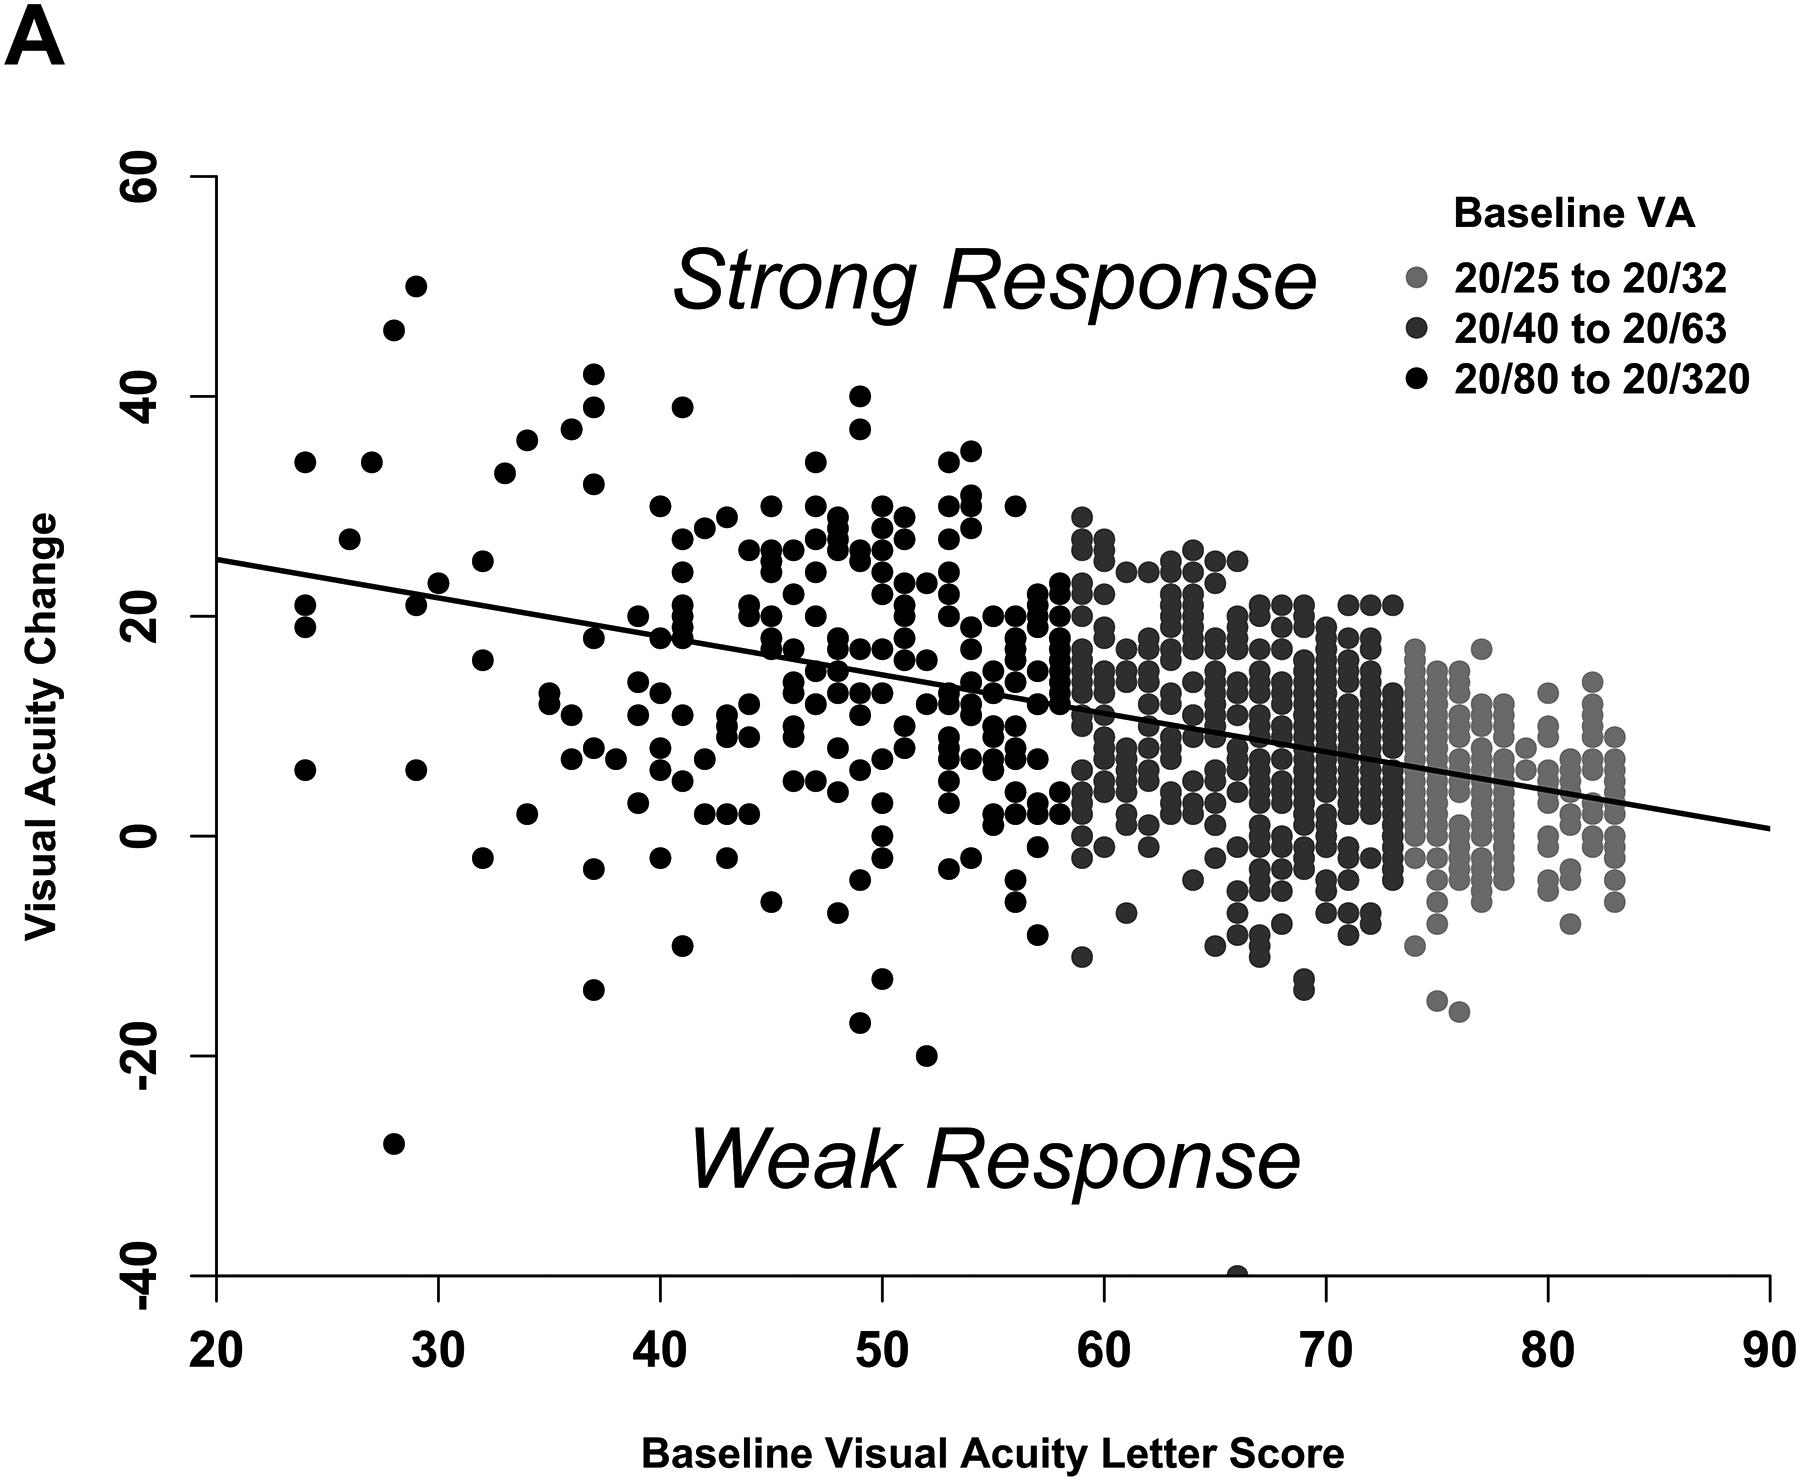
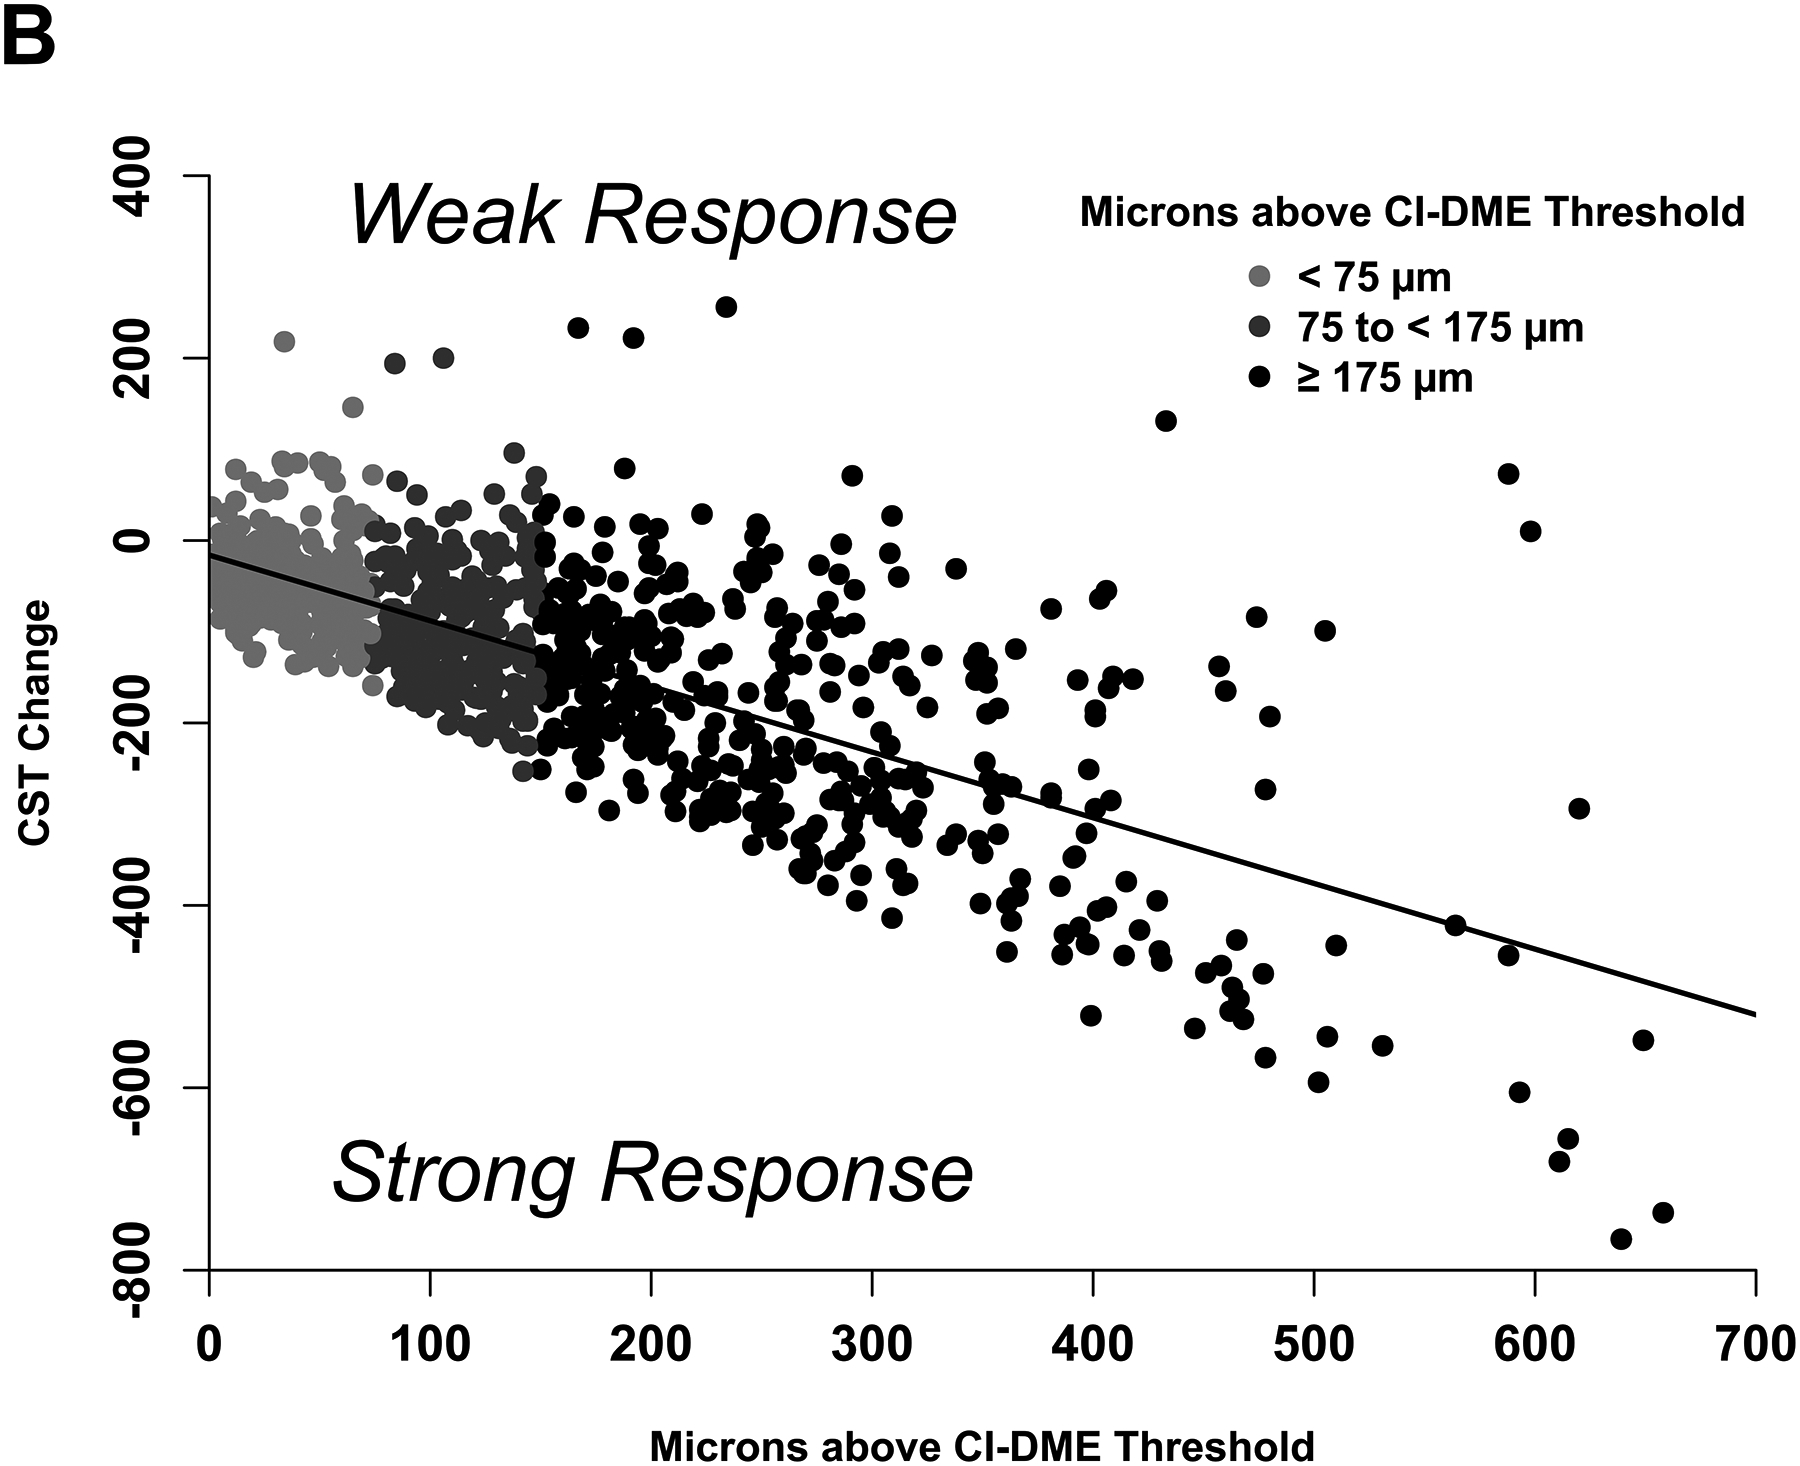
Background/purpose: To define "strong" versus "weak" antivascular endothelial growth factor (anti-VEGF) treatment response in eyes with center-involved diabetic macular edema (CI-DME).

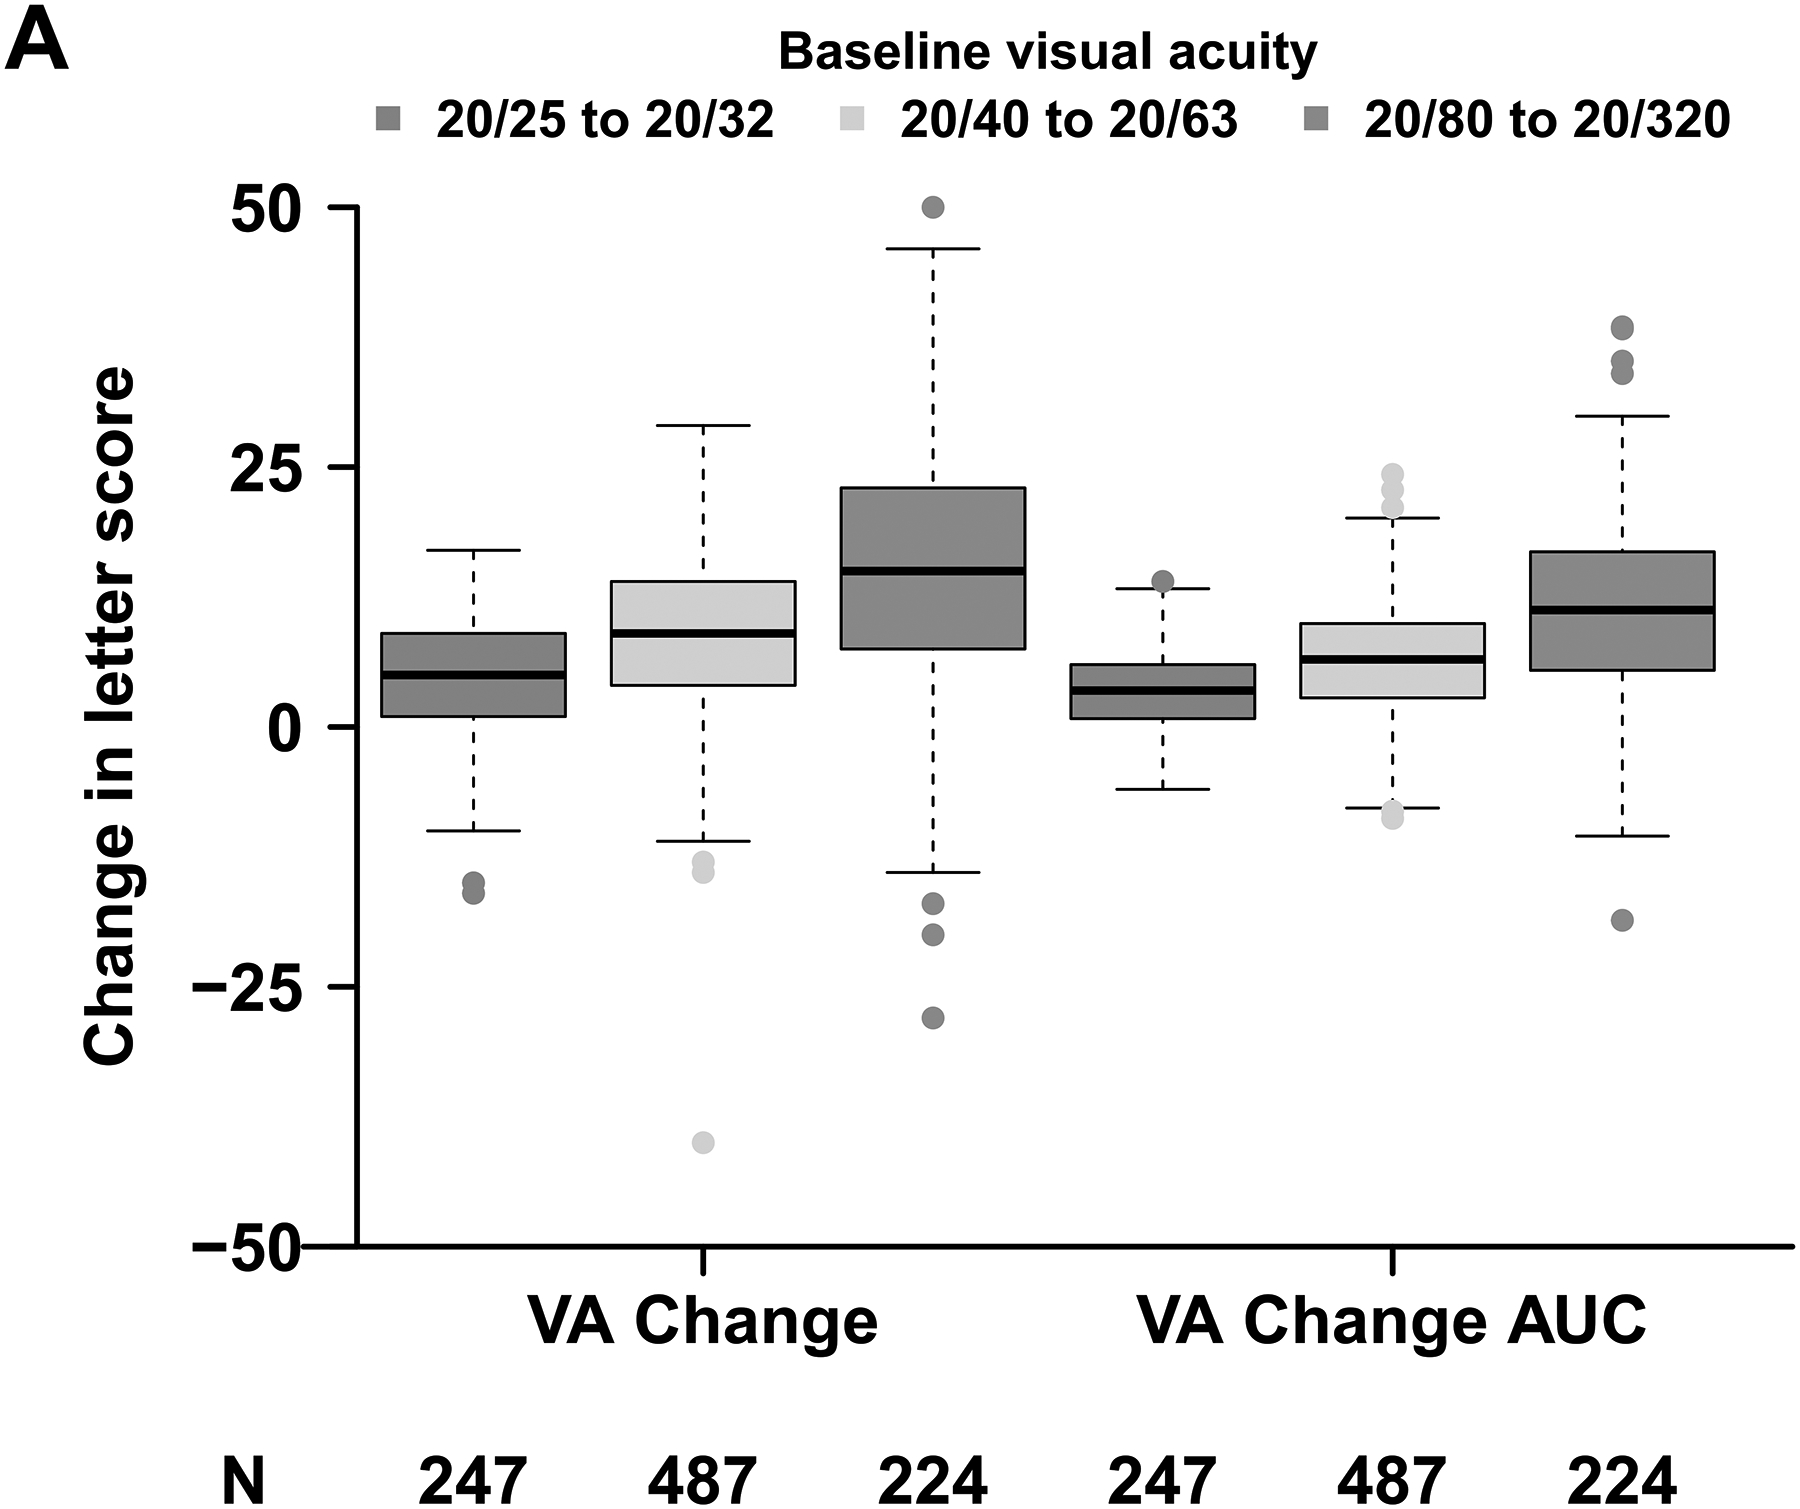
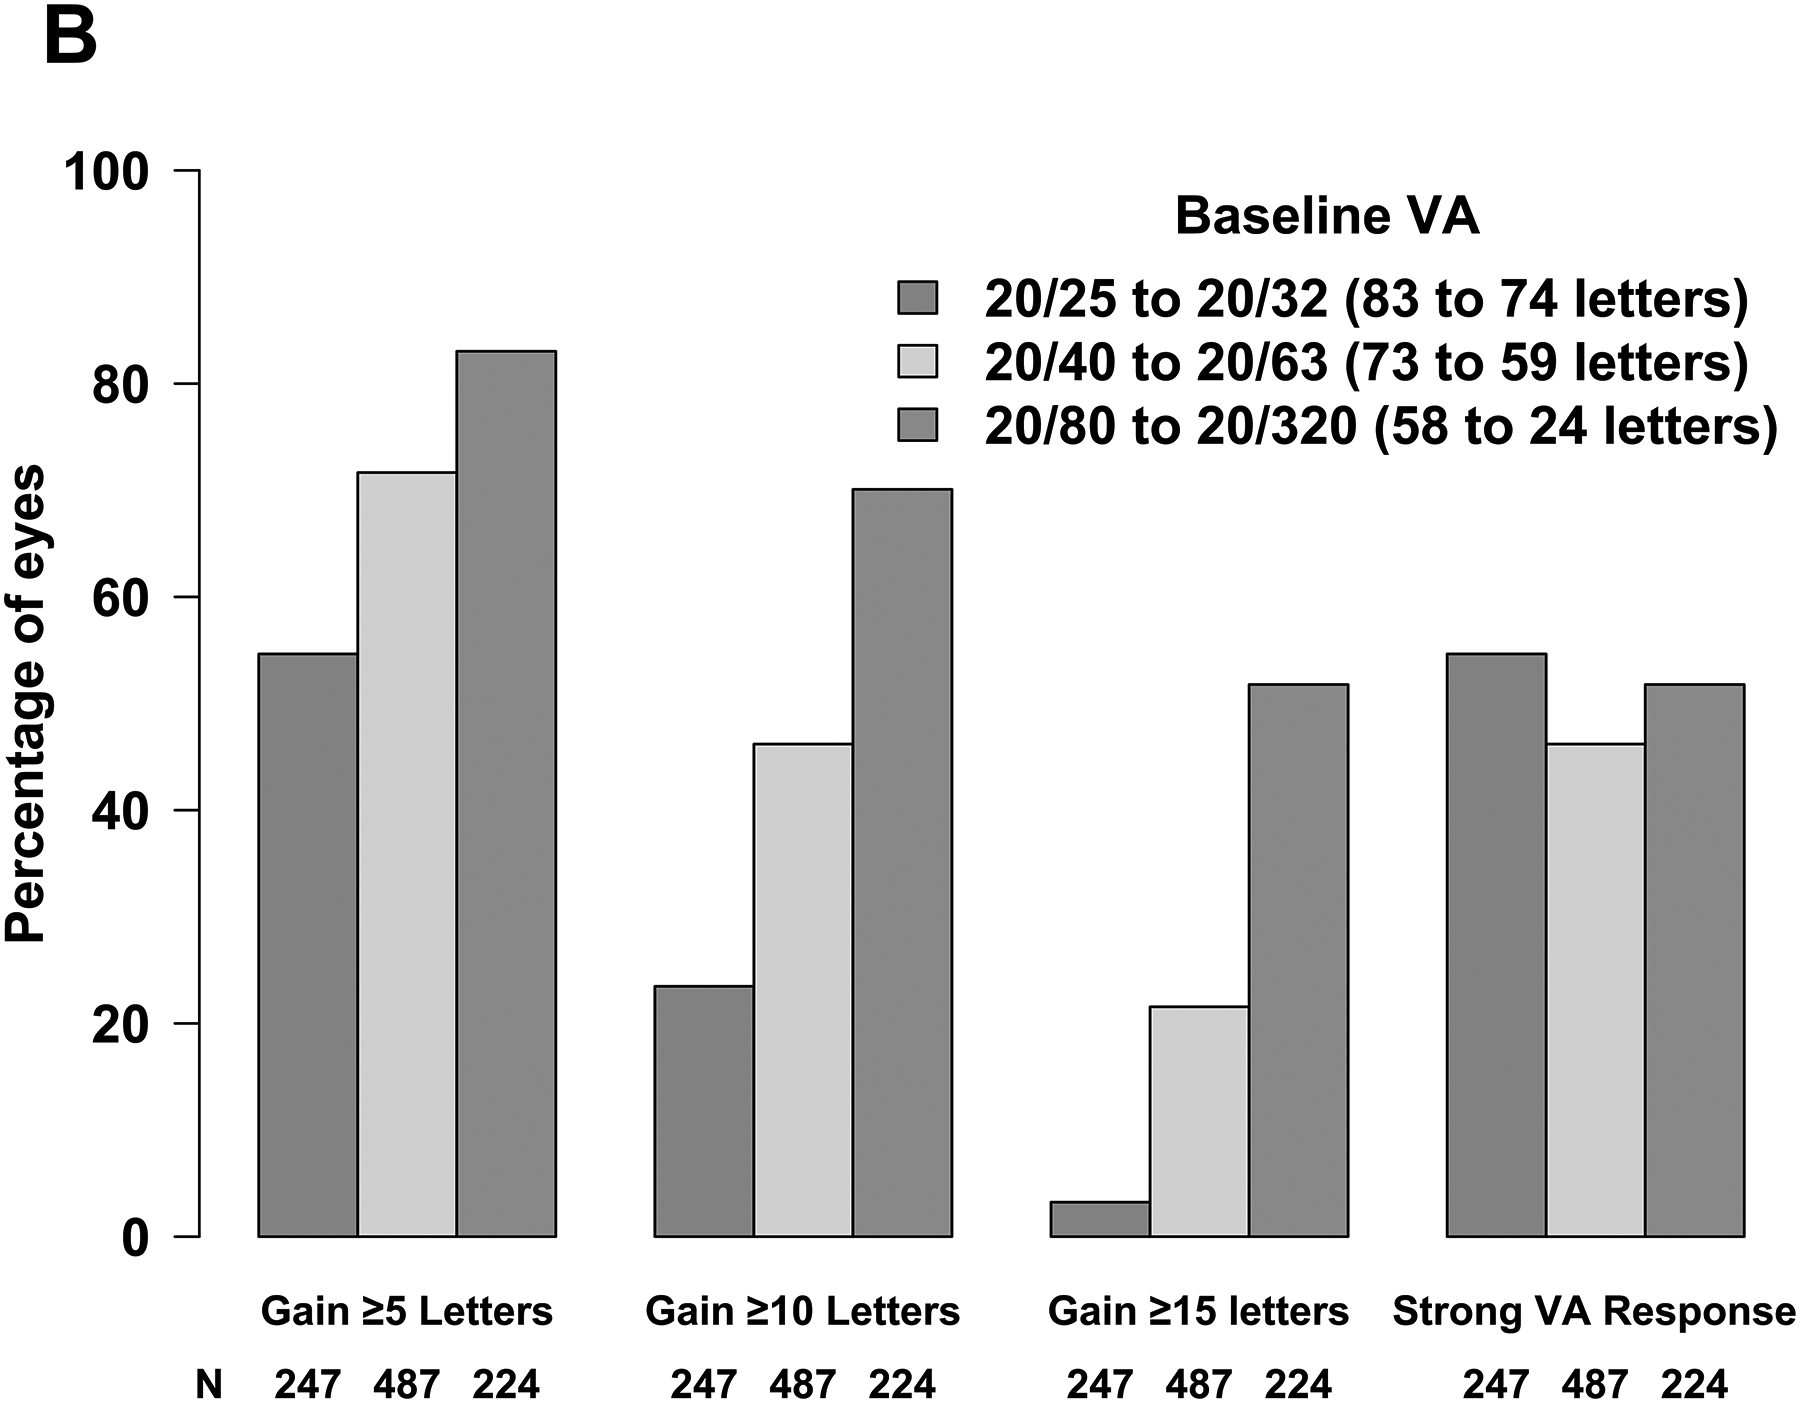
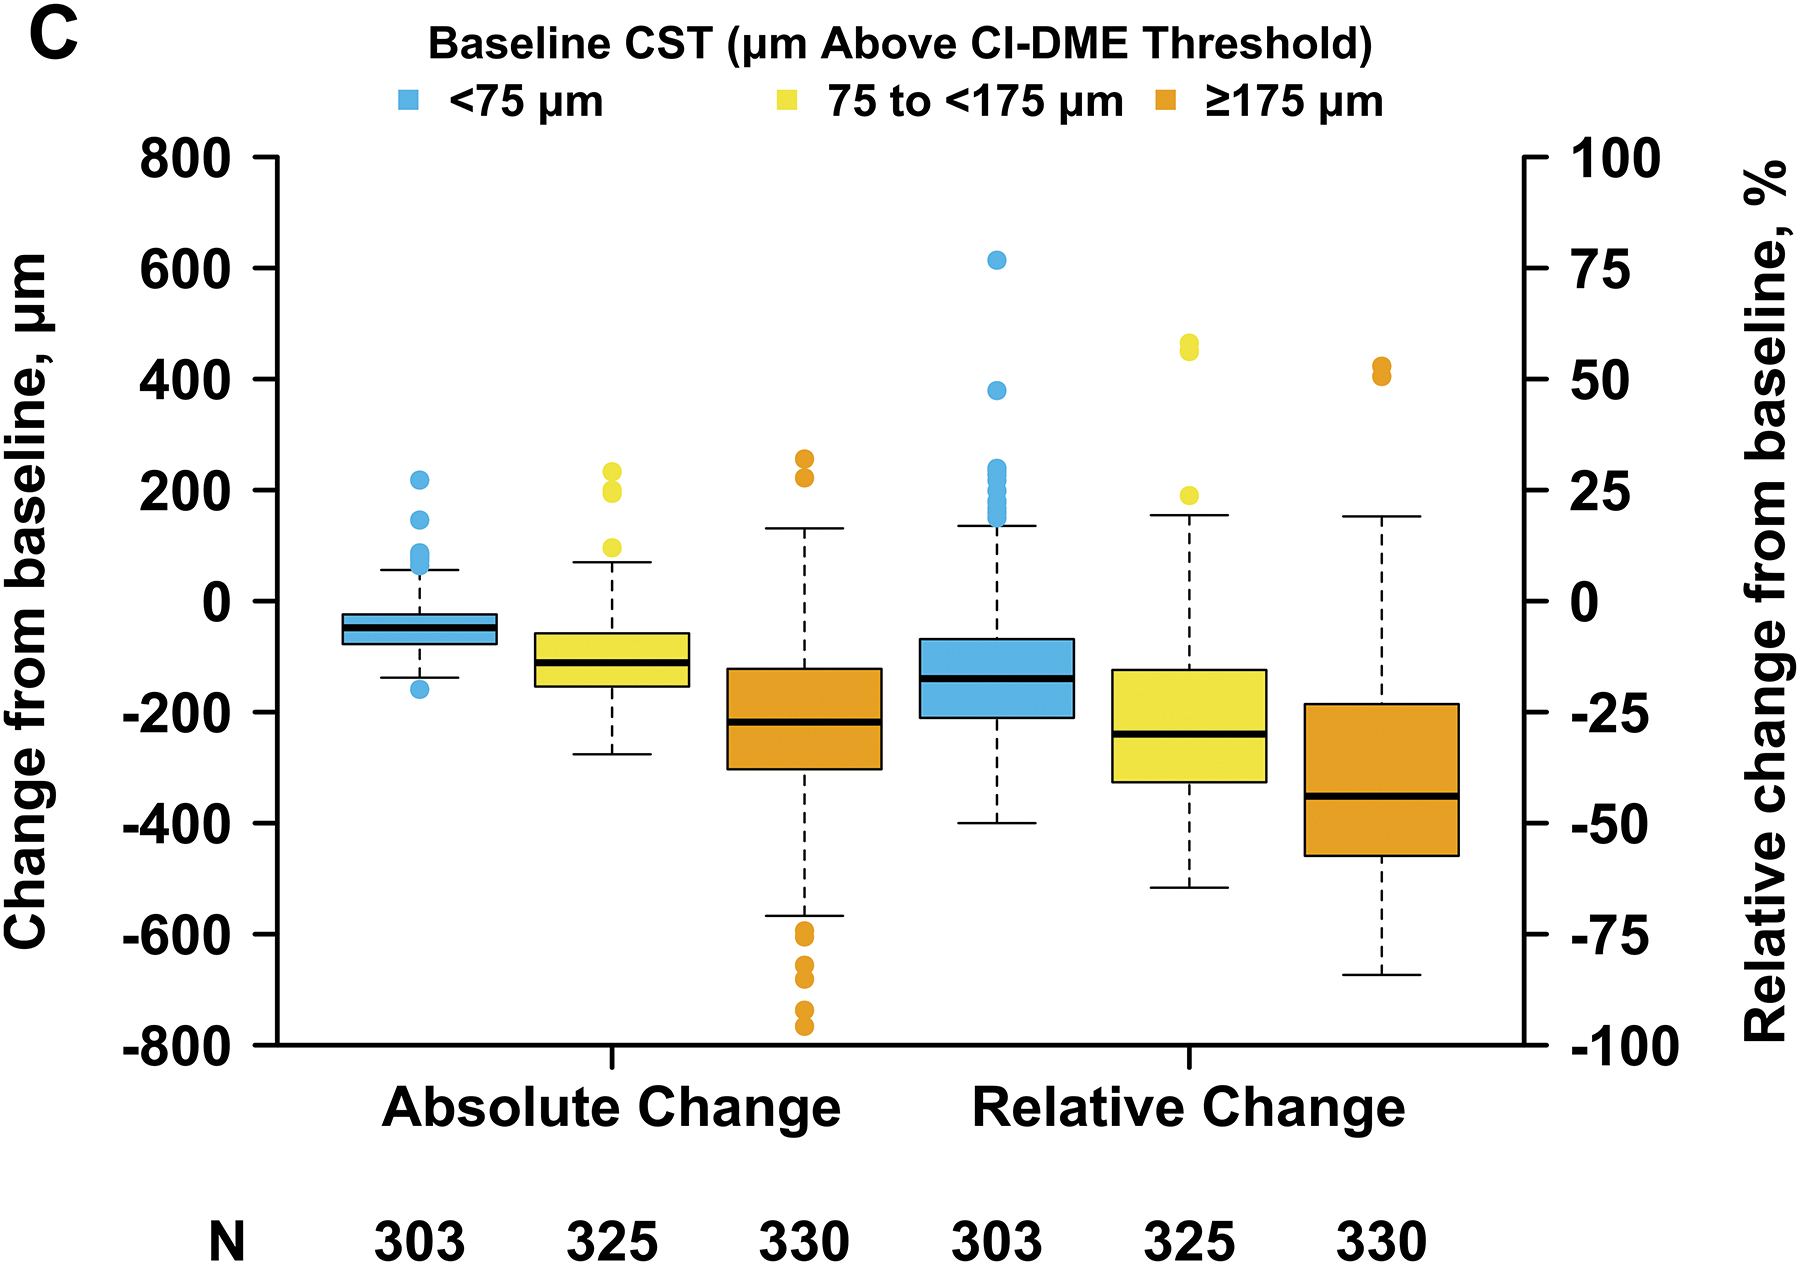
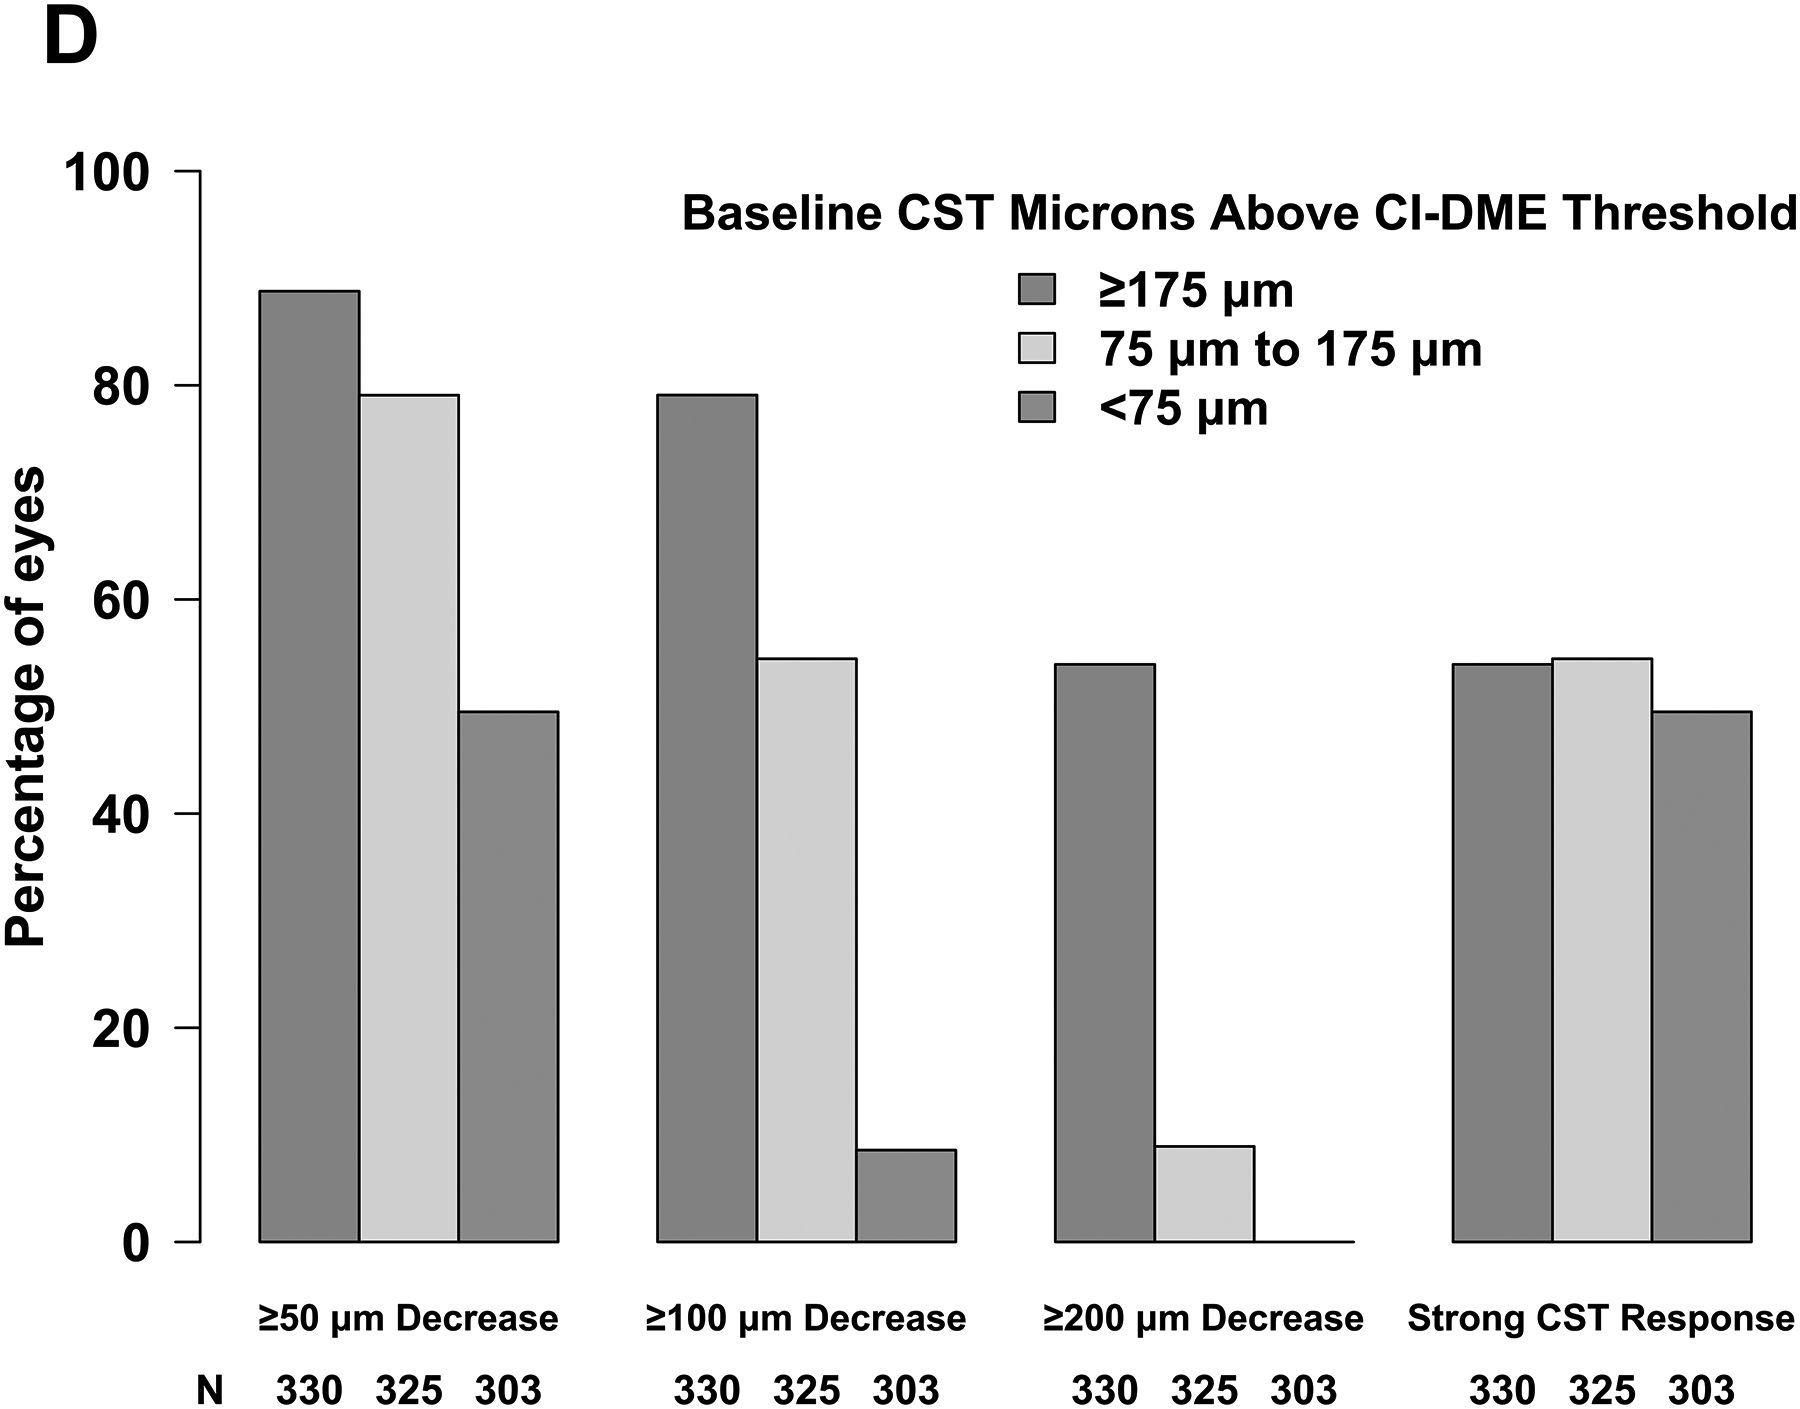
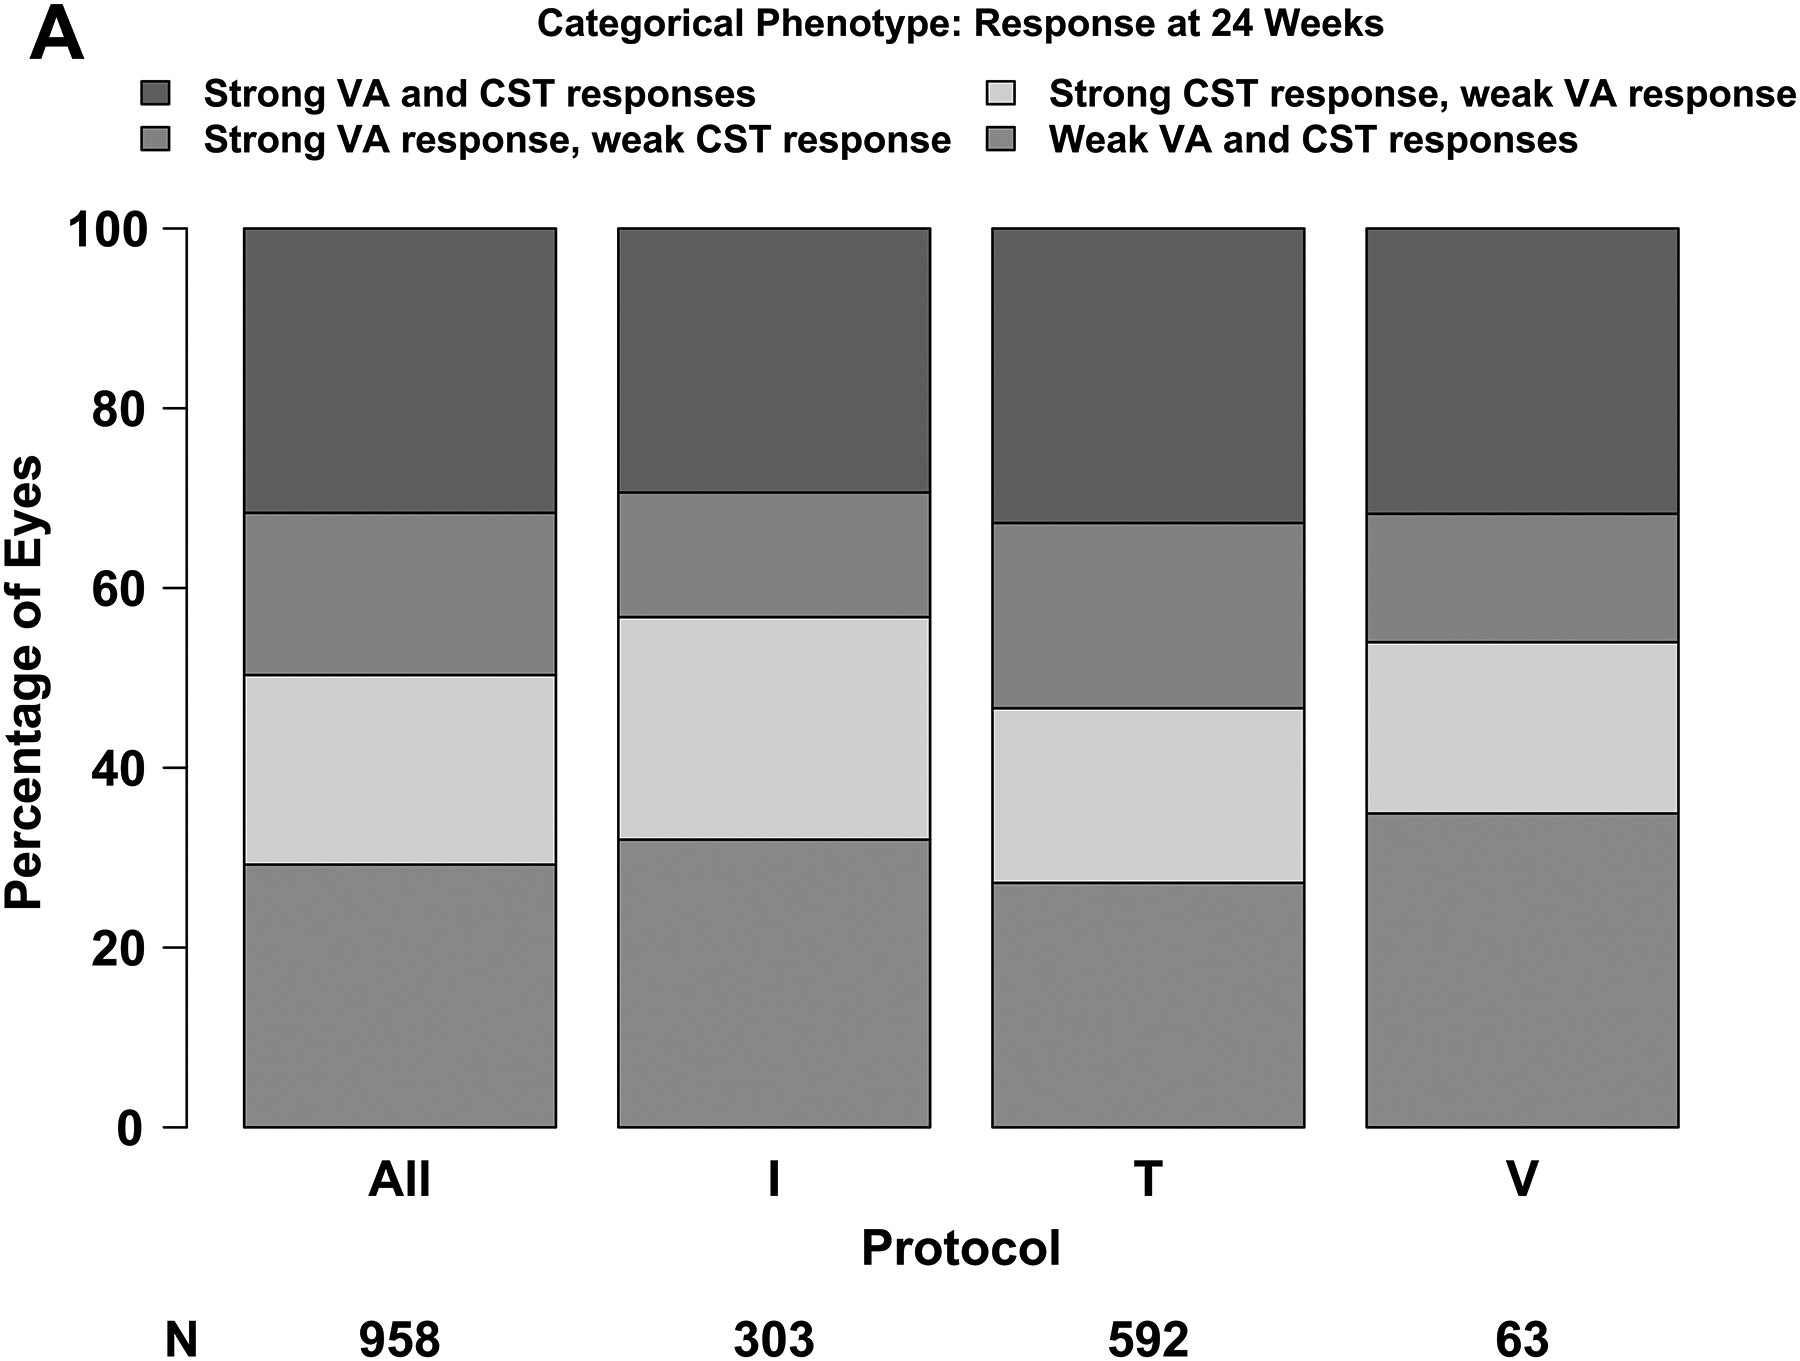
Methods: Exploratory analyses of three DRCR Retina Network randomized trials of eyes with CI-DME treated with aflibercept, bevacizumab, or ranibizumab. Thresholds of 5-, 10-, and 15-letter gain defined strong visual acuity (VA) response when baseline VA was 20/25-20/32, 20/40-20/63, or 20/80-20/320, respectively. Thresholds of 50, 100, or 200- µ m reduction defined strong anatomical response when baseline central subfield thickness (CST) was <75, ≥75 to <175, or ≥175- µ m above standard thresholds. Additional thresholds from regression equations were calculated.

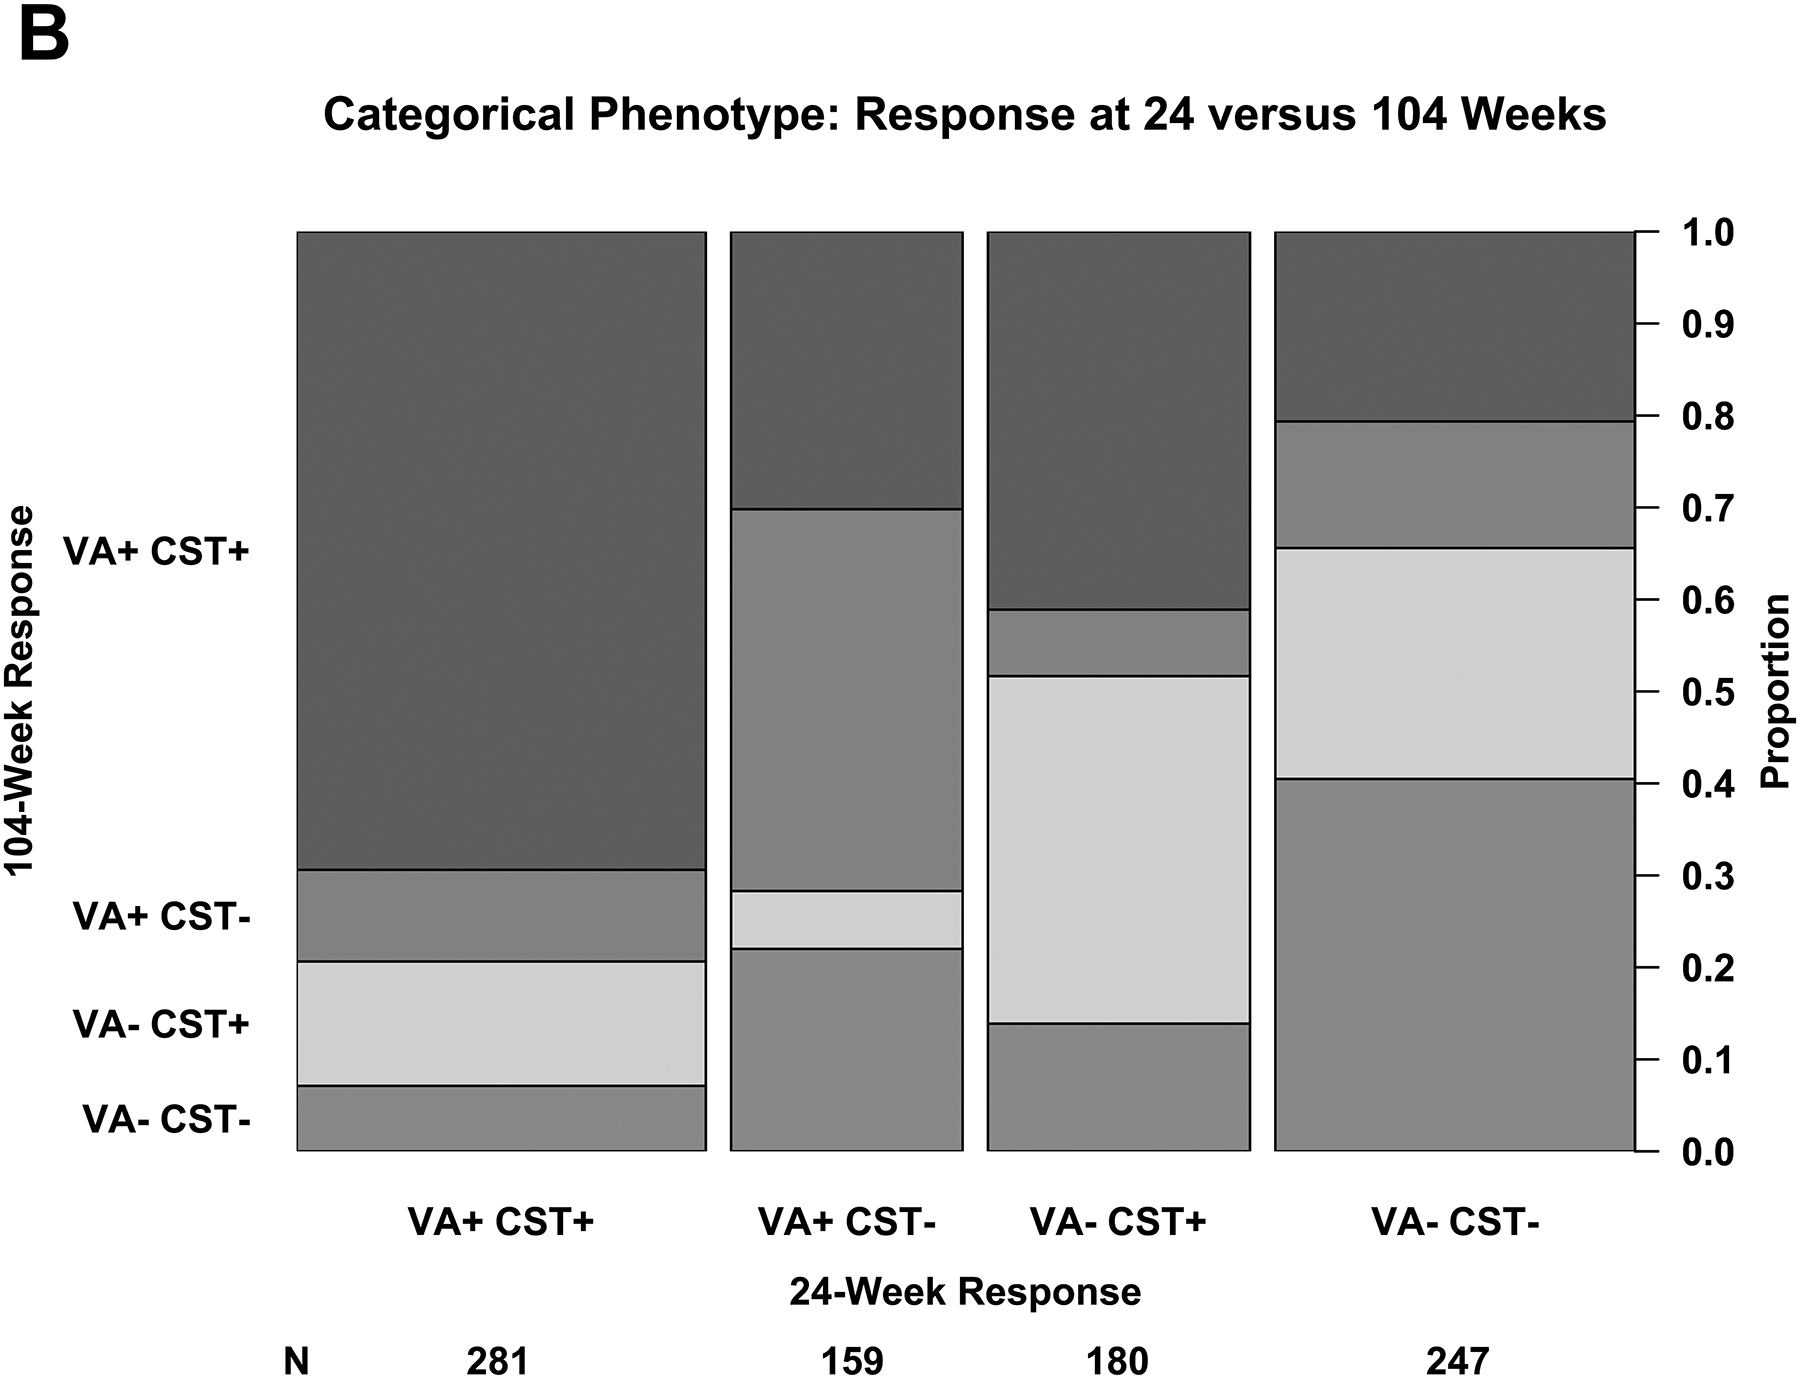
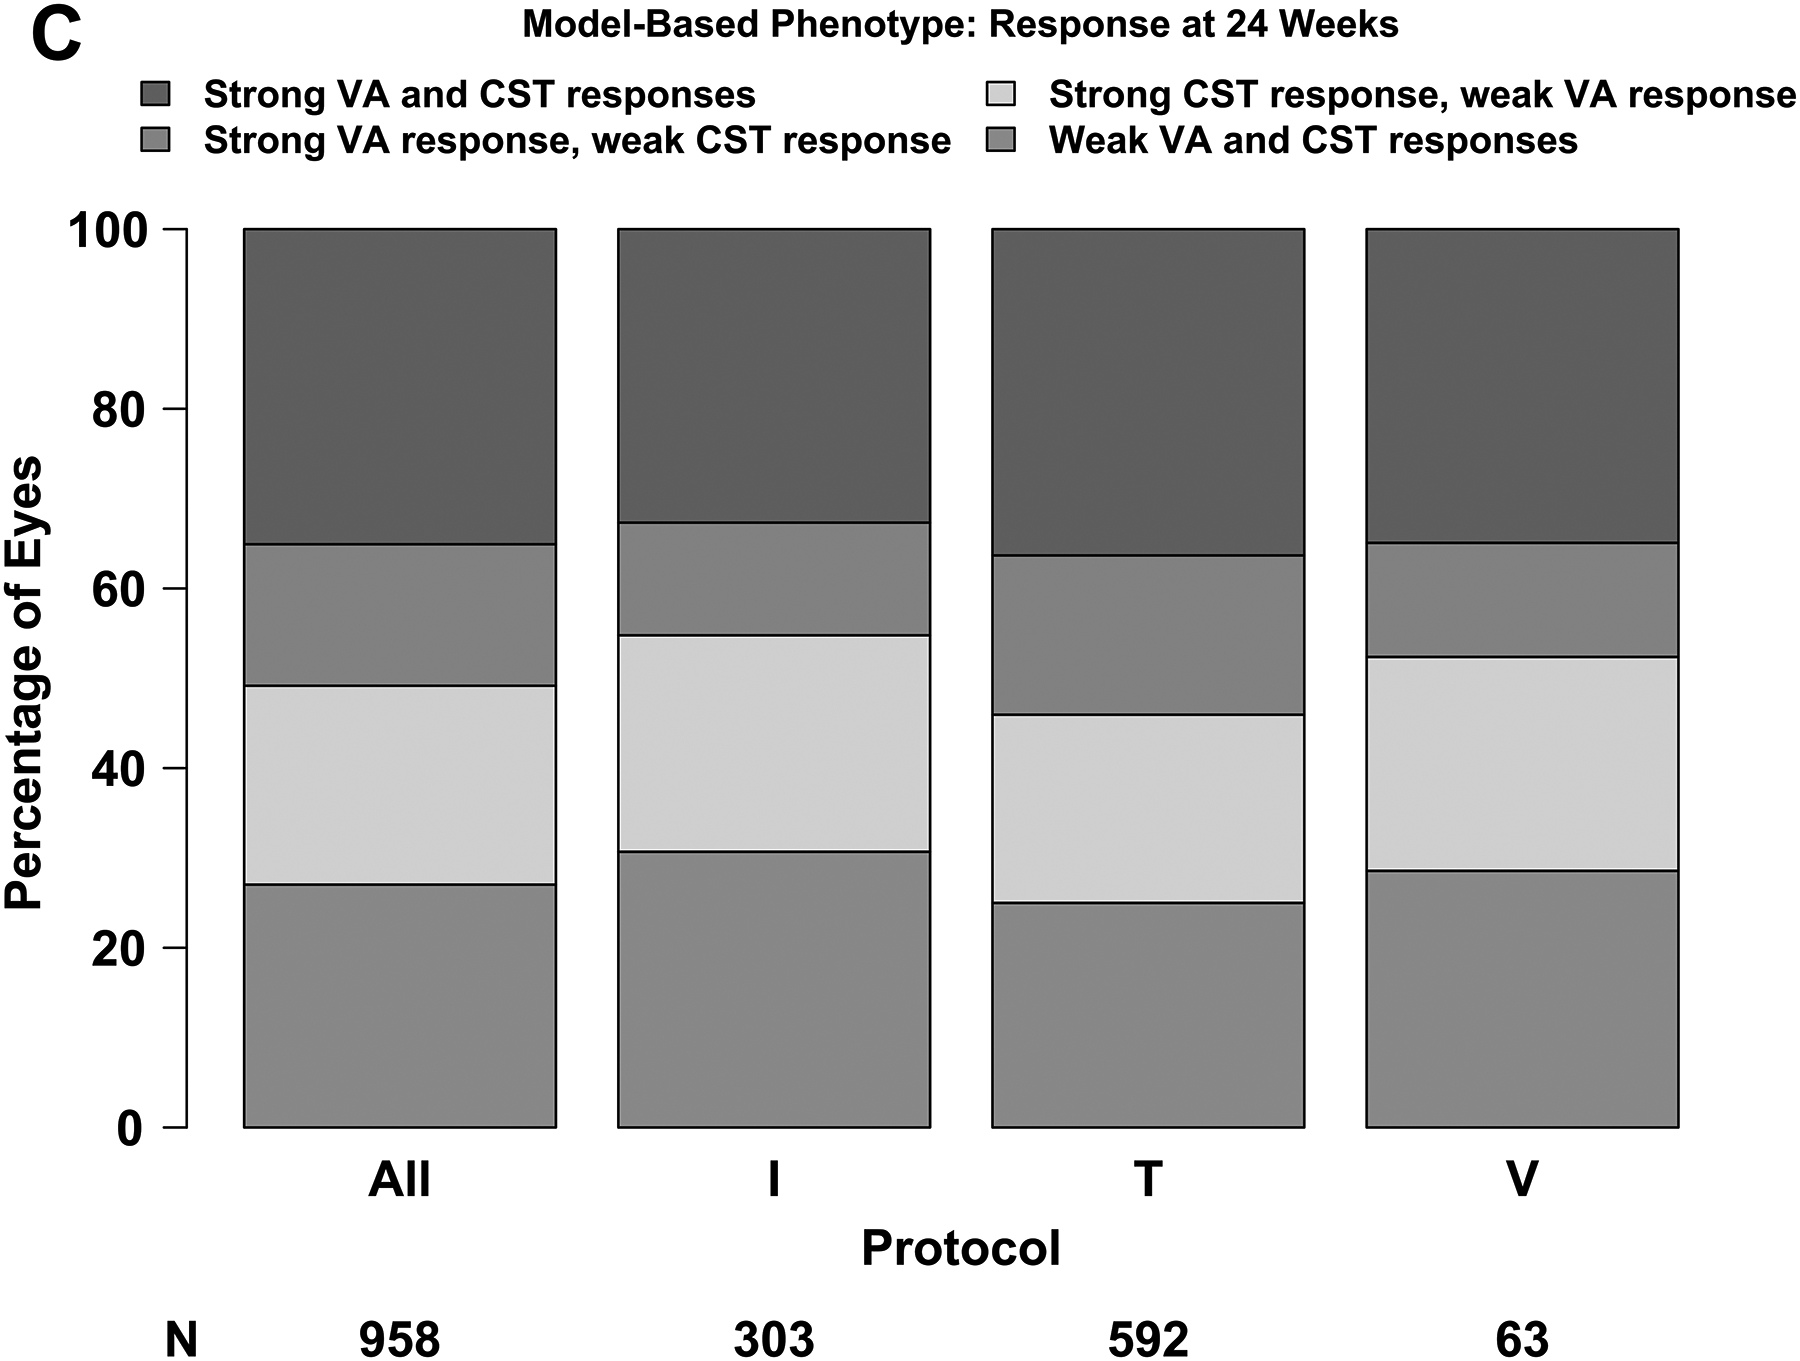
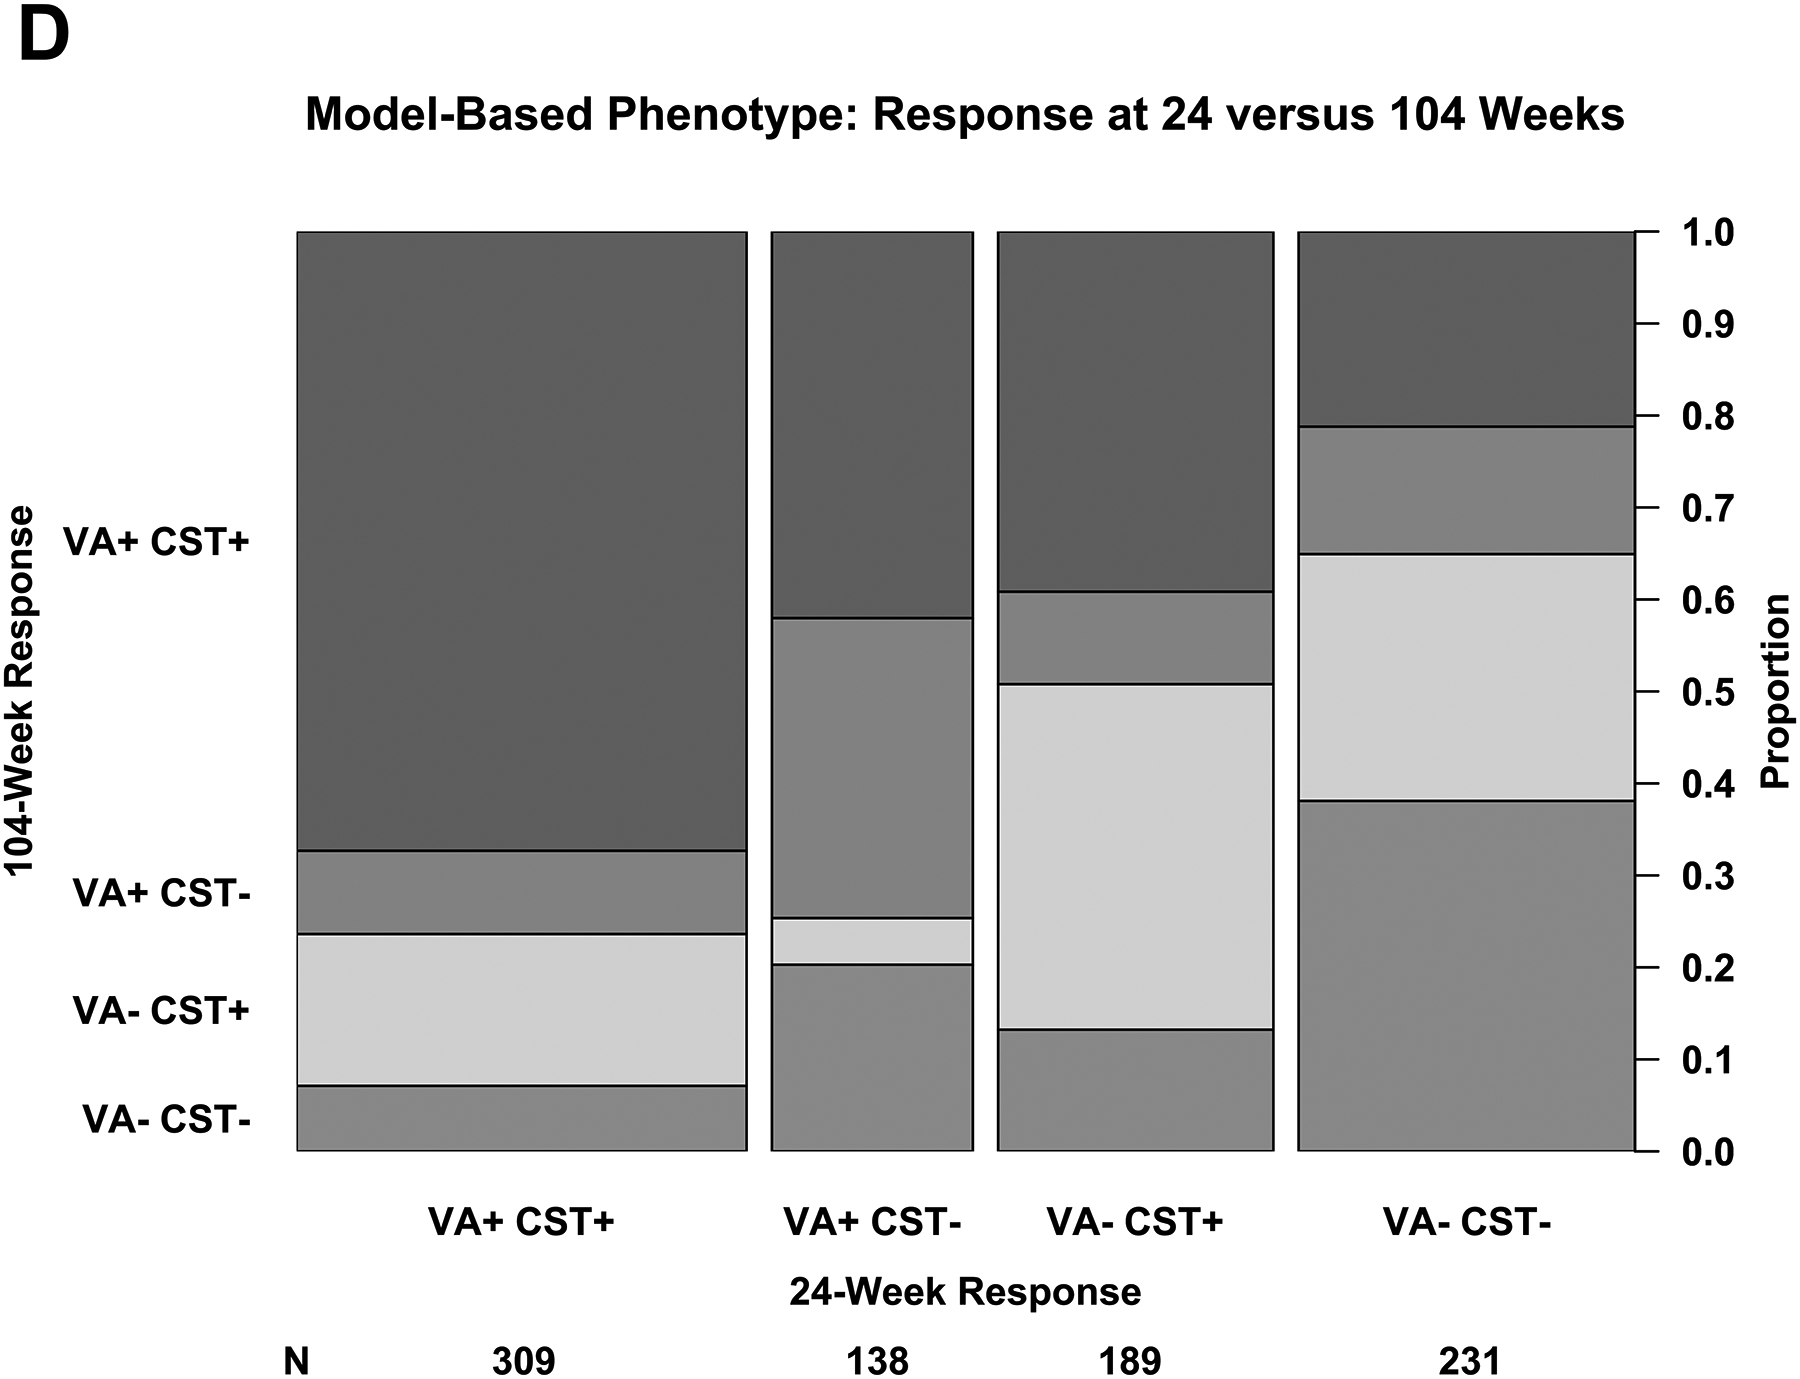
Results: At 24 weeks, outcomes for strong response were achieved by 476 of 958 eyes (50%) for VA and 505 eyes (53%) for CST. At 104 weeks among the 32% of eyes with strong VA and CST response at 24 weeks, 195 of 281 (69%) maintained strong VA and CST response, whereas 20 (7%) had neither strong VA nor strong CST response. Outcomes rates were similar across protocols and when defined using regression equations.

Conclusion: These phenotypes are suitable for efforts to identify predictive biomarkers for response to anti-VEGF therapy for DME and might facilitate comparison of treatment response among diverse cohorts with DME.


Figures

Figure 1.
Figure 1.. Changes in Visual Acuity and Central Subfield Thickness from Baseline at 24 Weeks (A - D).
Abbreviations: AUC = area under the curve; CI-DME = center-involved diabetic macular edema; CST = central subfield thickness; VA = visual acuity. Strong VA response was defined as at least 5-letter gain when baseline VA was 20/25 to 20/32, at least 10-letter gain when baseline VA was 20/40 to 20/63, and at least 15-letter gain when baseline VA was 20/80 to 20/320. (B) Thresholds for CI-DME are defined as follows: Heidelberg Spectralis, at least 305 μm for women and at least 320 μm for men; Zeiss Cirrus, at least 290 μm for women and at least 305 μm for men; Zeiss Stratus at least 250 μm for women and men. (C, D)
Figure 2.
Figure 2.. Visual Acuity and Central Subfield Thickness Status at 24 and 104 Weeks.
(A – D) Plus symbols (“+”) indicate strong response and minus symbols (“-”) indicate weak response. Strong visual acuity (VA) response was defined as at least a 5-, 10-, or 15-letter gain when baseline VA was 20/25 to 20/32, 20/40 to 20/63, and 20/80 to 20/320, respectively. (A, B) Strong central subfield thickness (CST) response was defined as a reduction of at least 50-, 100-, or 200-μm when baseline CST was <75 μm, 75 μm to <175 μm, and ≥175 μm above the CI-DME threshold at baseline. Thresholds for CI-DME are defined as follows: Heidelberg Spectralis, at least 305 μm for women and at least 320 μm for men; Zeiss Cirrus, at least 290 μm for women and at least 305 μm for men; Zeiss Stratus at least 250 μm for women and men. Strong response defined according to the thresholds and equations in eTable 2 and eTable 3. (C, D)
Figure 3.
Figure 3.. Changes in Visual Acuity and Central Subfield Thickness at 24 Weeks: Model-Based Phenotype.
(A-B) Scatterplots showing the observed change in (A) visual acuity and (B) central subfield thickness at 24 weeks with least squares regression lines that define the model-based phenotype for strong and weak response.

References

    1. Diabetic Retinopathy Clinical Research Network. Randomized trial evaluating ranibizumab plus prompt or deferred laser or triamcinolone plus prompt laser for diabetic macular edema. Ophthalmology. 2010;117(6):1064–1077 e1035. - PMC - PubMed
    1. Nguyen QD, Brown DM, Marcus DM, et al. Ranibizumab for diabetic macular edema: Results from 2 phase III randomized trials: RISE and RIDE. Ophthalmology. 2012;119(4):789–801. - PubMed
    1. Korobelnik JF, Do DV, Schmidt-Erfurth U, et al. Intravitreal aflibercept for diabetic macular edema. Ophthalmology. 2014;121(6):2247–2254. - PubMed
    1. Beck RW, Maguire MG, Bressler NM, Glassman AR, Lindblad AS, Ferris FL. Visual acuity as an outcome measure in clinical trials of retinal diseases. Ophthalmology. 2007;114(10):1804–1809. - PubMed
    1. Browning DJ, Glassman AR, Aiello LP, et al. Optical coherence tomography measurements and analysis methods in optical coherence tomography studies of diabetic macular edema. Ophthalmology. 2008;115(8):1366–1371, 1371 e1361. - PMC - PubMed

MeSH terms