. 2023 Jul 1;164(7):1473-1488.
doi: 10.1097/j.pain.0000000000002850. Epub 2022 Dec 19.

Targeting the vascular endothelial growth factor A/neuropilin 1 axis for relief of neuropathic pain

Affiliations

Targeting the vascular endothelial growth factor A/neuropilin 1 axis for relief of neuropathic pain

Harrison J Stratton et al. Pain. .

Abstract

Vascular endothelial growth factor A (VEGF-A) is a pronociceptive factor that causes neuronal sensitization and pain. We reported that blocking the interaction between the membrane receptor neuropilin 1 (NRP1) and VEGF-A-blocked VEGF-A-mediated sensory neuron hyperexcitability and reduced mechanical hypersensitivity in a rodent chronic neuropathic pain model. These findings identified the NRP1-VEGF-A signaling axis for therapeutic targeting of chronic pain. In an in-silico screening of approximately 480 K small molecules binding to the extracellular b1b2 pocket of NRP1, we identified 9 chemical series, with 6 compounds disrupting VEGF-A binding to NRP1. The small molecule with greatest efficacy, 4'-methyl-2'-morpholino-2-(phenylamino)-[4,5'-bipyrimidin]-6(1H)-one, designated NRP1-4, was selected for further evaluation. In cultured primary sensory neurons, VEGF-A enhanced excitability and decreased firing threshold, which was blocked by NRP1-4. In addition, NaV1.7 and CaV2.2 currents and membrane expression were potentiated by treatment with VEGF-A, and this potentiation was blocked by NRP1-4 cotreatment. Neuropilin 1-4 reduced VEGF-A-mediated increases in the frequency and amplitude of spontaneous excitatory postsynaptic currents in dorsal horn of the spinal cord. Neuropilin 1-4 did not bind to more than 300 G-protein-coupled receptors and receptors including human opioids receptors, indicating a favorable safety profile. In rats with spared nerve injury-induced neuropathic pain, intrathecal administration of NRP1-4 significantly attenuated mechanical allodynia. Intravenous treatment with NRP1-4 reversed both mechanical allodynia and thermal hyperalgesia in rats with L5/L6 spinal nerve ligation-induced neuropathic pain. Collectively, our findings show that NRP1-4 is a first-in-class compound targeting the NRP1-VEGF-A signaling axis to control voltage-gated ion channel function, neuronal excitability, and synaptic activity that curb chronic pain.


Figures

Figure 1 –
Figure 1 –. Domain structure of NRP1 and docking of NRP1–4 to NRP1.
(A) Domain architecture of NRP1 consists of the extracellular N-terminus (N), tandem CUB domains (a1, a2), tandem F5/8 type C domains (b1, b2), a MAM domain, the transmembrane helix (TM) and the cytoplasmic PDZ domain (C). (B) Surface representation of the b1 domain with docked NRP1–4 (gold sticks). (C) Close-up of NRP1–4 docked to the VEGF-A CENDR binding pocket. Potential hydrogen bonds indicated with dashed lines. Docking was done as described by Perez-Miller, S., et al. 2021 [55].
Figure 2 –
Figure 2 –. VEGF-A increases excitability decreases rheobase of DRG neurons that is blocked by co-treatment with NRP1–4.
(A) Representative traces showing action potentials elicited from DRG neurons following injection of 60pA of depolarizing current into small DRG neurons. Neurons were given either no treatment or treated with the indicated compound/protein. (B) Quantification of action potentials evoked by sequentially increasing current steps injected into the soma. Yellow box highlights 60 pA current step where traces were extracted. (C) Bar graph comparing of the number of action potentials fired by DRG neurons treated with the indicated compound or protein at 60 pA as highlighted by the yellow box in B. (D) Scatter plot showing rheobase, or the current required to fire a single action potential. VEGF-A treatment reduced the rheobase and this was blocked by NRP1–4. (E) Scatter plots of the resting membrane potential compared among the groups treated with indicated compounds or proteins. There was no significant difference between the groups for any treatment condition. No-Drug control has nothing added to the recording media. Vehicle was 0.1% DMSO dissolved in the culture media and external recording solution. VEGF-A applied at 1nM and NRP1–4 at 12.5 μM. Data points are mean ± SEM; N as indicated in panel A; Two-way ANOVA used to evaluate statistical differences in (B); Kruskal-Wallis test with Dunn’s multiple comparisons test for panels C-E.
Figure 3 –
Figure 3 –. Administration of NRP1–4 blocks VEGF-A mediated increase in sodium currents.
(A) Schematic diagram showing the recording configuration for whole-cell patch clamp measurements of isolated DRG neurons. (B) Representative current traces obtained from DRG neurons following treatment with the indicated compound or protein. (C) Current-density voltage plot for each of the above conditions demonstrating that VEGF-A enhances sodium currents, and that this enhancement can be blocked by co-application of NRP1–4. Current density was obtained by normalizing the inward current measured at each voltage step to cellular capacitance. (D) Peak sodium current densities for the indicated treatment conditions indicating that treatment with NRP1–4 blocks the VEGF-A induced increase in current density. (E) Voltage dependent activation curves for the above treatment conditions showing that there is no significant change in this measure due to treatment with VEGF-A or NRP1–4. Vehicle was 0.1% DMSO dissolved in the culture media and external recording solution. VEGF-A applied at 1nM and NRP1–4 at 12.5 μM. Data points are mean ± SEM; N as indicated in panel A; statistical differences determined using one-way analysis of variance, which was performed because all data passed the D’Agostino-Pearson test for normality. Biophysical properties reported in Table S2.
Figure 4 –
Figure 4 –. VEGF-A mediated increase in DRG sodium currents is due to NaV1.7.
(A) Representative current traces obtained from DRG neurons following treatment with the indicated compound or protein. (B) Current-density voltage plot for each of the above conditions demonstrating that VEGF-A enhances sodium currents, and that this enhancement can be blocked by co-application of NRP1–4. This VEGF-A dependent increase in sodium current is reduced by co-treatment with PrTx-II (5 nM), a selective NaV1.7 inhibiting peptide. Current density was obtained by normalizing the inward current measured at each voltage step to cellular capacitance. (D) Peak sodium current densities for the indicated treatment conditions illustrating that treatment with NRP1–4 blocks the VEGF-A induced increase in current density. No further decrease is seen when NRP1–4 is applied in combination with VEGF-A and PrTx-II. (E) Voltage dependent activation curves for the above treatment conditions showing that there is no significant change in this measure due to treatments applied. Vehicle was 0.1% DMSO dissolved in the culture media and external recording solution. VEGF-A applied at 1nM, NRP1–4 at 12.5 μM, and PrTx-II at 5nM (in PBS). Data points are mean ± SEM; N as indicated in panel A; statistical differences determined Kruskal-Wallis test followed by Dunn’s multiple comparisons test, All distributions were assessed with the D’Agostino-Pearson test for normality. Biophysical properties reported in Table S2.
Figure 5 –
Figure 5 –. NRP1–4 blocks VEGF-A mediated increase in N-type calcium currents.
(A) Schematic diagram showing the recording configuration for whole-cell patch clamp measurements of isolated sensory neurons in the presence of calcium channel blockers to isolate N-type calcium currents. (B) Diagram depicting the voltage protocols used to elicit currents from DRG neurons and investigate the properties of activation and inactivation of voltage-gated calcium channels. (C) Representative current traces obtained from DRG neurons following treatment with the indicated compound or protein. (D) Current-density voltage plot for each of the above conditions demonstrating that VEGF-A enhances N-type calcium currents, and that this enhancement can be blocked by co-application of NRP1–4. Current density was obtained by normalizing the inward current measured at each voltage step to cellular capacitance. (E) Peak calcium current densities for the indicated treatment conditions illustrating that treatment with NRP1–4 blocks the VEGF-A induced increase in N-type current density. Treatment with NRP1–4 alone had no effect on N-type peak current density. (F) Voltage dependent activation curves and steady state fast inactivation for the above treatment conditions showing that there is no significant change in these biophysical channel properties due to treatment with VEGF-A or NRP1–4. Vehicle was 0.1% DMSO dissolved in the culture media and external recording solution. VEGF-A applied at 1nM and NRP1–4 at 12.5 μM. Toxins used were dissolved in DMSO or PBS and the same amount of each solvent was added to the vehicle condition. Data points are mean ± SEM; N as indicated in panel C; statistical differences determined using Mann-Whitney test after performing D’Agostino-Pearson test for normality. Biophysical properties reported in Table S2.
Figure 6 -
Figure 6 -. NRP1–4 prevents VEGF-A mediated increase in CaV2.2 and NaV1.7 surface expression in rat DRG neurons.
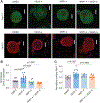
(A) Representative confocal images of rat DRG neuron cultures following treatment with the indicated protein or compound and labeled with an antibody against CaV2.2 or NaV1.7. Scale bar: 10 μm. (B) Quantification of normalized surface expression of CaV2.2 per neuron shows that treatment with NRP1–4 compound blocks the VEGF-A induced increase in surface expression of CaV2.2. Treatment with NRP1–4 alone had no effect. (C) Quantification of normalized surface expression of NaV1.7 for individual neurons illustrating that treatment with NRP1–4 also blocks the VEGF-A induced increase in surface expression of NaV1.7. Vehicle was 0.1% DMSO dissolved in the culture media and external recording solution. VEGF-A applied at 1nM and NRP1–4 at 12.5 μM. Data points are mean ± SEM; One-way ANOVA test with Holm-Sidak multiple comparisons for (B) and Tukey’s multiple comparison post hoc test for (C); N= 11–18 cells per group
Figure 7 –
Figure 7 –. NRP1–4 reverses VEGFA-mediated increase in frequency of spontaneous excitatory postsynaptic currents in the lumbar dorsal horn.
(A) Representative traces of sEPSC recordings from substantia gelatinosa (SG) in the superficial dorsal horn (lamina I/II) treated for at least 30 minutes with the indicated conditions: VEGFA (4 nM), NRP1–4 (VEGFA/NRP1 binding inhibitor, 12.5 μM), or both. (B) Cumulative distribution of sEPSC inter-event intervals recorded from SG neurons. Inset: Bar graph with scatter plot showing sEPSC frequency. (C) Cumulative distribution of sEPSC amplitudes intervals recorded from SG neurons. Inset: Bar graph with scatter plot showing sEPSC amplitude. Addition of VEGFA increased sEPSC frequency in the SDH but selective knockdown of VEGFA/NRP1 interaction with NRP1–4 compound blocked this effect. Vehicle was 0.1% DMSO and PBS dissolved in the external recording solution. VEGF-A applied at 4 nM and NRP1–4 at 12.5 μM. Data are expressed as mean ± SEM. One way ANOVA with Tukey’s post hoc test for multiple comparisons. For full statistical analyses, see Table S1.
Figure 8 –
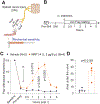
Figure 8 –. Intrathecal injection of NRP1–4 reverses mechanical allodynia following spared nerve injury.
(A) Diagram representing the spared nerve injury (SNI) paradigm where the common peroneal and tibial nerves are ligated but the sural nerve is left intact. This model of neuropathic pain produces robust and highly reproducible hypersensitivity on the side ipsilateral to the injury. (B) Timeline of the experimental paradigm indicating that pre-SNI baseline measurements of withdrawal threshold were taken before nerve injury. Animals were then randomly assigned to a treatment group and on the day of the injection mechanical allodynia was verified. An intrathecal injection was then administered using an implanted catheter extending to the lumbar level of the spinal cord and withdrawal thresholds were followed for five hours post injection. (C) Central administration of NRP1–4 reverses mechanical hypersensitivity associated with nerve injury for three hours following treatment. (D) Quantification of the area bounded by the curve and the x-axis to compare the total reversal of hypersensitivity between groups. This comparison shows a robust reversal of mechanical allodynia following treatment with NRP1–4. Vehicle was 0.1% DMSO dissolved in sterile saline for injection, which is the same ratio of DMSO used to dissolve NRP1–4 for the drug treated group. Data points are mean ± SEM; N as indicated in panel C; Statistical differences determined using nonparametric two-way ANOVA with time as the within subject factor and treatment as the between subject factor and Sidak’s posthoc test for multiple comparisons; Differences in area under the curve were determined using the Mann-Whitney test. The experiments were conducted by an experimenter blinded to the treatment condition For full statistical analyses, see Table S1.
Figure 9 –
Figure 9 –. NRP1–4 is antinociceptive following spinal nerve ligation.
Ligature of L5 and L6 spinal nerves (SNL) was performed in male rats to induce chronic neuropathic pain. Sham surgeries were performed without any ligation. Two weeks post-surgery, animals were administered saline solution (vehicle) or NRP1–4 (20 μg) through intravenous (i.v.) injections (200 μL). Yellow triangles indicate the time of i.v. injections. (A) Mechanical sensitivity was evaluated over 5 hours using von Frey filament test. (B) Area under the curve analysis for mechanical withdrawal thresholds presented in panel A. NRP1–4 provided antinociception in rats subjected to chronic neuropathic pain (n=6–8, Kruskal Wallis test followed by Dunn’s multiple comparisons posthoc test). (C) Thermal sensitivity was evaluated over 5 hours using Hargreaves test. (D) Area under the curve analysis for thermal withdrawal latencies presented in panel C. NRP1–4 provided antinociception in rats subjected to chronic neuropathic pain (n=6–8, Kruskal Wallis test followed by Dunn’s multiple comparisons posthoc test). Values represent mean ± standard error of the mean. *p<0.05, **p<0.01, ***p<0.001, ****p<0.0001 for SNL-NRP1–4 vs SNL-Saline. The experiments were conducted by an experimenter blinded to the treatment conditions. For full statistical analyses, see Table S1.

Comment in

References

    1. Amour FE, Smith DL. A METHOD FOR DETERMINING LOSS OF PAIN SENSATION. Journal of Pharmacology and Experimental Therapeutics 1941;72(1):74.
    1. Basbaum AI, Bautista DM, Scherrer G, Julius D. Cellular and molecular mechanisms of pain. Cell 2009;139(2):267–284. - PMC - PubMed
    1. Bennett GJ, Xie YK. A peripheral mononeuropathy in rat that produces disorders of pain sensation like those seen in man. Pain 1988;33(1):87–107. - PubMed
    1. Besnard J, Ruda GF, Setola V, Abecassis K, Rodriguiz RM, Huang XP, Norval S, Sassano MF, Shin AI, Webster LA, Simeons FR, Stojanovski L, Prat A, Seidah NG, Constam DB, Bickerton GR, Read KD, Wetsel WC, Gilbert IH, Roth BL, Hopkins AL. Automated design of ligands to polypharmacological profiles. Nature 2012;492(7428):215–220. - PMC - PubMed
    1. Blevins JE, Stanley BG, Reidelberger RD. DMSO as a vehicle for central injections: tests with feeding elicited by norepinephrine injected into the paraventricular nucleus. Pharmacol Biochem Behav 2002;71(1–2):277–282. - PubMed

Publication types

Substances