. 2023 Apr;145(4):439-459.
doi: 10.1007/s00401-023-02541-9. Epub 2023 Feb 2.

Associations of psychiatric disease and ageing with FKBP5 expression converge on superficial layer neurons of the neocortex

Affiliations

Associations of psychiatric disease and ageing with FKBP5 expression converge on superficial layer neurons of the neocortex

Natalie Matosin et al. Acta Neuropathol. 2023 Apr.

Abstract

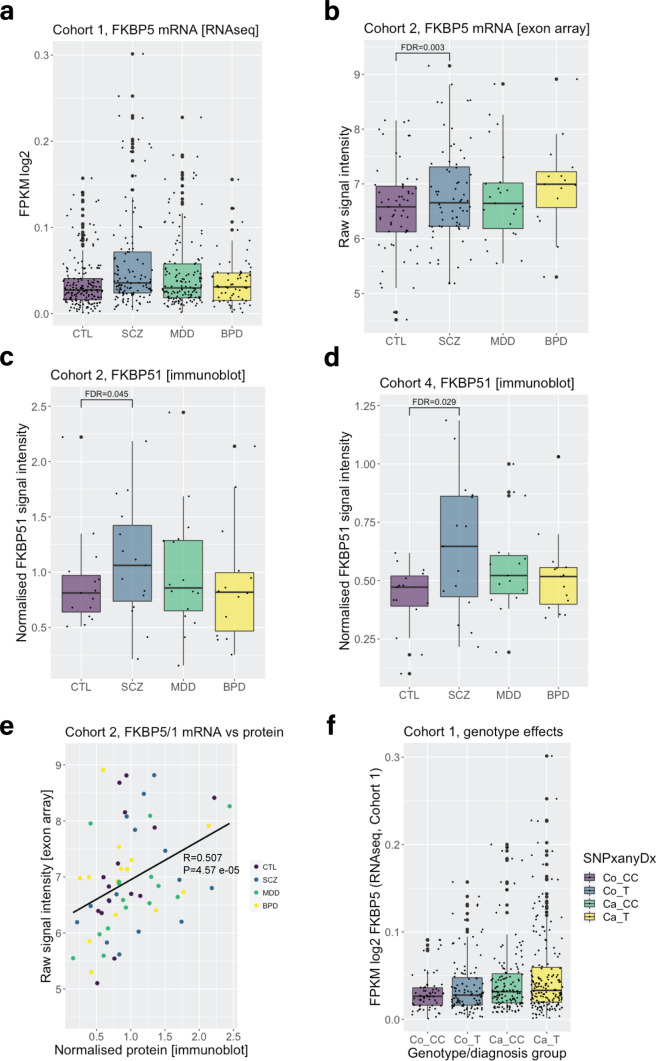
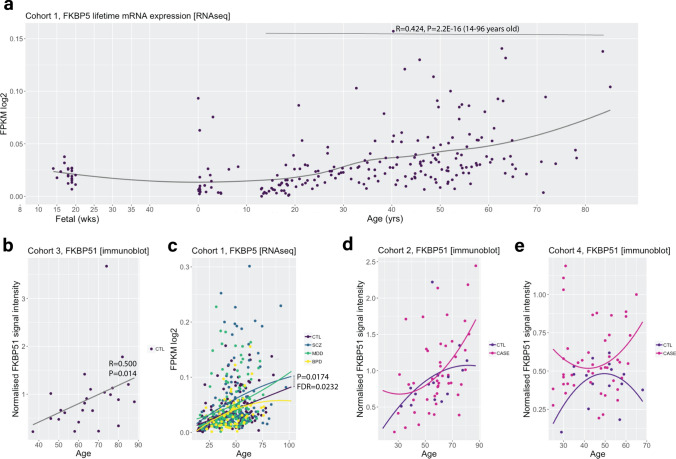
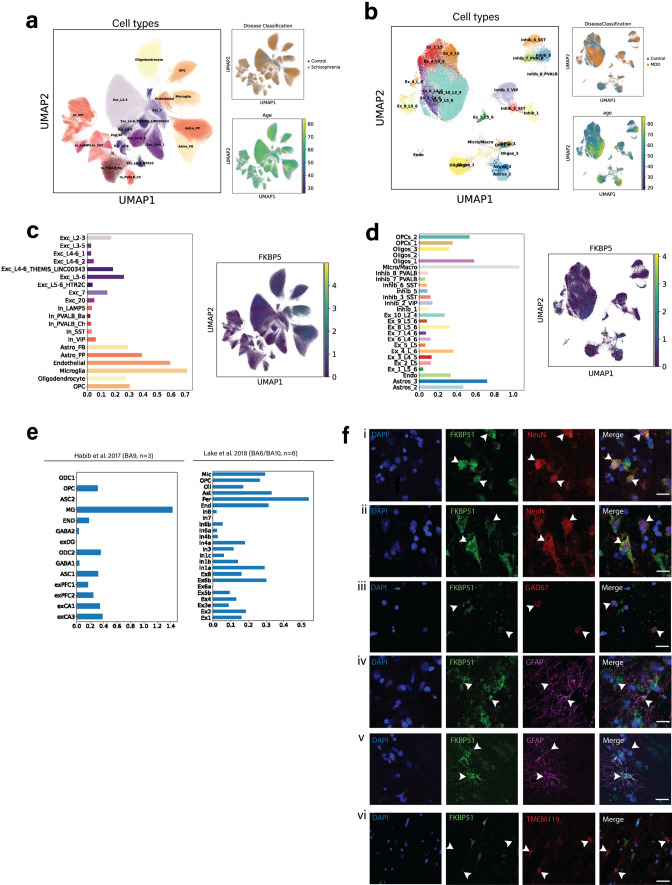
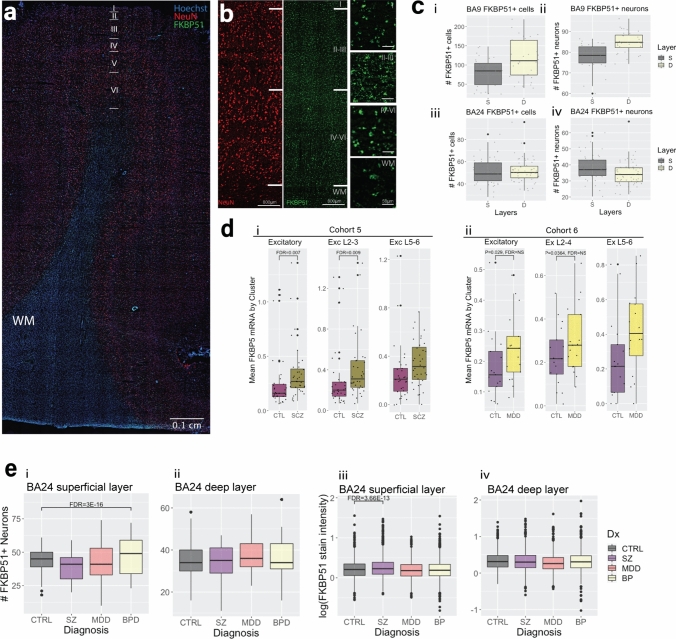
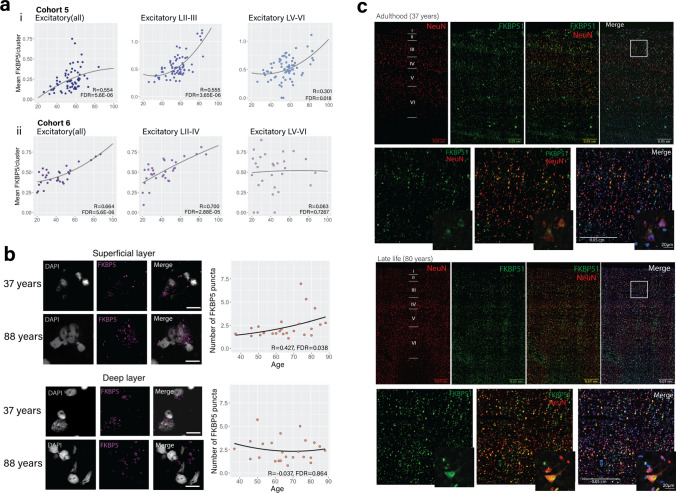
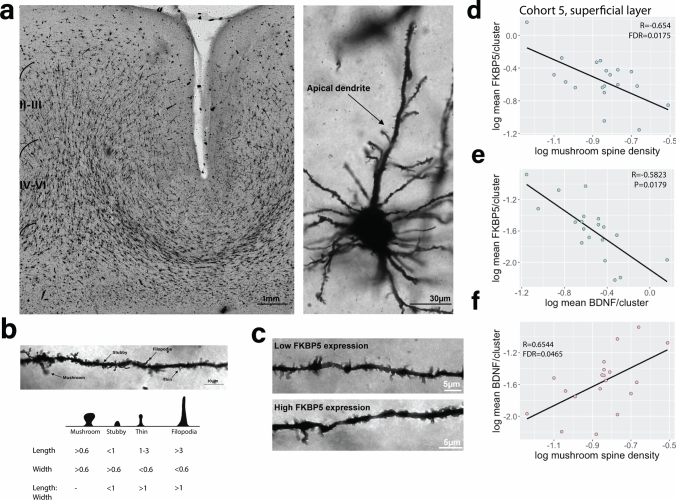
Identification and characterisation of novel targets for treatment is a priority in the field of psychiatry. FKBP5 is a gene with decades of evidence suggesting its pathogenic role in a subset of psychiatric patients, with potential to be leveraged as a therapeutic target for these individuals. While it is widely reported that FKBP5/FKBP51 mRNA/protein (FKBP5/1) expression is impacted by psychiatric disease state, risk genotype and age, it is not known in which cell types and sub-anatomical areas of the human brain this occurs. This knowledge is critical to propel FKBP5/1-targeted treatment development. Here, we performed an extensive, large-scale postmortem study (n = 1024) of FKBP5/1, examining neocortical areas (BA9, BA11 and ventral BA24/BA24a) derived from subjects that lived with schizophrenia, major depression or bipolar disorder. With an extensive battery of RNA (bulk RNA sequencing, single-nucleus RNA sequencing, microarray, qPCR, RNAscope) and protein (immunoblot, immunohistochemistry) analysis approaches, we thoroughly investigated the effects of disease state, ageing and genotype on cortical FKBP5/1 expression including in a cell type-specific manner. We identified consistently heightened FKBP5/1 levels in psychopathology and with age, but not genotype, with these effects strongest in schizophrenia. Using single-nucleus RNA sequencing (snRNAseq; BA9 and BA11) and targeted histology (BA9, BA24a), we established that these disease and ageing effects on FKBP5/1 expression were most pronounced in excitatory superficial layer neurons of the neocortex, and this effect appeared to be consistent in both the granular and agranular areas examined. We then found that this increase in FKBP5 levels may impact on synaptic plasticity, as FKBP5 gex levels strongly and inversely correlated with dendritic mushroom spine density and brain-derived neurotrophic factor (BDNF) levels in superficial layer neurons in BA11. These findings pinpoint a novel cellular and molecular mechanism that has potential to open a new avenue of FKBP51 drug development to treat cognitive symptoms in psychiatric disorders.

Keywords: Ageing; Depression; FKBP5; FKBP51; Postmortem brain; Psychosis; Single cell; Stress.


Conflict of interest statement

Dr Binder is a co-inventor of the following patent applications: FKBP5: a novel target for antidepressant therapy. European Patent # EP1687443 B1: Polymorphisms in ABCB1 associated with a lack of clinical response to medicaments. United States Patent # 8030033; Means and methods for diagnosing predisposition for treatment emergent suicidal ideation (TESI). European application number: 08016477.5, international application number: PCT/EP2009/061575. Dr Falkai has been an honorary speaker for AstraZeneca, Bristol Myers Squibb, Eli Lilly, Essex, GE Healthcare, GlaxoSmithKline, Janssen Cilag, Lundbeck, Otsuka, Pfizer, Servier and Takeda. During the past 5 years, but not presently, Dr Falkai has been a member of the advisory boards of Janssen-Cilag, AstraZeneca, Eli Lilly and Lundbeck. Dr Schmitt has been an honorary speaker for TAD Pharma and Roche and has been a member of advisory boards for Roche. The remaining authors declare no competing interests or conflicts of interest.

Figures

Fig. 1
Fig. 1
Differences in dorsolateral prefrontal cortex FKBP5/FKBP51 expression in schizophrenia, major depression and bipolar disorder vs controls. a In Cohort 1, linear regression modelling revealed FKBP5 expression was significantly increased in subjects with schizophrenia and major depression compared to controls. Gene expression in Cohort 1 was measured with bulk RNA sequencing assessing reads covering an exon–exon junction between exon 5 and exon 6, common to all FKBP5 alternative transcripts (chr6:35,565,191–35,586,872). b In Cohort 2, linear regression modelling revealed that FKBP5 expression was significantly increased in subjects with schizophrenia compared to controls. Gene expression in Cohort 2 was measured with exon arrays assessing signal intensity from FKBP5 exon 5 (ENSE00000747342.1) which sits adjacent to the FKBP5 exon–exon junction used to assess FKBP5 with RNAseq in Cohort 1. c Linear regression modelling revealed FKBP51 protein expression in Cohort 2 was increased in schizophrenia subjects compared to controls. FKBP51 protein expression was measured with immunoblot, with FKBP51 signal intensity normalised to a loading control and pool to account for sample-to-sample and gel-to-gel variability. d Linear regression modelling revealed FKBP51 protein expression in Cohort 4 was increased in schizophrenia subjects compared to controls. FKBP51 protein expression was measured with immunoblot, with FKBP51 signal intensity normalised to a loading control and pool to account for sample-to-sample and gel-to-gel variability. e FKBP5 mRNA and FKBP51 protein expression in Cohort 2 were significantly and positively correlated (all subjects analysed together irrespective of diagnosis, Spearman’s correlation). f In Cohort 1 (RNAseq), we observed a main effect of case status on FKBP5 mRNA expression (B = 0.01144, t = 2.989, P = 0.0.00295), but there was no additive effect of genotype (B = 0.00144, t =  – 0.592, P = 0.55399). Abbreviations: Co, control; Ca, Case; CC, CC homozygotes and T, T carriers. “SNPanyDx” indicates that this was across all cases combined. Abbreviations: BPD bipolar disorder, CTL control, gex gene expression, FDR false discovery rate corrected P values (to account for multiple comparisons), MDD major depressive disorder, SCZ schizophrenia, Cohorts detailed in Table 1
Fig. 2
Fig. 2
Effects of age on cortical FKBP5/1 expression levels over the lifetime and in major psychiatric illnesses. a Trajectory of FKBP5 gene expression in control subjects over the life span in BA9, from foetal time points to 88 years of age (Cohort 1, loess fit curve). FKBP5 gene expression increased over the life course in healthy subjects and was positively correlated with age between 14 and 96 years of age (calculated with Spearman’s correlations). b FKBP51 protein expression in BA9 was positively correlated with age in Cohort 3 (calculated with Spearman’s correlations). c FKBP5 ageing trajectory was significantly heightened in schizophrenia subjects vs controls in BA9 (Cohort 1, comparison of nonparametric curves achieved using sm.ancova statistics). d–e FKBP51 protein ageing trajectories were not significant in cases vs controls in Cohort 2 (BA9) or Cohort 4 (B24a). The plots show a comparison of nonparametric curves achieved using sm.ancova statistics. Abbreviations: BPD bipolar disorder, CTL control, MDD major depressive disorder, SCZ schizophrenia, cohorts detailed in Table 1
Fig. 3
Fig. 3
Cell-type distribution of FKBP5/FKBP51 expression in the neocortex (BA9, BA10, BA6, BA11). In a Cohort 5 (BA11), and b Cohort 6 (BA9), dimensionality reduction uniform manifold approximation and projection (UMAP) plots depicting total cells across all individuals. The colours indicate the delineated sub-cell type clusters (left of each panel), the distribution of diagnosis across the clusters (top right), and the distribution of age across clusters (bottom right). In c Cohort 5 and d Cohort 6, bar plots show the average FKBP5 gene expression per cell-type cluster, as well as FKBP5 expression across cell clusters. e Bar plots showing the average FKBP5 gene expression per cell type cluster in previously published datasets [20, 38] f Co-localisation of FKBP51 protein expression (green) with nuclear marker DAPI (blue) and (i) NeuN+ neurons (red) in the superficial layer layer; (ii) NeuN+ neurons in the deep layer; (iii) GAD67+ neurons; (iv–v) GFAP+ astrocytes (top showing no colocalization and bottom showing strong colocalization); (vi) TMEM119+ microglia. Scale bar for all images = 20 µm
Fig. 4
Fig. 4
Case–control differences in FKBP5/1 levels in superficial vs deep layer cortical layer excitatory neurons. a Representative tilescan image showing FKBP51 staining in a section of BA9 cortex. b Same image at higher magnification showing the pattern of NeuN neuronal staining (red) and FKBP51 staining (green) across the cortical layers. Layers ~ II–III denote the superficial cortex, layers ~ V–VI denote the deep cortex and WM denotes the white matter. c Box plots showing the number of FKBP51+ cells (left) and neurons (right) in BA9 (i–ii) and in BA24a (iii–iv). S denotes the superficial layer, and D denotes the deep layer. d snRNAseq data from Cohort 5 (i) and Cohort 6 (ii) showing FKBP5 gene expression levels in the excitatory neuron group (total, left), excitatory neurons from cortical layer 2–4 (Exc 2–4, middle) and layer 5–6 (Exc 5–6, right) in control (CTL) vs schizophrenia (SCZ) and major depressive disorder (MDD). FKBP5 expression was significantly higher in schizophrenia, but not depression, vs controls after correcting for multiple comparisons. Data were analysed using linear regression modelling. e Box plots of immunohistochemistry data demonstrating the number of FKBP51+ neurons in (i) the superficial layer and (ii) the deep layer in each psychiatric disorder, as well as the intensity in the superficial (iii) and deep layers in each psychiatric disorder. All differences illustrated with box plots were calculated with linear regression modelling. Abbreviations: CTRL controls, SZ schizophrenia, MDD major depressive disorder, BP bipolar disorder
Fig. 5
Fig. 5
Layer-specific patterns of FKBP51 expression across the neocortex. a snRNAseq data showing FKBP5 gene expression vs age in excitatory neurons (all, left), superficial (LII–III, middle) and deep (LV–VI, left) neuron clusters in (i) Cohort 5 (BA11), and (ii) Cohort 6 (BA9) using Spearman correlations. b RNAscope representative images (left) and results of quantification and analysis with Spearman correlations (right) showing that there was a positive association between FKBP5 gene expression (purple puncta, scale bar = 20 µm) and age in the superficial layers (top) but not the deep layers (bottom). c FKBP51 immunostaining across the BA9 cortex using wide-field microscopy in adulthood (top panel, 37 years old), and later in life (bottom panel, 80 years old). Red represents staining with the neuronal markers NeuN, green represents staining of the FKBP51, and blue represents nuclear staining (Hoechst). The bottom images from each panel are at higher magnification taken from the white rectangle in the top right image. These images demonstrate FKBP51 staining is both high in neurons, and also is more intense (representing higher expression) at older ages
Fig. 6
Fig. 6
Golgi–Cox staining of dendritic spine subtypes in the orbitofrontal cortex (BA11) and correlation with FKBP5/BDNF gene expression levels analysed with single-nucleus RNA sequencing data derived from the same subjects. a Representative image of a cortical section stained with Golgi-Cox and a stained apical dendrite on a pyramidal neuron. b Classification of different types of dendritic spines: mushroom, stubby, thin and filopodia based on measurements of spine length (base to tip) as well as width (at the widest point) with a photographic example (above) and diagram (below). c Images showing dendritic spine densities in a subject expressing low FKBP5 mRNA levels vs high FKBP5 mRNA levels. Partial correlations accounting for age, PMI and RIN were performed to assess the association between FKBP5 gene expression and d mushroom spine densities and e BDNF gene expression, both showing a strong inverse correlation. f BDNF gene expression and mushroom spine density were strongly positively correlated

Comment in

References

    1. Arnsten AFT. Stress signalling pathways that impair prefrontal cortex structure and function. Nat Rev Neurosci. 2009;10:410–422. doi: 10.1038/nrn2648. - DOI - PMC - PubMed
    1. Bankhead P, Loughrey MB, Fernandez JA, Dombrowski Y, McArt DG, Dunne PD, et al. QuPath: Open source software for digital pathology image analysis. Sci Rep. 2017;7:16878. doi: 10.1038/s41598-017-17204-5. - DOI - PMC - PubMed
    1. Batiuk MY, Tyler T, Dragicevic K, Mei S, Rydbirk R, Petukhov V, et al. Upper cortical layer-driven network impairment in schizophrenia. Sci Adv. 2022 doi: 10.1126/sciadv.abn8367. - DOI - PMC - PubMed
    1. Benjamini Y, Hochberg Y. Controlling the false discovery rate: a practical and powerful approach to multiple testing. J Roy Stat Soc Ser B (Methodol) 1995;57:289–300.
    1. Bennett MR, Lagopoulos J. Stress and trauma: BDNF control of dendritic-spine formation and regression. Prog Neurobiol. 2014;112:80–99. doi: 10.1016/j.pneurobio.2013.10.005. - DOI - PubMed

Publication types

LinkOut - more resources