. 2023 Feb 2;80(2):56.
doi: 10.1007/s00018-023-04704-z.

Effect of ATG12-ATG5-ATG16L1 autophagy E3-like complex on the ability of LC3/GABARAP proteins to induce vesicle tethering and fusion

Affiliations

Effect of ATG12-ATG5-ATG16L1 autophagy E3-like complex on the ability of LC3/GABARAP proteins to induce vesicle tethering and fusion

Marina N Iriondo et al. Cell Mol Life Sci. .

Abstract

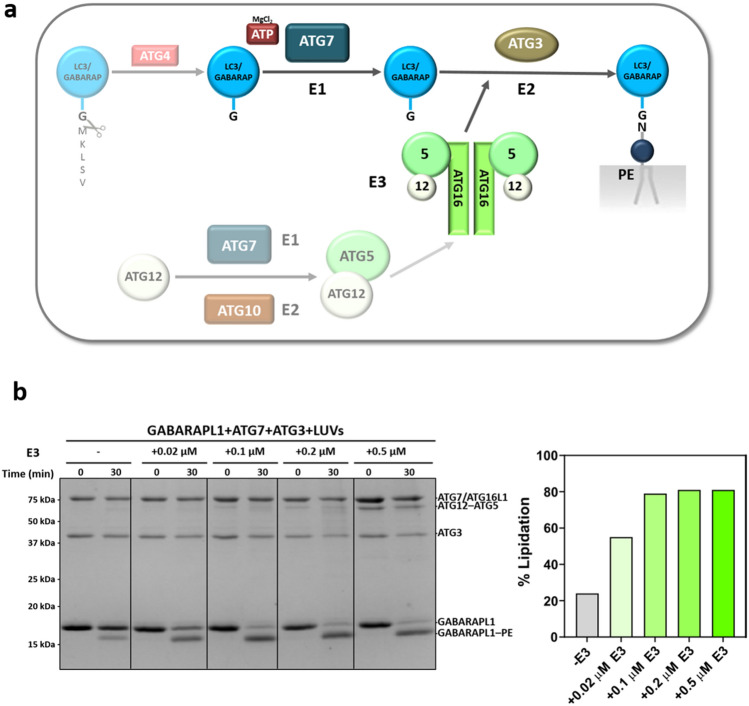
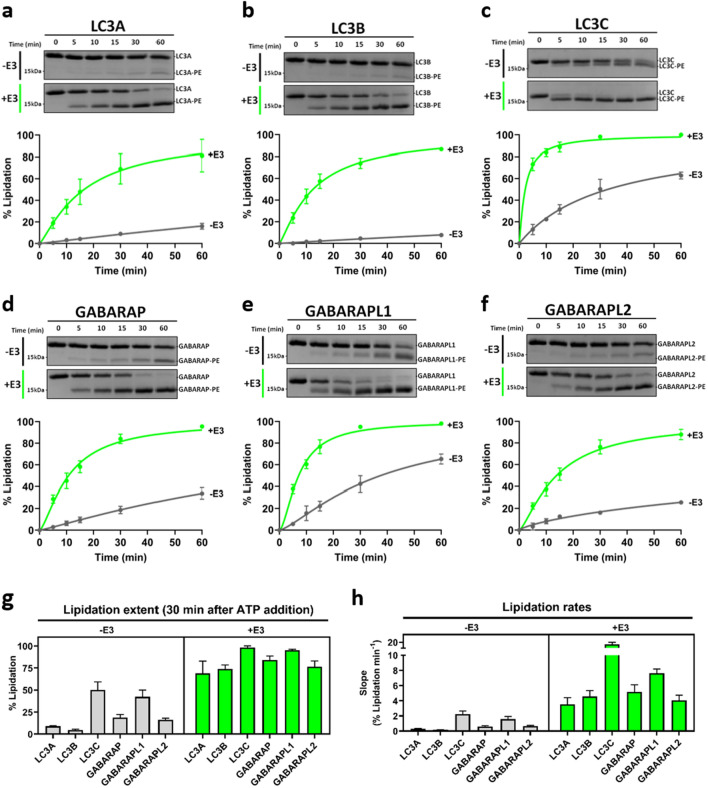
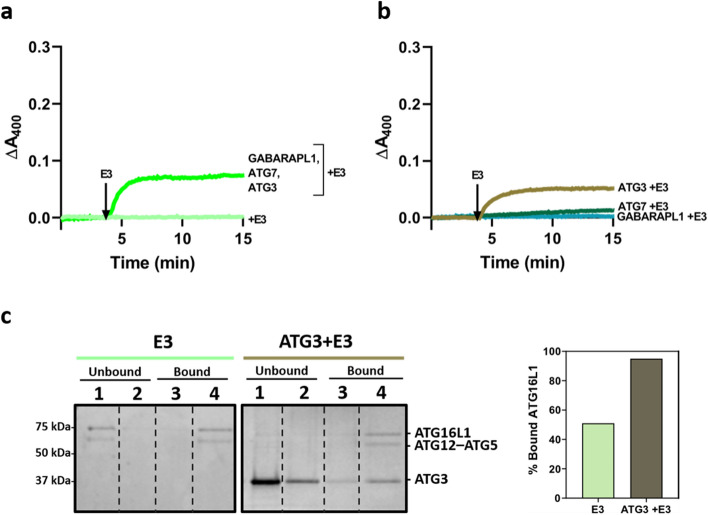
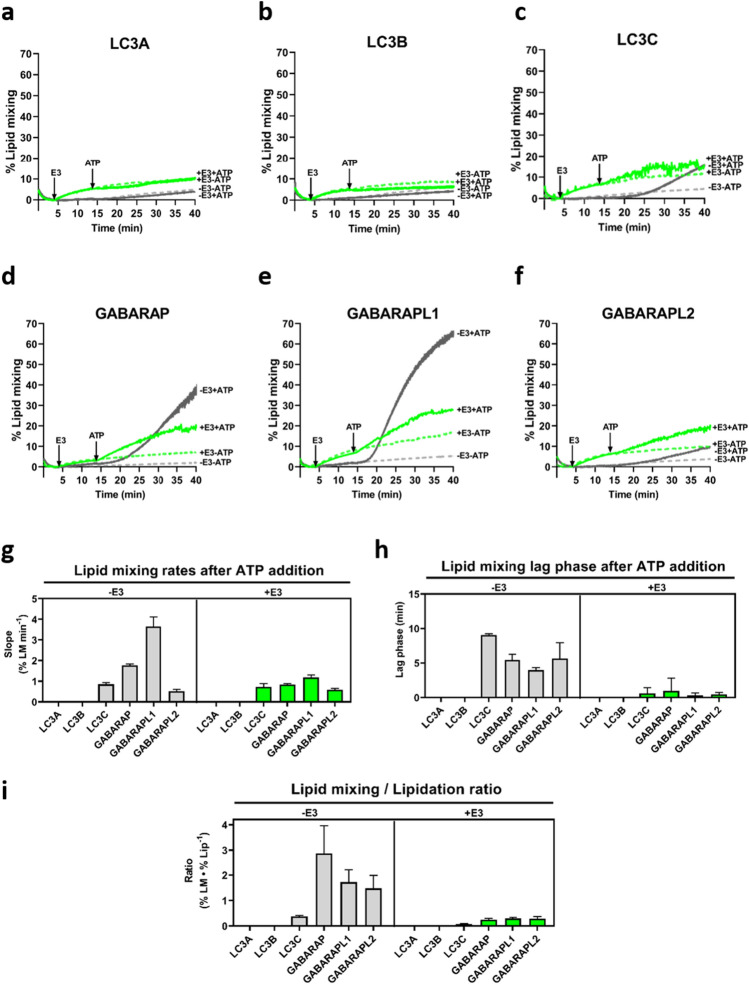
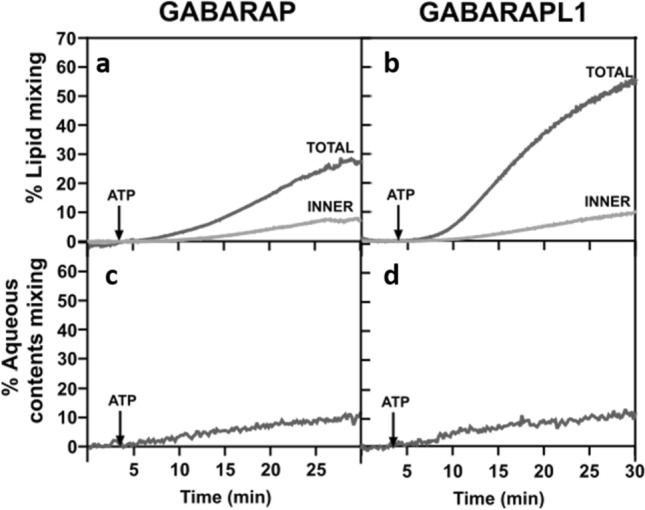
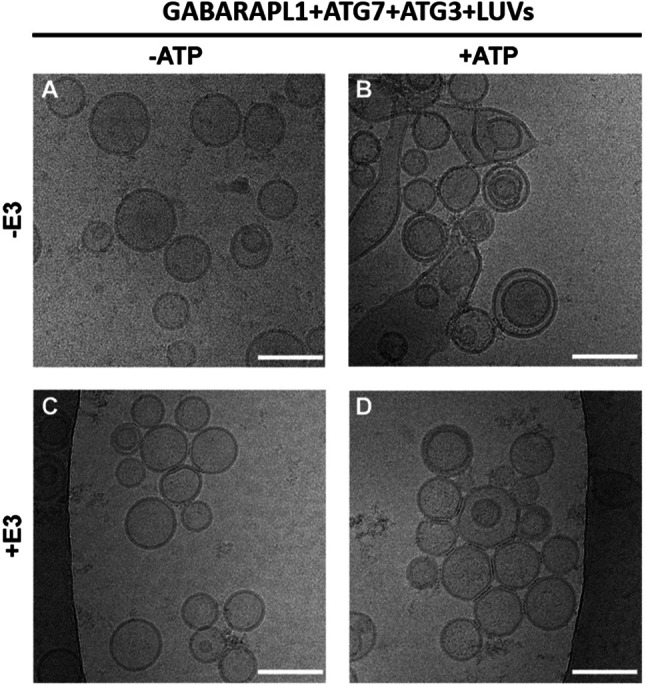
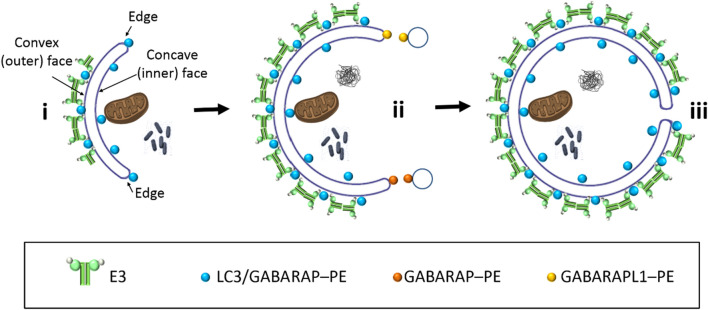
In macroautophagy, the autophagosome (AP) engulfs portions of cytoplasm to allow their lysosomal degradation. AP formation in humans requires the concerted action of the ATG12 and LC3/GABARAP conjugation systems. The ATG12-ATG5-ATG16L1 or E3-like complex (E3 for short) acts as a ubiquitin-like E3 enzyme, promoting LC3/GABARAP proteins anchoring to the AP membrane. Their role in the AP expansion process is still unclear, in part because there are no studies comparing six LC3/GABARAP family member roles under the same conditions, and also because the full human E3 was only recently available. In the present study, the lipidation of six members of the LC3/GABARAP family has been reconstituted in the presence and absence of E3, and the mechanisms by which E3 and LC3/GABARAP proteins participate in vesicle tethering and fusion have been investigated. In the absence of E3, GABARAP and GABARAPL1 showed the highest activities. Differences found within LC3/GABARAP proteins suggest the existence of a lipidation threshold, lower for the GABARAP subfamily, as a requisite for tethering and inter-vesicular lipid mixing. E3 increases and speeds up lipidation and LC3/GABARAP-promoted tethering. However, E3 hampers LC3/GABARAP capacity to induce inter-vesicular lipid mixing or subsequent fusion, presumably through the formation of a rigid scaffold on the vesicle surface. Our results suggest a model of AP expansion in which the growing regions would be areas where the LC3/GABARAP proteins involved should be susceptible to lipidation in the absence of E3, or else a regulatory mechanism would allow vesicle incorporation and phagophore growth when E3 is present.

Keywords: ATG12 UBL system; Autophagosome expansion; Autophagy conjugation systems; Human ATG8; Lipid-protein interaction; Membrane fusion.


Conflict of interest statement

The authors have not disclosed any competing interests.

Figures

Fig. 1
Fig. 1
LC3/GABARAP in vitro lipidation in the presence of E3. a Schematic representation of the reconstituted LC3/GABARAP lipidation system used in this study. ATP promoted ATG7 (E1-like), ATG3 (E2-like) and ATG12-ATG5-ATG16 (E3-like) actions triggering LC3/GABARAP conjugation to PE in PE-containing liposomes. LC3/GABARAP proteins had their Gly C-terminal exposed to avoid the requirement of ATG4 participation. E3 was expressed in insect cells. b In vitro GABARAPL1 lipidation assay in the presence of increasing E3 concentrations. Left: 0.5 µM ATG7, 1 µM ATG3, and 5 µM GABARAPL1 (see Supp. Fig. 1b for further details) were mixed with 0.4 mM LUV (ePC:DOPE:PI:DOG (33:55:10:2 mol ratio)), in the absence (-) or in the presence of different E3 concentrations (0.02, 0.1, 0.2, 0.5 μM), and incubated at 37 °C in System Buffer containing MgCl2 and ATP. Aliquots were retrieved 0 and 30 min after ATP addition and loaded on a 15% SDS–polyacrylamide gel. Right: Percent lipidated protein, quantified as described under Methods
Fig. 2
Fig. 2
E3 increases and accelerates LC3/GABARAP lipidation. a–f In vitro LC3/GABARAP lipidation assay: 0.5 µM ATG7, 1 µM ATG3, and 5 µM of the indicated LC3/GABARAP protein were mixed with 0.4 mM LUV (ePC:DOPE:PI:DOG (33:55:10:2 mol ratio)), in the absence (− E3, gray) or presence (+ E3, green) of 0.1 µM E3 and incubated at 37 °C. After ATP addition, aliquots retrieved at pre-fixed time points were loaded on a 15% SDS–polyacrylamide gel. Upper panel: Crop of representative lipidation gels corresponding to the LC3/GABARAP protein region (An example of a full gel can be seen in Fig. 1b). Lower panel: Time-course of the protein percent lipidation. g Percent lipidated LC3/GABARAP 30 min after ATP addition in the absence (left) or presence (right) of E3. h Initial lipidation rates of the various LC3/GABARAP in the absence (left) or presence (right) of E3. Data are means ± SD (n = 3)
Fig. 3
Fig. 3
In the presence of ATG3, low concentrations of E3 allow vesicle tethering. a, b Changes in turbidity (ΔA400), as a signal of vesicle tethering, were measured after E3 addition. a Tethering of 0.4 mM LUV [ePC:DOPE:PI:DOG (33:55:10:2 mol ratio)] caused by 0.1 µM E3 alone (light green line) or in the presence of 5 µM GABARAPL1, 0.5 µM ATG7 and 1 µM ATG3 (green line). b Tethering of 0.4 mM LUV [ePC:DOPE:PI:DOG (33:55:10:2 mol ratio)] caused by addition of 0.1 µM E3 in the presence of 5 µM GABARAPL1 (blue line), 0.5 µM ATG7 (dark green line) or 1 µM ATG3 (ochre line). c Interaction of E3 with membranes in the absence and in the presence of ATG3 measured by a vesicle flotation assay. Protein and liposome concentrations were increased by fivefold to allow detection of E3 in the gels. 0.5 µM E3 was incubated with 2 mM LUV [ePC:DOPE:PI:DOG (33:55:10:2 mol ratio)] in the absence or presence of 2.5 µM ATG3. Left: SDS-PAGE/Coomassie Brilliant Blue-stained gels of the fractions obtained from E3 vesicle flotation assays in the absence (-ATG3 panel) or presence of ATG3 (+ ATG3 panel). Protein found in fractions 3 + 4 was taken as bound protein. Right: Percent ATG16L1 bound to liposomes in the absence or presence of ATG3, quantified by gel densitometry
Fig. 4
Fig. 4
E3 effect on lipidation enhances and accelerates LC3/GABARAP-promoted vesicle tethering. Membrane tethering activities by lipidated LC3/GABARAP proteins in the absence and presence of E3. 0.4 mM LUV [ePC:DOPE:PI:DOG (33:55:10:2 mol ratio)], 0.5 µM ATG7, 1 µM ATG3, and 5 µM of the pertinent LC3/GABARAP family member were mixed. After 4 min, either 0.1 µM E3 (+ E3, green lines) or buffer (− E3, gray lines) was added, and 10 min later, ATP (+ ATP, solid lines) or buffer (-ATP, dashed lines) was added. Changes in absorbance at 400 nm (ΔA400), as an indication of vesicle tethering, were measured. a–f Representative curves of the indicated LC3/GABARAP member in the four conditions analyzed: − E3 -ATP (gray dashed lines), − E3 + ATP (gray solid lines), + E3 -ATP (green dashed lines), + E3 + ATP (green solid lines). g Tethering rates after ATP addition in the absence (left) or in the presence (right) of E3. LC3A or LC3B did not cause any measurable activity. Data are means ± SD (n = 3). h Lag phase of tethering activity after ATP addition in the absence (left) or in the presence (right) of E3. Data are means ± SD (n = 3). i Tethering/lipidation ratios: Final tethering levels caused by lipidated LC3/GABARAP proteins related to the percent lipidated protein present, in the absence (left) or in the presence (right) of E3. See also Supp. Fig. 9. Data are means ± SD (n = 3)
Fig. 5
Fig. 5
E3 hampers LC3/GABARAP capacity to induce inter-vesicular lipid mixing. Membrane lipid mixing activities by lipidated LC3/GABARAP proteins in the absence and in the presence of E3 were monitored with the NBD-PE/Rho-PE lipid dilution assay. 0.4 mM unlabeled and (NBD-PE + Rho-PE)-labeled liposomes (9:1) were mixed with 0.5 µM ATG7, 1 µM ATG3, and 5 µM of the pertinent LC3/GABARAP family member. After 4 min, either 0.1 µM E3 (+ E3, green lines) or buffer (− E3, gray lines) was added, followed 10 min later by ATP (+ ATP, solid lines) or buffer (-ATP, dashed lines). Increases in NBD fluorescence detection, as a signal of lipid mixing of labeled and unlabeled vesicles, were measured and the percentage of lipid mixing was calculated. See Methods for details. a–f Representative curves of the indicated LC3/GABARAP member in the four conditions analyzed: − E3 -ATP (gray dashed lines), − E3 + ATP (gray solid lines), + E3 -ATP (green dashed lines), + E3 + ATP (green solid lines). g Lipid mixing rates after ATP addition in the absence (left) or in the presence (right) of E3. LC3A or LC3B did not cause any measurable activity. Data are means ± SD (n = 3). h Lag phase of lipid mixing after ATP addition in the absence (left) or in the presence (right) of E3. Data are means ± SD (n = 3). i Final lipid mixing levels caused by lipidated LC3/GABARAP proteins related to the percent lipidated protein present, in the absence (left) or in the presence (right) of E3. Data are means ± SD (n = 3)
Fig. 6
Fig. 6
GABARAPL1 and GABARAP cause membrane hemifusion but are poor inducers of vesicle-vesicle fusion. a, b Representative curves of total (gray) and inner (light gray) lipid mixing activities by lipidated GABARAP (a) and GABARAPL1 (b) in the absence of the E3, monitored with the NBD-PE/Rho-PE lipid dilution assay. For inner monolayer lipid mixing, NBD/Rho-liposomes were pretreated with the appropriate amounts of sodium dithionite to quench NBD fluorescence of the outer leaflet. 0.4 mM of unlabeled and (NBD-PE + Rho-PE)-labeled liposomes (9:1) were mixed with 0.5 µM ATG7, 1 µM ATG3, and 5 µM of the pertinent LC3/GABARAP family member. After 4 min incubation, ATP was added. c, d Representative curves of aqueous contents mixing activities by lipidated GABARAP (c) and GABARAPL1 (d) in the absence of E3, monitored with the ANTS/DPX mixing assay. 0.4 mM ANTS and DPX liposomes (1:1) were mixed with 0.5 µM ATG7, 1 µM ATG3, and 5 µM of the pertinent LC3/GABARAP family member. After 4 min incubation, ATP was added. Co-encapsulated ANTS- and DPX-containing LUV were used to determine the 100% of aqueous contents mixing
Fig. 7
Fig. 7
GABARAPL1 ability to tether and fuse vesicles in the absence and presence of E3 analyzed by cryo-EM. Cryo-EM images of the four conditions analyzed in Figs 4E and 5E. 0.5 µM ATG7, 1 µM ATG3, and 5 µM GABARAPL1 were mixed with 0.4 mM LUV [ePC:DOPE:PI:DOG (33:55:10:2 mol ratio)], in the absence (− E3) or in the presence (+ E3) of 0.1 µM E3. After addition of buffer (-ATP) or ATP (+ ATP), the mixture was incubated at 37 °C for 90 min. a–d Cryo-EM images of liposomes after reconstituting GABARAPL1 conjugation reaction: a in the absence of E3 and ATP, b in the absence of E3 but in the presence of ATP, c in the presence of E3 but in the absence of ATP and d in the presence of both E3 and ATP. Bar = 100 nm
Fig. 8
Fig. 8
Role of the LC3/GABARAP proteins and E3 in the phagophore expansion process: a hypothetical model based on the results in this work. (i) LC3/GABARAP–PE is distributed along the whole phagophore surface. E3 could form an immobilescaffold with lipidated LC3/GABARAP proteins on the convex side of the outer bilayer [58], but not on the edges and growing zones of the phagophore. (ii) GABARAP and GABARAPL1 are the main candidates to promote the phagophore expansion, particularly on the highly curved edges, as these proteins reach faster the necessary lipidation levels to trigger vesicle tethering and inter-vesicular lipid mixing. (iii) The subsequent vesicle fusion mediated by the tethering and lipid mixing ability of these proteins (with the concerted action of other factors and proteins) will cause the expansion of the phagophore. See main text for details

References

    1. Cable J, Weber-Ban E, Clausen T, et al. Targeted protein degradation: from small molecules to complex organelles—a Keystone Symposia report. Ann N Y Acad Sci. 2022;1510:79–99. doi: 10.1111/NYAS.14745. - DOI - PubMed
    1. Okamoto K. Organellophagy: eliminating cellular building blocks via selective autophagy. J Cell Biol. 2014;205:435–445. doi: 10.1083/JCB.201402054. - DOI - PMC - PubMed
    1. Noda NN, Inagaki F. Mechanisms of autophagy. Annu Rev Biophys. 2015;44:101–122. doi: 10.1146/annurev-biophys-060414-034248. - DOI - PubMed
    1. Anding AL, Baehrecke EH. Cleaning house: selective autophagy of organelles. Dev Cell. 2017;41:10–22. doi: 10.1016/J.DEVCEL.2017.02.016. - DOI - PMC - PubMed
    1. Klionsky DJ, Petroni G, Amaravadi RK, et al. Autophagy in major human diseases. EMBO J. 2021;40:e108863. doi: 10.15252/EMBJ.2021108863. - DOI - PMC - PubMed

MeSH terms

LinkOut - more resources