. 2023 Feb 7;120(6):e2212650120.
doi: 10.1073/pnas.2212650120. Epub 2023 Feb 2.

Breakdown of clonal cooperative architecture in multispecies biofilms and the spatial ecology of predation

Affiliations

Breakdown of clonal cooperative architecture in multispecies biofilms and the spatial ecology of predation

Benjamin R Wucher et al. Proc Natl Acad Sci U S A. .

Abstract

Biofilm formation, including adherence to surfaces and secretion of extracellular matrix, is common in the microbial world, but we often do not know how interaction at the cellular spatial scale translates to higher-order biofilm community ecology. Here we explore an especially understudied element of biofilm ecology, namely predation by the bacterium Bdellovibrio bacteriovorus. This predator can kill and consume many different Gram-negative bacteria, including Vibrio cholerae and Escherichia coli. V. cholerae can protect itself from predation within densely packed biofilm structures that it creates, whereas E. coli biofilms are highly susceptible to B. bacteriovorus. We explore how predator-prey dynamics change when V. cholerae and E. coli are growing in biofilms together. We find that in dual-species prey biofilms, E. coli survival under B. bacteriovorus predation increases, whereas V. cholerae survival decreases. E. coli benefits from predator protection when it becomes embedded within expanding groups of highly packed V. cholerae. But we also find that the ordered, highly packed, and clonal biofilm structure of V. cholerae can be disrupted if V. cholerae cells are directly adjacent to E. coli cells at the start of biofilm growth. When this occurs, the two species become intermixed, and the resulting disordered cell groups do not block predator entry. Because biofilm cell group structure depends on initial cell distributions at the start of prey biofilm growth, the surface colonization dynamics have a dramatic impact on the eventual multispecies biofilm architecture, which in turn determines to what extent both species survive exposure to B. bacteriovorus.

Keywords: architecture; biofilm; cooperation; matrix; predator–prey.


Conflict of interest statement

The authors declare no competing interest.

Figures

Fig. 1.
Fig. 1.
Population dynamics in monoculture and dual-culture biofilms of V. cholerae (red) and E. coli (yellow) undergoing predation by B. bacteriovorus (cyan). Biofilms of V. cholerae and E. coli were grown for 48 h prior to B. bacteriovorus predator exposure. (A) Population dynamics of each prey species in monoculture and dual-culture biofilm growth (n = 4). (B) Percent change in prey biovolume, a direct proxy for population size, 48 h after predator introduction relative to just prior to predator introduction, both in single species prey biofilm controls and dual-species prey co-culture biofilm conditions. (V. cholerae monoculture n = 10; V. cholerae dual culture n = 9; E. coli monoculture n = 4; E. coli dual culture n = 9). Pairwise comparisons were performed by Mann–Whitney U tests. (C–E) Representative images of dual-culture biofilms at (C) 48 h after initial prey inoculation (just prior to predator introduction; "hpi" denotes "hours post-introduction" of predators), (D) 24 h post-introduction of predators, and (E) 48 h post-introduction of predators. Inset frames show regions with details of predators entering host cells and forming rounded bdelloplasts, indicating active predation. Images are single optical sections just above the glass substratum, showing the bottom layers of the biofilms.
Fig. 2.
Fig. 2.
E. coli (yellow) enveloped within highly packed V. cholerae biofilms (red) can be protected from B. bacteriovorus (cyan) exposure. (A) Representative image demonstrating the ability of highly packed V. cholerae biofilms to protect E. coli biomass from access by B. bacteriovorus. The image is a single optical section just above the glass substratum. (B) Heatmap of the degree of predation on E. coli, quantifying raw data from panel A. Red circles denote boundaries of highly packed V. cholerae cell groups. (C) Heatmap of V. cholerae fluorescence within 5 μm of each unit of segmented biovolume of E. coli from panel A.
Fig. 3.
Fig. 3.
V. cholerae (red) and E. coli (yellow) exhibit two distinct joint biofilm morphologies in co-culture that strongly affect B. bacteriovorus (cyan) predation susceptibility. (A) Representative image of both biofilm dual-species cell group types, which can occur in close proximity. The structure we term "ordered" more closely resembles the architecture V. cholerae produces on its own and is shown on the lower left in this image. The novel, well-mixed structure, which we term "disordered", is shown on the upper right. (B and C) Additional higher magnification images detailing the architecture of ordered and disordered colony morphologies. (D) Heatmap of the combined two-species neighborhood cell packing values for the image in panel A. (E) Scatterplot of the degree of predation on V. cholerae as a function of the fluorescence of E. coli in proximity to V. cholerae biomass. The data are split according to whether they are from ordered architecture colonies (n = 11), or disordered colonies (n = 8). (F) Within-species cell packing for V. cholerae (red) and E. coli (yellow) in 48 h incubated cell groups of each structure type (ordered n = 11; disordered n = 8). Pairwise comparisons were performed by Wilcoxon signed ranks tests.
Fig. 4.
Fig. 4.
Initial distance between V. cholerae (red) and E. coli (yellow) cells best distinguishes colonies that will become highly packed and predation-protected versus disordered and predation-susceptible. (A) Time lapse of 3D renderings of an example ordered cell group with (B) a heatmap for neighborhood cell packing at the 36 h time point. (C) Time lapse of 3D renderings of an example disordered cell group with (D) a heatmap for neighborhood cell packing at the 36 h time point. Renderings in panels A and C are 31 μm × 31 μm × 14 μm (LxWxD). (EG) Time courses for (E) combined biovolume of both species, (F) V. cholerae frequency, (G) average distance of V. cholerae cells to nearest E. coli (n = 8 for each colony type). (H) Statistical comparison of V. cholerae distance to nearest E. coli between biofilm types at the start and end of courses in G (Mann–Whitney U tests with n = 8). (I) Top-down view of a V. cholerae cluster as a core high-packing region nucleates (each rendering is 31 μm × 31 μm × 14 μm) (LxWxD). The secondary biofilm front that forms the boundary of this core high-packing region is denoted with a dotted white circle in the 24 h time point image. (J) Time courses of neighborhood cell packing in the core regions (within 10 μm of colony center) of both colony types (n = 8).
Fig. 5.
Fig. 5.
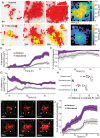
Initial surface colonization density alters the fraction of highly packed versus disordered colonies of V. cholerae (red) and E. coli (yellow), which in turn alters overall population dynamics and B. bacteriovorus (cyan) predator survival for both prey. (A and B) Representative image sets of the low-density (A) and high-density (B) colonization conditions at initial surface colonization through 96 h post-predator introduction. (C and D) Biovolume of all three species as a proxy for their population dynamics in the (C) low-density initial condition and (D) high-density initial condition (n = 5). (E) Percent of each prey species remaining at the end of the predation experiments in the low and high colonization density initial conditions (n = 5; plots denote medians with interquartile ranges). The percentage remaining is calculated as the biovolume of each prey species at the last time point (146 h) relative to the biovolume that was present just prior to the introduction of B. bacteriovorus predators. Pairwise comparisons denote Mann–Whitney U tests.

Comment in

References

    1. Mayr E., 80 years of watching the evolutionary scenery. Science 305, 46–47 (2004). - PubMed
    1. Cordero O. X., Datta M. S., Microbial interactions and community assembly at microscales. Curr. Opin. Microbiol. 31, 227–234 (2016). - PMC - PubMed
    1. Gralka M., Szabo R., Stocker R., Cordero O. X., Trophic interactions and the drivers of microbial community assembly. Curr. Biol. CB 30, R1176–R1188 (2020). - PubMed
    1. Hibbing M. E., Fuqua C., Parsek M. R., Peterson S. B., Bacterial competition: Surviving and thriving in the microbial jungle. Nat. Rev. Microbiol. 8, 15–25 (2010). - PMC - PubMed
    1. Datta M. S., Sliwerska E., Gore J., Polz M. F., Cordero O. X., Microbial interactions lead to rapid micro-scale successions on model marine particles. Nat. Commun. 7, 11965–11965 (2016). - PMC - PubMed

Publication types

LinkOut - more resources