. 2023 Feb 7;120(6):e2114204120.
doi: 10.1073/pnas.2114204120. Epub 2023 Feb 2.

Persistent binding at dopamine transporters determines sustained psychostimulant effects

Affiliations

Persistent binding at dopamine transporters determines sustained psychostimulant effects

Marco Niello et al. Proc Natl Acad Sci U S A. .

Abstract

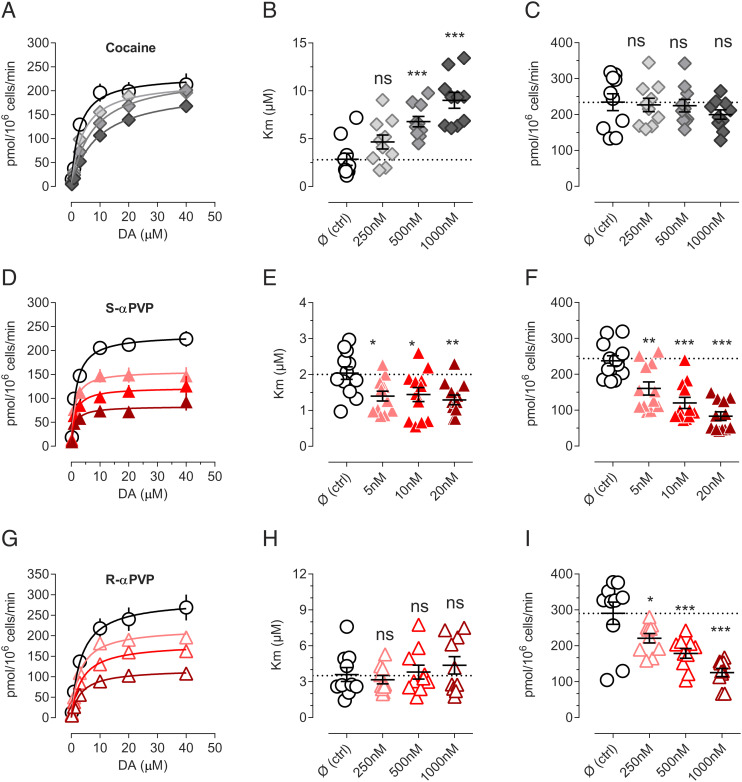
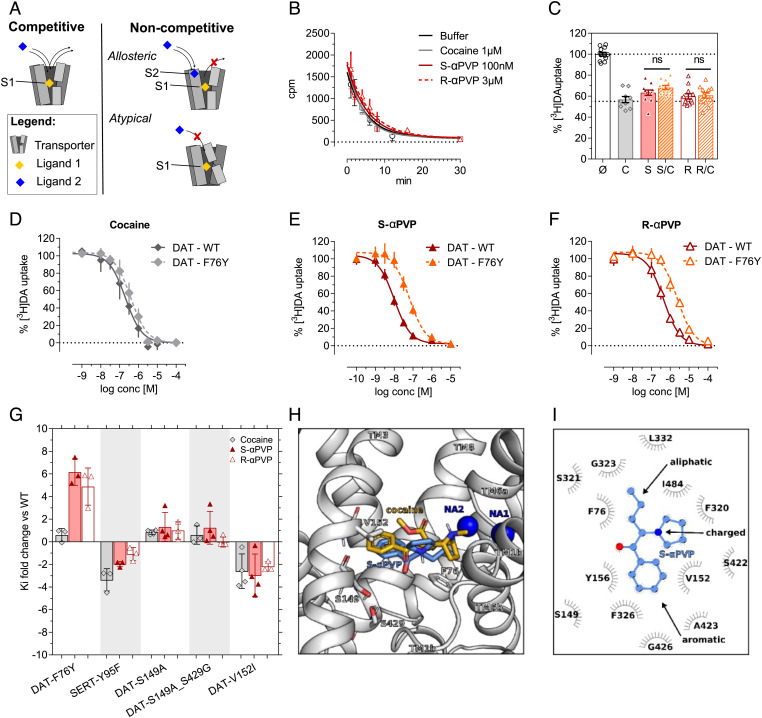
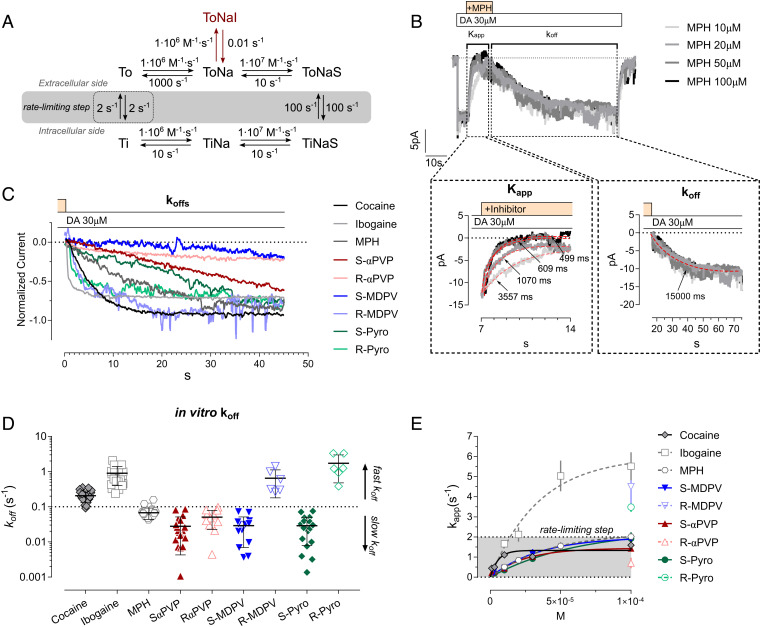
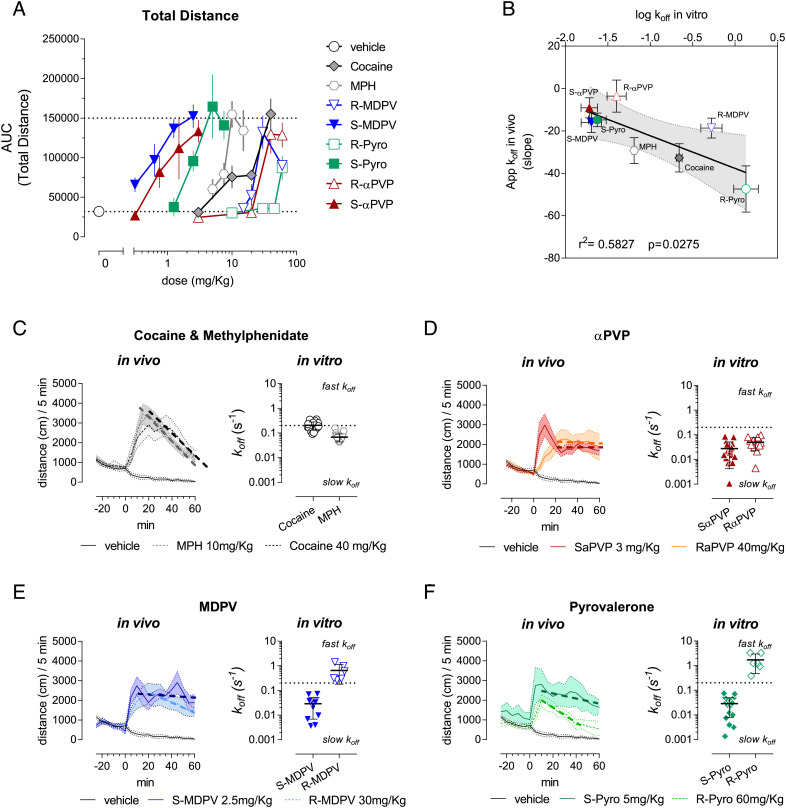
Psychostimulants interacting with the dopamine transporter (DAT) can be used illicitly or for the treatment of specific neuropsychiatric disorders. However, they can also produce severe and persistent adverse events. Often, their pharmacological properties in vitro do not fully correlate to their pharmacological profile in vivo. Here, we investigated the pharmacological effects of enantiomers of pyrovalerone, α-pyrrolidinovalerophenone, and 3,4-methylenedioxypyrovalerone as compared to the traditional psychostimulants cocaine and methylphenidate, using a variety of in vitro, computational, and in vivo approaches. We found that in vitro drug-binding kinetics at DAT correlate with the time-course of in vivo psychostimulant action in mice. In particular, a slow dissociation (i.e., slow koff) of S-enantiomers of pyrovalerone analogs from DAT predicts their more persistent in vivo effects when compared to cocaine and methylphenidate. Overall, our findings highlight the critical importance of drug-binding kinetics at DAT for determining the in vivo profile of effects produced by psychostimulant drugs.

Keywords: cathinones; dopamine transporter; drug-binding kinetics; new psychoactive substances; psychostimulants.


Conflict of interest statement

The authors declare no competing interest.

Figures

Fig. 1.
Fig. 1.
Non-competitive inhibition of αPVP enantiomers. (A) Saturation of DA uptake conducted in the presence of cocaine 250 nM (light gray), 500 nM (gray), or 1,000 nM (dark gray). (B) Cocaine increases Km in dose-dependent manner but (C) does not decrease Vmax. (D) Saturation of DA uptake conducted in the presence of S-αPVP 5 nM (light red), 10 nM (red), or 20 nM (dark red). (E) αPVP does not drastically change the Km, but (F) reduces Vmax dose-dependently. (G) Saturation of DA uptake conducted in the presence of R-αPVP 250 nM (light red), 500 nM (red), or 1,000 nM (dark red). (H) R-αPVP does not drastically change the Km, but (I) reduces Vmax dose-dependently. Data are shown as mean ± SEM of at least five independent experiments conducted in duplicates. Statistics is conducted with one-way ANOVA followed by Dunnett’s post hoc multiple comparison vs. control (Ø). **=P < 0.01, ***P < 0.001, ****P < 0.0001.
Fig. 2.
Fig. 2.
Cocaine and αPVP enantiomers binding mode in DAT. (A) Mechanism of action of competitive and non-competitive (allosteric vs. atypical) inhibition. (B) Dissociation of [3H]WIN35428 in DAT membranes. Data are mean ± SEM n ≥ 3 independent experiments conducted in duplicates. (C) Single-point uptake inhibition of 0.2 µM [3H]DA conducted in HEK293cells stably expressing DAT. Compounds are pre-incubated at their IC50 alone or in combinations (Ø =control, untreated; C =  cocaine 100 nM; S = S-αPVP 10 nM; S/C =  cocaine 100 nM + S-αPVP 10 nM; R =  R-αPVP 300 nM; R/C = R-αPVP 300 nM + cocaine 100 nM). One-way ANOVA followed by Dunnett´s multiple comparison test vs. cocaine *=P < 0.05, **=P < 0.01, ***=P < 0.001. (CF) DAT-WT and DAT-F76Y uptake inhibition profiles for cocaine, S-αPVP and R-αPVP. (G) Site-directed mutagenesis of DAT orthosteric binding site. DAT residues are mutated in the corresponding residue in SERT. Data are shown as Ki fold change compared to WT DAT (mean ± SD). Every symbol represents an individual experiment conducted in triplicate. (H) Membrane and front view of the S1 site of the human DAT showing the best docking pose of S-αPVP (blue) and the binding pose of cocaine elucidated by X-Ray in dDAT (PDB: 4XP4) (orange). TM10 and TM11 are not shown for clarity, while residues F76, S149, V152, and S429 are highlighted as sticks and colored by atom type. The two sodium ions are represented as dark blue spheres. (I) 2D interaction map of S-αPVP with the human DAT according to the binding mode shown in panel H.
Fig. 3.
Fig. 3.
Binding kinetics of cocaine and αPVP enantiomers at DAT. (A) Simplified DAT transport cycle used in the kinetic model with the kinetic rates for each partial reaction. The rate-limiting step is highlighted with the dashed rectangle and (B) representative trace and protocol employed for the measurement. DA application is highlighted by the white box, while the inhibitor application is highlighted by the yellow box. Dashed boxes indicate the part of the traces used for extrapolated the maximal inhibitory rate (Kapp, Left Inset) or dissociation rates (koff, Right Inset). Nonlinear regression fit of the different traces is represented with the red-dashed lines, together with the relative extrapolated decay time (tau; ms). (C) Corrected and normalized current rescue depicting the concentration-independent dissociation rates of the inhibitor. (D) Quantification of the dissociation rates of the tested DAT inhibitors. Data are mean ± SD. Each symbol represents an independent cell. (E) Representative trace of the synthetic currents obtained from the kinetic model. (E) Maximal rate of inhibition measured by extrapolating the time of current inhibition (Kapp) at different concentrations of the tested inhibitor.
Fig. 4.
Fig. 4.
DAT-mediated psychomotor effects in mice. (A) Dose-dependent effects of the DAT inhibitor tested in the total ambulatory distance measured over 60 min from i.p. injection. (B) Linear correlation between the apparent in vivo koff and the log10 of the koff measured in vitro. Linear regression led to a straight line with the equation Y = −15.43*X − 37.7; P =0.0275, F = 8.379, r2 = 0.5827. (CF) Comparison of the decline of action with the measured in vitro koff for cocaine and MPH (C), S- and R-αPVP (D), S- and R-MDPV (E), S- and R-Pyrovalerone (F).

References

    1. Kristensen A. S., et al. , SLC6 neurotransmitter transporters: Structure, function, and regulation. Pharmacol. Rev. 63, 585–640 (2011), 10.1124/pr.108.000869. - DOI - PubMed
    1. Kilty J. E., Lorang D., Amara S. G., Cloning and expression of a cocaine-sensitive rat dopamine transporter. Science 254, 578–579 (1991), 10.1126/science.1948035. - DOI - PubMed
    1. Shimada S., et al. , Cloning and expression of a cocaine-sensitive dopamine transporter complementary DNA. Science 254, 576–578 (1991), 10.1126/science.1948034. - DOI - PubMed
    1. Giros B., Jaber M., Jones S. R., Wightman R. M., Caron M. G., Hyperlocomotion and indifference to cocaine and amphetamine in mice lacking the dopamine transporter. Nature 379, 606–612 (1996), 10.1038/379606a0. - DOI - PubMed
    1. Penmatsa A., Wang K. H., Gouaux E., X-ray structure of dopamine transporter elucidates antidepressant mechanism. Nature 503, 85–90 (2013), 10.1038/nature12533. - DOI - PMC - PubMed

Publication types

MeSH terms

LinkOut - more resources